• Please try to select the correct prefix when making a new thread in this folder.

    Discuss is for general discussions of a financial company or issues related to companies.

    Info is for things like "Has anyone heard of Company X?" or "Is Company X legit or not?"

    Compare is for things like "Which of these 2 (or more) companies is best?"

    Searching is for things like "Help me pick a broker" or "What's the best VPS out there for trading?"

    Problem is for reporting an issue with a company. Please don't just scream "CompanyX is a scam!" It is much more useful to say "I can't withdraw my money from Company X" or "Company Y is not honoring their refund guarantee" in the subject line.
    Keep Problem discussions civil and lay out the facts of your case. Your goal should be to get your problem resolved or reported to the regulators, not to see how many insults you can put into the thread.

    More info coming soon.

Discuss RoboForex.com

General discussions of a financial company
How does Pump and Dump Strategy Work? Discussing the Examples

Author: Eugene Savitsky

roboforex-header.jpg


Dear Traders,

In order to make money on the stock market, a trader must either have patience or a trading system. Patience makes the most of the money on the stock market. The only thing a trader must do to receive profit is to buy stocks on several different companies (for risk diversification) without the leverage, with dividend payouts if possible, and hold them until there is a wish to take profit.

Stocks portfolio at Finviz.com

I’ll show a simple example. At Finviz.com, you can create your own demo stocks portfolio with the information on the time of purchase and the current profit. In 2013, which was almost seven years ago, I wanted to know what kind of money I could make by buying stocks and holding them for a long time. so, I created my demo portfolio and forgot about it.

At that time, I was choosing stocks on some kind of principles I had. Finally, I bought one share of Delta Airlines (NYSE: DAL) at 56.79 USD and и 4 cheap shares that cost less than 20 USD each. By now, the portfolio profit has exceeded 48,000 USD. However, at some moments the portfolio value was more than 100,000 not including dividends.

finviz-portfolio-1200x129.png


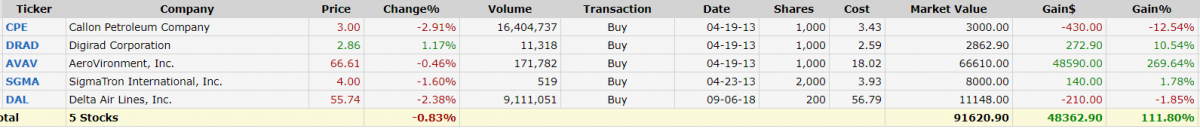
Thereby, taking into account purchasing prices in 2013, 43,258 USD were invested in these shares, which makes the average annual yield 16% and that’s much more than the yield of any bank deposit calculated in USD.

Pump and Dump strategy

When it comes to a trading strategy, it’s much more complicated. There are a lot of different trading systems: some of them make a profit on trend markets, while others – during “dead season”. Some people trade at level breakouts, while others do the opposite. However, in all these systems, periods of profit are followed by periods of losses. As a result, each of these systems requires some particular market conditions, when they will ear profit.

But today we’ll talk about one of the systems, which doesn’t depend on the market environment, the country’s economy, crisis, or something like that. This trading system has always been and will always be efficient as long as trading operations on the stock market are performed by a man.

This trading system is based on nothing but human greed and wish to make a fast buck. And you know, the greed will always follow the money.

The trading system’s name is Pump and Dump.

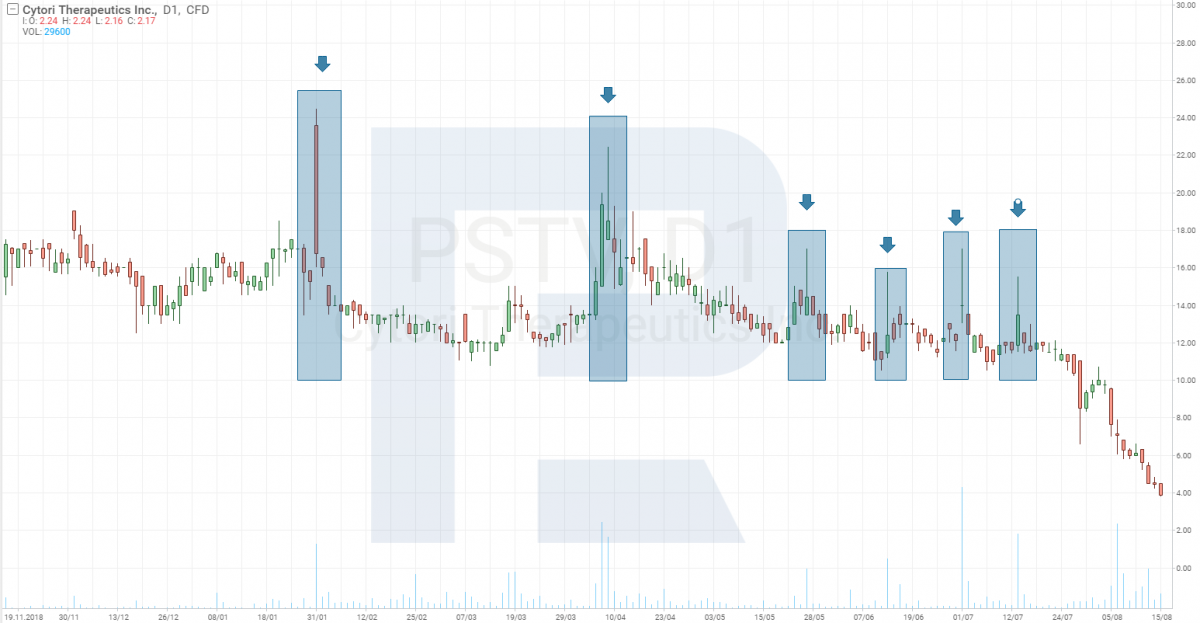
Example with NanoViricides Inc

So, pay attention to NanoViricides Inc (NYSE: NNVC) stocks. Until the middle of 2019, the average traded volume didn’t exceed 50.000 shares per trading session, while the trading range was between 1 and 3 USD per stock. However, in only a month, the daily traded volume skyrocketed up to 4.4M shares per trading session and in 4 days it was more than 33M shares. And this was happening to the company, the capitalization of which was less than 32M USD with only 17 people on the staff.

nnvc-d1-1200x541.png


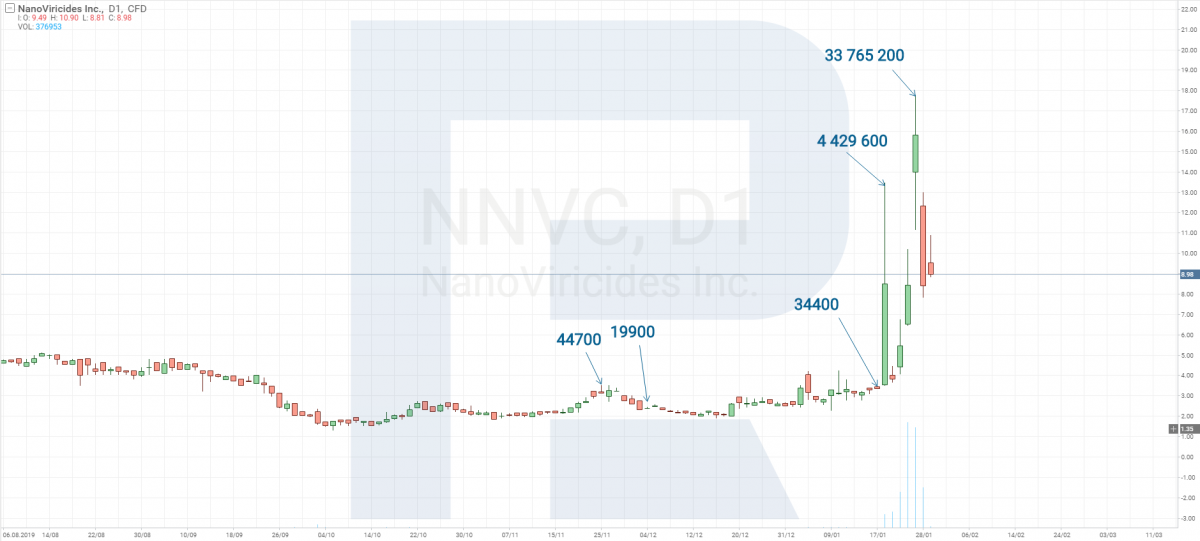
For a better understanding of the volume growth rate, let’s compare it with a famous car manufacturer, Ford (NYSE: F), shares of which are also not very expensive. The average traded volume in Ford is 35M shares, but its capitalization is 35B USD and the staff includes 199,000 employees. Sizes of these companies are way too different, but the traded volume of shares is almost the same.

Read more at R Blog - RoboForex

Sincerely,
RoboForex team
 
RoboForex: changes in trading schedule (President’s Day in the USA)

roboforex-header.jpg


Dear Clients and Partners,

We’re informing you that due to the public holiday in the USA, President’s Day on February 17th, 2020, several instruments will be traded according to the changed schedule*.

RoboForex

Trading schedule on Metals (XAUUSD and XAGUSD), CFDs on US indices (US500Cash, USTECHCash, US30Cash) and oil (WTI, Brent)
  • February 17th, 2020 – trading stops at 7:40 PM server time.
  • February 18th, 2020 – trading starts as usual.
Trading schedule on CFDs on US stocks
  • February 17th, 2020 – no trading.
  • February 18th, 2020 – trading starts as usual.

R Trader

Trading schedule on US stocks and ETFs
  • February 17th, 2020 – no trading.
  • February 18th, 2020 – trading starts as usual.
Trading schedule on CFDs on US stocks
  • February 17th, 2020 – no trading.
  • February 18th, 2020 – trading starts as usual.
Trading schedule on CFDs on US indices (US500, US30, NAS100)
  • February 17th, 2020 – trading stops at 7:40 PM server time.
  • February 18th, 2020 – trading starts as usual.

Please, take into account these changes in schedule when planning your trading activity.

* – This schedule is for informational purposes only and may be changed by the provider.

Sincerely,
RoboForex team
 
Real Case: How I Earned 1427 USD in 10 Days on Cheap Stocks Using Pump and Dump

Author: Eugene Savitsky

roboforex-header.jpg


Dear Traders,

Today, we will look a bit away from analytics and speak about the market and the situations that the trader may find themselves in, working by the Pump and Dump system. In more detail, you can read about trading by the Pump and Dump system in my previous article.

About Pump and Dump

I would like to note that the market is quite loyal to the traders using this system. Well, in fact, the traders who trade at a decline, restore the balance of the stock price. It is just important to choose the stocks for trading responsibly, analyzing the financial situation of the company and its perspectives of growth.

Of course, some young developing companies may not be profitable from the start. Earlier, Tesla (NASDAQ: TSLA) was also one of such companies. Many stockholders wanted to sell Tesla stocks because 7 years after the IPO the company kept suffering losses and no one believed it could reach its current level. However, in this circumstances we must realize that the money the company received was spent on increasing production and its own development, while the demand for electrocars kept exceeding production. That is why it is very risky to take a short position with such stocks at the start.

Plus Therapeutics: 1427 USD in 10 days

I am going to tell you about my experience in trading by the Pump and Dump strategy, when I ignored the rules and admitted an early entry to the position.

In the summer 2019, the Screener on the Finviz website showed me the stock of Plus Therapeutics Inc. (NASDAQ: PSTV). This company invents medicines for cancer treatment and other diseases. On August 15th, a report for the 2nd quarter of 2019 was published; the company’s management voiced its readiness to present the protocol of the second stage of clinical trials of the DocePLUS medicine in the second half of 2019. The management was looking for partners for the promotion of the new medicine.

On the one hand, the company remained losing, though the losses decreased, and the new medicine could bring them a profit. That is why I did not risk opening short positions; instead, I decided to watch the situation and the reaction of other traders to the news. Also, I paid attention to the behavior of the stock earlier. Note that almost all situations of steep price growth ended up in even steeper declines.

pstv-m5-1-1200x623.png


The situation in question was no exception. Two days later, the stock was trading 50% lower than their extremes. I thought I had missed a good opportunity but 5 days later the stock of this company reappeared on the Screener, and I realized I was to use the situation.

Read more at R Blog - RoboForex

Sincerely,
RoboForex team
 
RoboForex adds new assets and analytical tools to R Trader

head-news.jpg


Dear Clients and Partners,

We’ve added more than 500 new assets and updated analytical tools of our multi-asset trading terminal R Trader.

More about new features in R Trader:

  • More than 500 CFDs on stocks of European companies
    More than 500 new CFDs on stocks of companies from 11 European countries, such as Volkswagen, Peugeot, L'Oreal, Orkla, and Nokia are now available in R Trader.

  • Tick charts
    Analyze “market pulse” by means of new tick charts that show the slightest fluctuations of the chosen asset price.

  • Updated Watchlists
    A new feature in Watchlists: tracking updates in “Тоp Gainers”, “Top Losers”, “Top Volumes” with 5-, 30-, and 120-minute intervals.

More detailed information about all instruments and features can be found on the platform’s page. We’re actively continuing to upgrade and improve our R Trader trading terminal, so follow the news!


Sincerely,
RoboForex team
 
RoboForex offers its clients access to bank transfers via SEPA and SWIFT

bank-transfer-head.jpg


Dear Clients and Partners,

RoboForex has expanded your opportunities of operations with trading accounts. From now on, you can deposit and withdraw funds by means of bank transfers via SEPA and SWIFT systems.

Benefits of international bank transfers

SEPA
is a system, which operates in the European Economic Community and allows to quickly transfer funds between different accounts in EUR without any additional fees.

SWIFT
helps you to easily command your finance and make transfers between accounts in different banks all over the world in currencies that are convenient for you.

Join the global financial community and explore new opportunities together with RoboForex!


Sincerely,
RoboForex team
 
Catch Your Smash Day with Larry Williams

Author: Victor Gryazin

roboforex-header.jpg


Dear Traders,

In this article, we will discuss the trading methods of a famous exchange trader Larry Williams. His expertise is confirmed by his victory in a prestigious world futures championship Robbins World Cup with a phenomenal result — over 11000% profit in a year.

How to trade a Smash Day?

The Smash Day trading pattern by Larry Williams suggests that the current impulse of the price movement has a higher possibility of a reversal after on the chart, there appears a highly volatile day closing above/below the last extremes. Such a trading day is called "smash" (or reversal) because it precedes a change in the current price direction.

When a Smash Day forms, the market leaps up- or downwards, closing behind the previous highs/lows. At this moment, all the traders that were late for market entry try to catch the last train, counting on the continuation of the movement. However, their hopes will not come true if the next day the price goes in the opposite direction and forms a Smash Day reversal pattern.

A Smash Day to buy

This is a day of increased volatility in a descending price movement that closes below the low of the previous session. Such a day can cover up the lows of the previous 3 to 8 days. If the next day the price starts moving in the opposite direction and renews the high of the Smash Day in the end — you can open a position to buy with an SL below the low of the Smash Day.

This is a reversal pattern but you may not necessarily trade a Smash Day counter a strong trend. To my mind, it is perfect when this pattern finishes a correction to an uptrend. For example, if the daily trend is ascending, there is a descending correction on H1 or H4, finished by a Smash Day to buy. When the correction is over, we open a position to but in the direction of the main (daily) uptrend.

williams-smashday-buy-1051x630.png


A Smash Day to sell

Same with the previous one, this reversal pattern forms when there emerges a day of increased volatility on the market — in an ascending price movement this time. The day is closed at the top of the trading range above the previous high. The next day, the price starts going down actively. After the minimum of the Smash Day is renewed, we open a position to sell, with an SL behind the high.

Read more at R Blog - RoboForex

Sincerely,
RoboForex team
 
How to Trade Support and Resistance Levels

Author: Andrey Goilov

roboforex-header.jpg


Dear Traders,

Horizontal support and resistance levels are at the base of classical tech analysis. Many traders despise such a simple instrument and avoid spending their time on studying the basics of graphic analysis. However, the influence of the horizontal levels on the price movements is hard to deny.

Any trend is a sequence of support and resistance levels, so we can see tests and breakouts of such important areas every day. I recommend paying attention to this aspect of analysis and studying this instrument to be able to detect these levels.

1-nzdusd-bearish-trend.png


Putting it very simply, near the support level you should buy while at the test of the resistance area, you should sell.

What is the support level?

In theory, a support level is an area below the current market price where the players can buy; this area is highly probable to remain under the pressure of sellers. T the moment of testing the support level, the prices push off it and start growing; hence, the pressure from sellers shrinks as they cannot secure under the level to continue the decline. We can say that buyers are stronger.

2-gbpusd-support.png


As a rule, such levels can be detected on the chart beforehand. We can use both the daily and hourly charts. However, experienced traders say that longer timeframes are more important. For example, a support level on D1 will be much stronger than the support level on M5.

On D1, the prices can be testing the support level for weeks before the bears manage to push the price down. As for M5, one test may be enough to secure below this level and move to the next one.

Read more at R Blog - RoboForex

Sincerely,
RoboForex team
 
How to Trade Trendlines?

Author: Andrey Goilov

roboforex-header.jpg


Dear Traders,

Trendlines pertain to classic tech analysis. Many traders add such lines to their strategy, using them not only on the price charts but also on the indicator graphs. We can say that a trendline is one of the simplest instruments used for chart analysis. At the same time, regardless of its simplicity, this instrument is highly efficient.

Trendlines can show where to enter in the direction of the trend and where the current trend might end. The analysis of the price chart itself is a good advantage: there is an opinion that signals from the indicator are lagging, and it is the price that is of special importance. However, we must keep it in mind that all trading options must be customized, and various ways of using both graphic analysis instruments and indicator signals should be tried.

Ascending trendline

An ascending trendline is a line drawn through the lows from left to right. The second low must be higher than the first one. To draw the line, two points suffice.

Many authors single out the third point as the confirmation that the trendline has been drawn right. However, at the moment when the price touches the line, many traders try buying already, not waiting for the confirmation. As a rule, buying at a bounce off the trendline always happens with a small Stop Loss, so the risk is not that high. That is why most traders somewhat neglect the confirmation.

1-ltcusd-bullish-trendline.png


As an example, let us look at the trendline on the chart of the Litecoin. To draw it, we take two marginal lows and draw a line through them. It is important to extend the line to the right so that we could see the moment of testing this line by the price. In our example, at the moment of testing the trendline, the price bounces and goes on growing. We can say that the uptrend continues until the trendline is broken.

Descending trendline

A descending trendline is drawn through highs. To draw it, we need two points on the chart, the second one being lower than the first one.

Here, we should also remember that it is wise to wait for the third line to form and confirm that the descending trendline has been drawn right. Anyway, we should remember that drawing trendlines is an art and thus subjective. That is why different traders can draw different lines that are important to them. The more experienced the trader is, the better they draw the lines.

Read more at R Blog - RoboForex

Sincerely,
RoboForex team
 
RoboForex increases the maximum order volume on the Company’s trading accounts

roboforex-header.jpg


Dear Clients and Partners,

RoboForex has increased the maximum available order volume values. Changes are effective as of February 28th, 2020 and will be applied to MT4/MT5-based accounts.

The maximum order volume has been increased for all instruments:

  • Standard accounts (Pro-Standard, ECN-Pro NDD, Prime) - 500 lots.

  • Cent accounts (Pro-Cent) - 10,000 lots.


Sincerely,
RoboForex team
 
Trading with ZigZag: Settings and Use

Author: Victor Gryazin

roboforex-header.jpg


Dear Traders,

In this review, we will discuss a popular indicator called ZigZag. This indicator makes it easier to interpret charts, showing important price changes, and helps to carry out tech analysis.

What is ZigZag and is it helpful?

ZigZag is quite a popular indicator featured by many trading platforms, including MT4 and MT5. The indicator is a broken line linking lows and highs on the price chart. As long as ZigZag is drawn through the most important highs and lows, it is very easy to use for price chart analysis.

ZigZag links highs and lows on the chart in accordance with the settings. It must be kept in mind that the last line of the indicator remains incomplete until the last high or low is formed.

ZigZag helps analyze the price movement on the chart. Traders who use Elliott waves in their strategy, often use ZigZag as well to identify waves. It helps to filter minor "noise" on the chart and to define current wave structure (motive or corrective).

Also, ZigZag will help define the actual trend and draw trendlines. With it, it is easier to find technical support and resistance levels, price and tech analysis patterns. As a rule, ZigZag supplements tech analysis or helps find trading signals along with other indicators.

zigzag-1048x630.png


Characteristics and settings

On popular trading platforms MetaTrader 4 and MetaTrader 5, ZigZag is applied on the chart of an instrument via the Main menu: Insert - Indicators - User - ZigZag.

A standard ZigZag has three main settings.

Read more at R Blog - RoboForex

Sincerely,
RoboForex team
 
Back
Top