Vlad RF
RoboForex Representative
- Messages
- 487
The MFI: Peculiarities and Trading Strategies
Author: Maks Artemov

Dear Clients and Partners,
Today, we will get acquainted with the MFI (Market Facilitation Index). It was developed by an experienced trader Bill Williams and described in his book “The Trading Chaos”.
The author aimed at research and quality analysis of the ratio between trade volumes and the price of the asset. He assumed that the trade volume or turnover initiated growth. The larger the volume of the asset, the brighter the price growth.
Placement and appearance
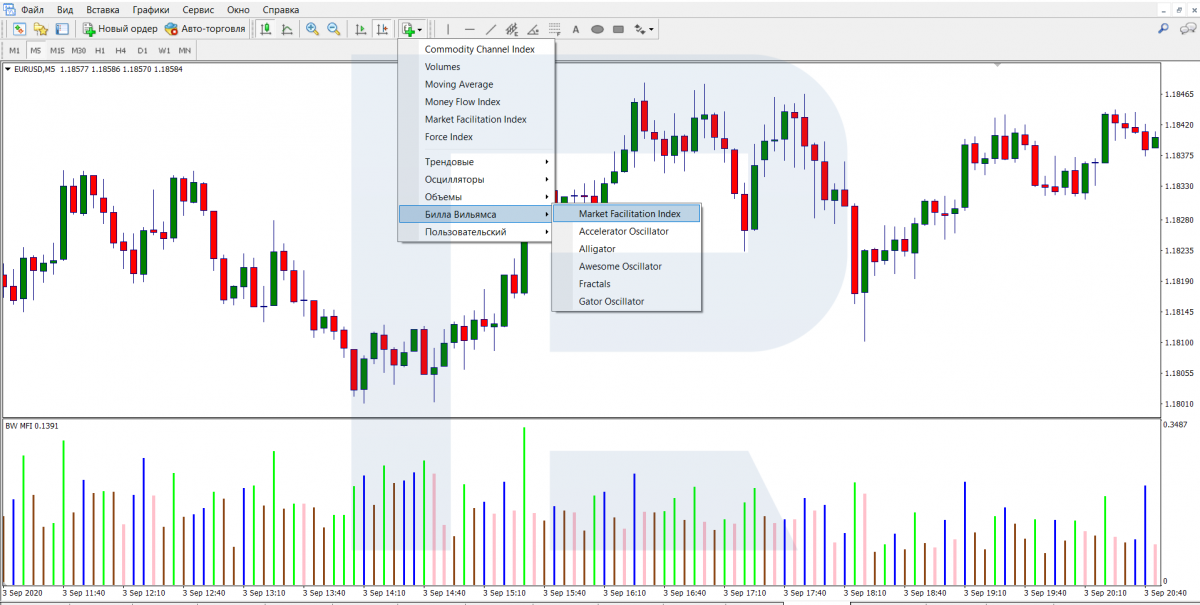
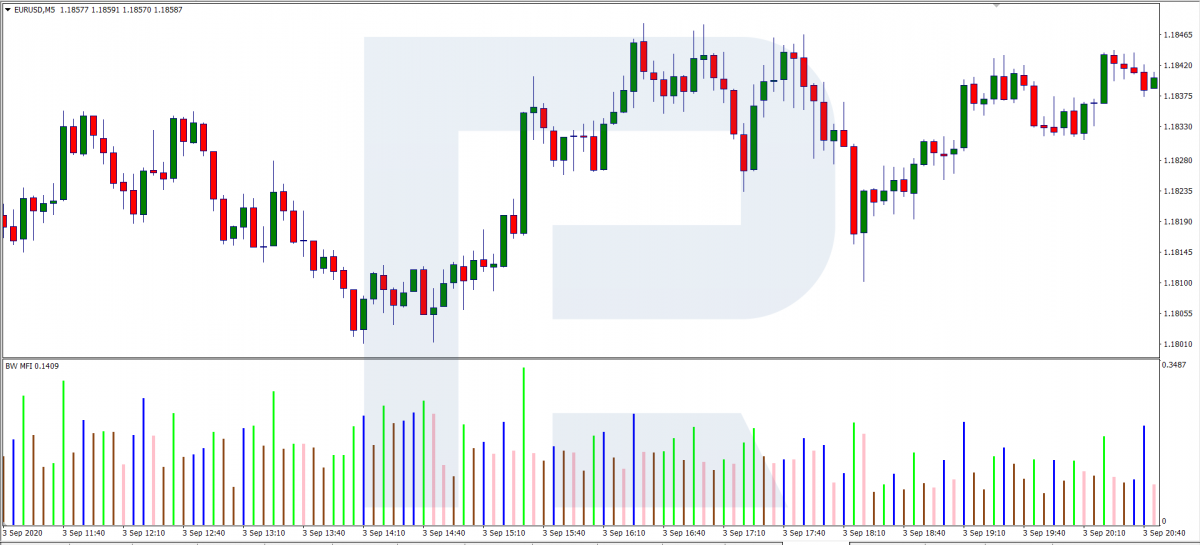
In MT4, you can find the MFI in Indicators – Bill Williams. The indicator is displayed in a separate window under the price chart and looks like a histogram made of bars of four different colors. The color and width of the bars are customizable. By default, the colors are as follows:
What does the MFI show?
The indicator provides the following information:
Read more at R Blog - RoboForex
Sincerely,
RoboForex team
Author: Maks Artemov
Dear Clients and Partners,
Today, we will get acquainted with the MFI (Market Facilitation Index). It was developed by an experienced trader Bill Williams and described in his book “The Trading Chaos”.
The author aimed at research and quality analysis of the ratio between trade volumes and the price of the asset. He assumed that the trade volume or turnover initiated growth. The larger the volume of the asset, the brighter the price growth.
Placement and appearance
In MT4, you can find the MFI in Indicators – Bill Williams. The indicator is displayed in a separate window under the price chart and looks like a histogram made of bars of four different colors. The color and width of the bars are customizable. By default, the colors are as follows:
- MFI upwards, volume up – Lime
- MFI downwards, volume down – SaddleBrown
- MFI upwards, volume down – Blue
- MFI downwards, volume up
What does the MFI show?
The indicator provides the following information:
- The green bar means that the number of market operations increases and the trend is getting stronger. The current impulse may continue because new players come to the market and make a lot of operations. This signal is not meant for opening positions because the impulse emerged much earlier, and the price has already covered a long distance. But if the trader already has an open position, the growth of the green bar will mean they were right.
- The brown bar means that volatility and liquidity are falling because market players are losing interest. Usually, such a bar precedes a flat, and the probability of a reversal is almost null. After the flat, the price may proceed in either direction with equal probability.
- The blue bar indicates that the impulse is currently developing not because some new players have entered the market but because either buyers or sellers are leaving it. They have lost interest in the asset, and the situation is dubious.
- The Pink bar shows that both bulls and bears are active. This bar promises a reversal and is most preferable for traders.
Read more at R Blog - RoboForex
Sincerely,
RoboForex team