****** Technical Outlook on Major GBP/USD ******

acetraderfx

AceTrader.com Representative
Messages
1,109
flag_gbp.gif DAILY TECHNICAL OUTLOOK ON GBP/USD

Last Update At 17 Apr 2013 01:30GMT
[/B]
Trend Daily Chart
Sideways

Daily Indicators
Rising

21 HR EMA
1.5338

55 HR EMA
1.5330

Trend Hourly Chart
Sideways

Hourly Indicators
Rising

13 HR RSI
60

14 HR DMI
+ve

Daily Analysis
Consolidation with mild upside bias

Resistance
1.5459 - 50% proj. of 1.5034-1.5412 fm 1.5270
1.5412 - Last Thur's 6-week high
1.5386 - Mon's high

Support
1.5329 - Hourly chart
1.5270 - Y'day's low
1.5239 - Last Mon's low

. GBP/USD - 1.5355... The British pound traded in a choppy fashion y'day n despite initial weakness, price managed to hold abv Mon's NY low at 1.5270 in Asia n Europe n intra-day rally in eur/usd later helped cable move higher abv 1.5329 res (now sup) to 1.5379 in NY afternoon b4 easing in Asia today.

. Y'day's aforesaid rally to 1.5379 suggests fall fm last Thur's 6-week high at 1.5412 to retrace recent upmove fm Mar's 2-1/2 year trough at 1.4832 has ended at 1.5270 n as long as 1.5329 holds, consolidation with upside bias remains, abv 1.5386 wud confirm this view n yield re-test of 1.5412, break wud bring stronger correction of MT downtrend fm 1.6747 (2011 peak) to 1.5458/59, being 61.8% r of 1.5845-1.4832 n 50% proj. of 1.5034-1.5412 fm 1.5270 respectively, however, as hourly oscillators' readings wud be in o/bot territory on such a move, reckon 1.5505 (Feb 19 high) shud remain intact n bring retreat later.

. In view of abv bullish view, we've exited our previous short position n wud stand aside. On the downside, below 1.5329 wud revive bearishness n yield weakness to 1.5270 but break needed to extend subsequent fall twd 1.5239.
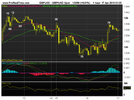
Chart-GBPUSD.jpg
 
May 1, 2013 : DAILY TECHNICAL OUTLOOK ON GBP/USD

DAILY TECHNICAL OUTLOOK ON GBP/USD

Last Update At 01 May 2013 01:14GMT

Trend Daily Chart
Sideways

Daily Indicators
Rising

21 HR EMA
1.5524

55 HR EMA
1.5500

Trend Hourly Chart
Up

Hourly Indicators
Bearish divergences

13 HR RSI
60

14 HR DMI
+ve

Daily Analysis
One more rise b4 retreat

Resistance
1.5690 - Feb 13 top
1.5606 - 50% r of 1.6380-1.4832
1.5570 - Y'day's high

Support
1.5518 - Y'day's European high
1.5467 - Y'day's low
1.5418 - Last Fri's low

. GBP/USD - 1.5537... Although the British pound retreated fm Mon's high at 1.5547 to 1.5467 in European morning y'day, cross buying of stg vs euro lifted the pair to 1.5518 b4 falling to 1.5474. However, dollar's broad-based weakness pushed price abv 1.5547 to a fresh 10-week high at 1.5570 in NY morning.

. Cable's breach of 1.5547 res to 1.5570 signals upmove fm Mar's 2-1/2 year low at 1.4832 to correct MT decline fm 1.6747 (2011 peak) has once again resumed n further gain twd 1.5606, being a 'natural' 50% of 1.6380-1.4832, wud be seen after consolidation, however, as said 1.5570 high was accompanied by prominent 'bearish divergences' on hourly indicators, suggesting strg rise abv 1.5606 is unlikely n price shud hold below 1.5630 (Feb 5 low) n bring much-needed correction. On the downside, below 1.5518 wud yield weakness to 1.5467 but break is needed to confirm a temporary top is made n bring stronger retrace. twd 1.5418.

. Today, in view of abv analysis, we're trading cable on both sides of the market n wud buy on dips for gain to indicated objective or sell if price climbs twd 1.5606 1st for subsequent retreat twd 1.5518, break confirms top, 1.5467.

GBP%20spot%28385%29.png
 
Back
Top