FOREX PRO Weekly September 10-14, 2012

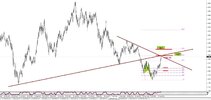
Sive, what is your perspective on it going through 3150 area? Seems like a close above 200 sma and 25x5 warrants pause in trading the confluence area. I am going to trade a small amount with my stop behind 2934 (61.8 fib). Let us know your thoughts though.

Hi Joshnix,
Personally I do not want to enter long. It is obvious that anything could happen, but probabilities suggests retracement and I do not want to struggle with it.
My trading plan - wait clear reversal pattern on daily around 1.2950-1.3130.
Currently to enter short is also not the case, since we do not have reasons for that. I think that when market struggles with daily overbought and creeping to monthly K-resistance better choice is to wait a bit.
 
Is there somewhere that people share their live opinions in an online chat, not just posting on this great informative thread..Thanks Sive and all posters.

Similar to how Craig had open a few weeks ago?

I know my post count is low as I am lurker, reader & learner...not a poster....yet..;-)
 
well, if that crab was a crab, then we can say from this price action, that the prz has been tested, had astrong reaction and now been violated,
would this be a strong indication of bullish continuaton.
 
thanks Sive for your daily analysis , can you please share the pivot point indicators that you use on your MT4 chart ?
 
Daily buy butterfly 127% target reached
now above this confluence resistance area by trend lines overbought etc etc
again its appearing a 4hr hammer @d resistance...
4hr price action.jpg
 

Attachments

  • daily buy bfly target hitted.jpg
    daily buy bfly target hitted.jpg
    99.7 KB · Views: 29
Again
1-127% of buy butterfly
2-61% fib of previous swing
3-161% of ab cd
4-2 major long term trend lines
Watt a supppeerrr noisy chartt.jpg
take look @ my super noisy chart
i am selling with d stop above the hammer
if it still fly den i will kill both euro n dollr
 
Lolly, I suggest you strangle them. Shooting may be rather noisy and may be seen as an act of terrorism! Well done and thanks for sharing.

Again
1-127% of buy butterfly
2-61% fib of previous swing
3-161% of ab cd
4-2 major long term trend lines
View attachment 6575
take look @ my super noisy chart
i am selling with d stop above the hammer
if it still fly den i will kill both euro n dollr
 
Hi Lolly, thanks for posting chart. Is this a butterfly,or just an alternate ab=cd that you see.

chart below shows what probably wont happen next
lolly2.PNG
 
Hi Ochills,
1. Lower time frame patterns are likely will be opposite to trend, since they are the first sign of retracement/reversal. Step sequence is as follows:
a) find a solid area of support/resistance with or w/o overbought/oversold, that you intends to use as entry level;
b) Monitor it. If you will get patterns that signal the same direction as you've suggested you may try to enter. Here you can either wait when intraday trend will confirm the pattern or stick to pattern per se. This is a bit different risk, different risk/reward ratio etc.
c) Be sure that daily trend will confirm your entry.
That is if you want to trade trend combining with entry based on patterns.

But you also could trade just patterns. In this case you act as it was described in Forex Military School.

2. IF you mean how to combine say monthly K-area and daily trading, then you can use higher time frame K-areas as directional pattern (DiNapoli tells about it in his book BTW). Hence, you should be ready that some daily reversal pattern should appear somewhere around or inside monthly or weekly K-area.


Thanks Sive for your reply. but my second question what I mean is that when I analyse GBP/USD the k-area between (5) & (3) is about 150 pip on weekly and if the same happen on daily and monthly but about 200pips wide. can I still consider it as K-area becos the pips value is wide
 
Back
Top