forexthining
Recruit
- Messages
- 1
I read a lot about FXCM customers compiling about various issues they have been facing from random margin calls to account closures. I am sure some are related with the customers faults themselves. So i dint take much notice of this but this until i started to experience some of these issues myself. I'll be posting these here on the forum in coming days so that someone from FXCM resolves these issues i have faced and replies in public.
Of recent, after spending considerable time plotting on the graphs, I switched from one currency to another and after some work i went back to the original currency pare to find all my hard work was lost. After talking to their support, which took 20min to reply on live chat, they siad i should uninstall the Trading station and reinstall it again. I followed the instructions. Again charting data lost.
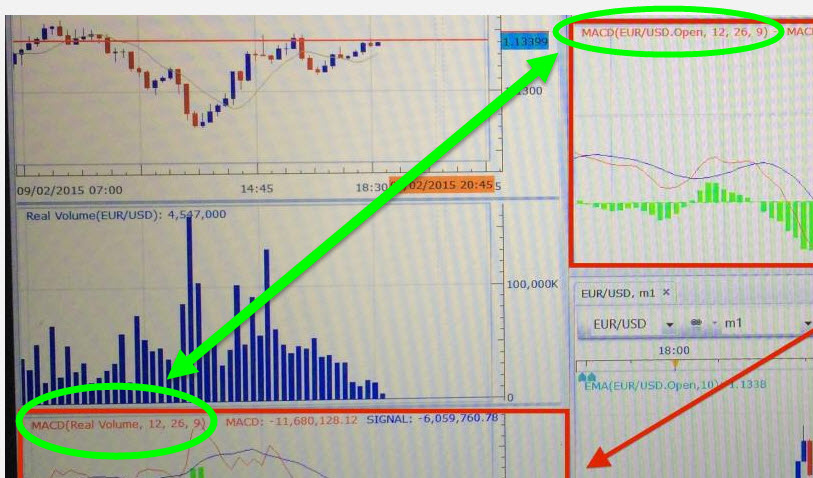
But this could be for various reasons one thing that I do rely on to give confidence on trading decisions are some simple indicators like MACD, RSI. And of late my trades have been places in completely wrong places due to these signals. Today after this chart issue I opened two windows with the same timeframe and currency to see what was going on. I have attached a screen grab here with high lights.
As you can see, both views have same currency pare EUR/USD on 15min time frame. Both have MACD with same settings(12,26,9) but the results are worlds apart.
If you were trading with these indicators in place its very likely that your trade is going to go south.
You have been warned.
.jpg")
Of recent, after spending considerable time plotting on the graphs, I switched from one currency to another and after some work i went back to the original currency pare to find all my hard work was lost. After talking to their support, which took 20min to reply on live chat, they siad i should uninstall the Trading station and reinstall it again. I followed the instructions. Again charting data lost.
But this could be for various reasons one thing that I do rely on to give confidence on trading decisions are some simple indicators like MACD, RSI. And of late my trades have been places in completely wrong places due to these signals. Today after this chart issue I opened two windows with the same timeframe and currency to see what was going on. I have attached a screen grab here with high lights.
As you can see, both views have same currency pare EUR/USD on 15min time frame. Both have MACD with same settings(12,26,9) but the results are worlds apart.
If you were trading with these indicators in place its very likely that your trade is going to go south.
You have been warned.