acetraderfx
AceTrader.com Representative
- Messages
- 1,109
DAILY USD/JPY TECHNICAL OUTLOOK
Last Update At 10 Apr 2014 23:51GMT
Trend Daily Chart
Sideways
Daily Indicators
Falling
21 HR EMA
101.59
55 HR EMA
101.88
Trend Hourly Chart
Down
Hourly Indicators
Falling
13 HR RSI
36
14 HR DMI
-ve
Daily Analysis
Consolidation with downside bias
Resistance
102.74 - Tue's Asian morning low
102.16 - Wed's high
101.97 - Y'day's NY morning high
Support
101.33 - Y'day's low
101.21 - Mar 14 low
100.76 - Feb 04 low
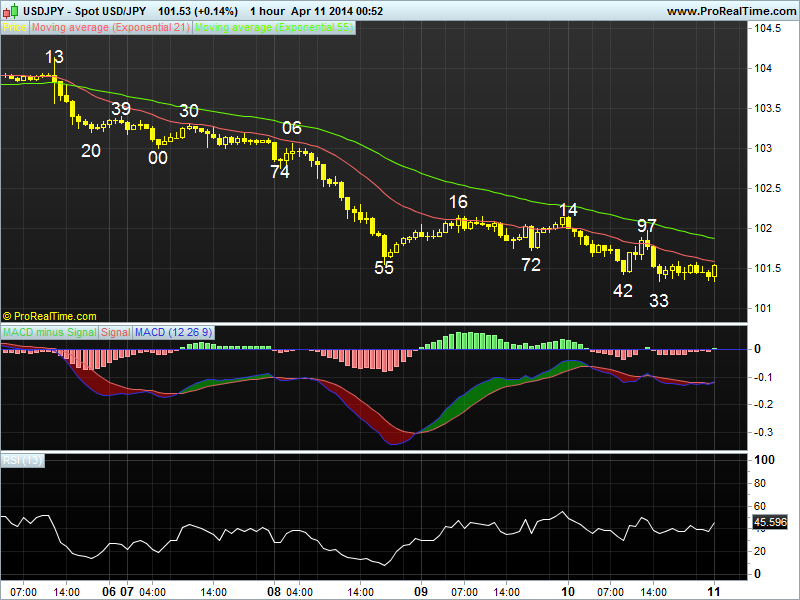
. USD/JPY - 101.38... Wed's dovish FOMC minutes had kept dlr under pressure on Thur n price retreated fm 102.14 at Asian open to 101.42 in European morning. Later, dlr recovered to 101.97 after solid U.S. jobless claims but only to fall to a fresh 3-wk low at 101.33 on risk aversion due to selloff in U.S. equities.
. As mentioned in previous update, dlr's decline fm last Fri's high at 104.13 (post-NFP peak) to as low as 101.55 on Tue n then 101.33 y'day signals 'choppy' trading below 2013 Dec's 5-year peak at 105.45 wud continue n as daily oscillators are falling, suggesting price is en route twd key sup at 100.76 (reaction low in Feb) where a break there wud indicate LT uptrend fm 2011 record bottom at 75.32 is still being retraced n further weakness to 99.60 wud be seen later this month, being a 'natural' 50% r of the intermediate MT rise fm 93.75-105.45. On the upside, only a daily close abv 103.00 wud suggest price remains confined inside recent 100.76-104.13 broad range n yields gain to 103.45/55.
. Today, as price is still trading below the 21-hr n 55-hr emas, selling dlr on recovery for further weakness to 101.00 is favoured n only a daily close abv 102.16 (Wed's high) wud indicate a temporary low is made, risk 102.50/60.
Last Update At 10 Apr 2014 23:51GMT
Trend Daily Chart
Sideways
Daily Indicators
Falling
21 HR EMA
101.59
55 HR EMA
101.88
Trend Hourly Chart
Down
Hourly Indicators
Falling
13 HR RSI
36
14 HR DMI
-ve
Daily Analysis
Consolidation with downside bias
Resistance
102.74 - Tue's Asian morning low
102.16 - Wed's high
101.97 - Y'day's NY morning high
Support
101.33 - Y'day's low
101.21 - Mar 14 low
100.76 - Feb 04 low
. USD/JPY - 101.38... Wed's dovish FOMC minutes had kept dlr under pressure on Thur n price retreated fm 102.14 at Asian open to 101.42 in European morning. Later, dlr recovered to 101.97 after solid U.S. jobless claims but only to fall to a fresh 3-wk low at 101.33 on risk aversion due to selloff in U.S. equities.
. As mentioned in previous update, dlr's decline fm last Fri's high at 104.13 (post-NFP peak) to as low as 101.55 on Tue n then 101.33 y'day signals 'choppy' trading below 2013 Dec's 5-year peak at 105.45 wud continue n as daily oscillators are falling, suggesting price is en route twd key sup at 100.76 (reaction low in Feb) where a break there wud indicate LT uptrend fm 2011 record bottom at 75.32 is still being retraced n further weakness to 99.60 wud be seen later this month, being a 'natural' 50% r of the intermediate MT rise fm 93.75-105.45. On the upside, only a daily close abv 103.00 wud suggest price remains confined inside recent 100.76-104.13 broad range n yields gain to 103.45/55.
. Today, as price is still trading below the 21-hr n 55-hr emas, selling dlr on recovery for further weakness to 101.00 is favoured n only a daily close abv 102.16 (Wed's high) wud indicate a temporary low is made, risk 102.50/60.
Last edited by a moderator: