AceTraderFx March 24: Weekly Technical Outlook on Major – USD/JPY

acetraderfx

AceTrader.com Representative
Messages
1,109
WEEKLY USD/JPY TECHNICAL OUTLOOK
Last Update At 24 Mar 2014 00:15GMT

Trend Daily Chart
Sideways

Daily Indicators
Turning up

21 HR EMA
102.26

55 HR EMA
102.20

Trend Hourly Chart
Sideways

Hourly Indicators
Turning down

13 HR RSI
45

14 HR DMI
-ve

Daily Analysis
Consolidation b4 one more rise

Resistance
103.77 - Mar's high (07)
103.10 - Mar 12 high
102.69 - Last Wed's high

Support
101.94 - Last Tue's high
101.69 - Last Wed's European morning high
101.21 - Mar 14 low


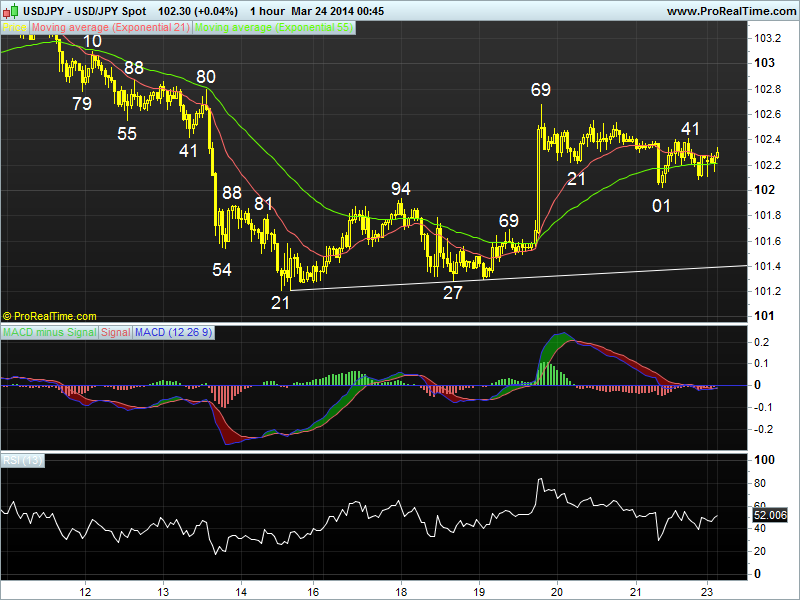
. USD/JPY - 102.20... Dlr remained under pressure initially last week n retreated fm 101.94 to 101.27 on Tue due to safe-haven buying of yen following the annexation of Crimea by Russia, however, price rallied to 102.69 Wed after Fed's tapering move n hawkish remarks fm Fed chief Yellen b4 dropping back to 102.01.

. Looking at the bigger picture, dlr's nr term rise fm 101.21 (Mar 14 low)
to 102.69 signals the fall fm Mar's peak at 103.77 has ended there earlier n as daily technical indicators are turning up, suggesting further 'volatile' trading abv Feb's bottom at 100.76 wud be seen n with upside bias. Looking ahead, a daily close abv 103.10 (Mar 12 high) wud encourage for a re-test of 103.77 later this month, however, only a firm breach there wud indicate decline fm 105.45 (2013 5-year peak made in Dec) is still being retraced n bring another leg of correction fm 100.76 twd 104.22, bring the equality projection of 100.76-103.77 measured fm 102.21, n then twd 104.50/60.

. Today, as long as 102.01 (reaction low fm 102.69) holds, buying dlr on
dips in anticipation of a re-test of 102.69 is favoured, abv, 103.00/10. Only
below 101.94 (prev. res) wud abort this bullish scenario, risk 101.77, 101.49.

jpy%20t%2810%29.png
 
Last edited by a moderator:
AceTraderFx March 27: Dailly Technical Outlook on Major –USD/JPY

DAILY USD/JPY TECHNICAL OUTLOOK
Last Update At 27 Mar 2014 00:39GMT

Trend Daily Chart
Sideways

Daily Indicators
Turning down

21 HR EMA
102.14

55 HR EMA
102.22

Trend Hourly Chart
Sideways

Hourly Indicators

O/sold

13 HR RSI
25

14 HR DMI
-ve

Daily Analysis
Consolidation with downside bias

Resistance
103.10 - Mar 12 high
102.69 - Last Wed's high
102.49 - Tue's high

Support
101.69 - Last Wed's European morning high
101.21 - Mar 14 low
100.76 - Feb 4 low


. USD/JPY - 101.83... Although dlr edged higher fm Asian low at 102.26 on
Wed n briefly rose to 102.48 in NY morning after robust U.S. durable goods data,
active cross buying in yen on risk aversion due to fall in U.S. equity markets
knocked price lower to 101.87 in late NY n then to 101.80 at Asian open today.

. Looking at the hourly n daily charts, y'day's retreat fm after meeting
renewed selling at 102.48 n then breach of 102.01 (last Fri's low) strongly
suggests the rise fm 101.21 (Mar 14 low) has ended at 102.69 (last Wed's peak
after hawkish comments fm Fed's chief Yellen) n as hourly oscillators are
currently falling, suggesting choppy trading with downside bias remains for
weakness to 101.49, being the 80.9% r of 101.21-102.69, firm break there wud
confirm this view n yield resumption of early fall fm Mar's peak at 103.77 to
re-test said sup n then twd Feb's bottom at 100.76 next week.

. In view of abv analysis, selling dlr on recovery is favored n only a daily
close abv 102.65/69 wud 'prolong' choppy trading inside recent broad range
of 100.76-103.77 n bring further gain twd 103.10 (Mar 10 high) but price shud
falter well below said res n yield retreat.
jpy%20t%2813%29.png
 
Last edited by a moderator:
AceTraderFx April 1: Dailly Technical Outlook on Major –USD/JPY

DAILY USD/JPY TECHNICAL OUTLOOK
Last Update At 01 Apr 2014 01:54GMT

Trend Daily Chart
Sideways

Daily Indicators
Rising

21 HR EMA
103.11

55 HR EMA
102.84

Trend Hourly Chart
Sideways

Hourly Indicators
Turning down

13 HR RSI
63

14 HR DMI
+ve

Daily Analysis
Consolidation b4 upmove resumes

Resistance
104.22 - Equality proj. of 100.76-103.77 fm 101.21
103.77 - Mar's high (07)
103.44 - Y'day's high

Support
102.90 - Y'day's NY low
102.69 - Mar 19 high, now sup
102.43 - Mar 27 high, now sup

. USD/JPY - 103.25... Although dlr penetrated abv last Fri's high of 102.98 shortly after European open y'day n rose to 103.44 in NY morning, dovish remarks fm Fed Chair Yellen triggered broad-based selling in greenback n knocked price down to 102.90 b4 staging a rebound to 103.27 in Australia this morning.

. Looking at the hourly chart, y'day's breach of 102.98 to 103.44 suggests a re-test of upper lvl of recent broad range of 100.76-103.77 wud be forthcoming soon but a daily close abv said res is needed to indicate an 'upside break' has occurred n bring further gain to 104.22, being the equality projection of 100.76-103.77 measured fm 101.21, however, as 'bearish diverging signals' have appear on hourly oscillators, sharp gain fm there is not likely n price shud falter below 104.55, this is 80.9% r of fall fm 105.45 to 100.76, n yield retreat later this week. Looking ahead, only abv 104.55 wud suggest correction fm 105.45 (2013 5-year peak in Dec) is over n bring further headway twd 105.45.

. Today, as long as sup at 102.69 (prev. res, now sup) holds, trading dlr
fm long side in anticipation for a re-test of 103.77 is favoured n only a daily
close below 102.69 indicates temporary top is made, risks weakness twd 101.99.
jpy%20t%2815%29%281%29.png
 
Last edited by a moderator:
AceTraderFx May 19: Weekly Technical Outlook on USD/JPY

WEEKLY USD/JPY TECHNICAL OUTLOOK
Last Update At 18 May 2014 23:15GMT

Trend Daily Chart
Sideways

Daily Indicators
Falling

21 HR EMA
101.53

55 HR EMA
101.64

Trend Hourly Chart
Down

Hourly Indicators
Turning up

13 HR RSI
51

14 HR DMI
+VE

Daily Analysis
Consolidation b4 one more fall

Resistance
102.36 - Mon's high
102.12 - Last Thur's high
101.68 - Last Fri's high

Support

101.31 - Last Thur's low
101.20 - Mar 03 low
100.76 - Feb 04 low


. USD/JPY - 101.55.. Despite dlr's initial gain to 102.36 last Tue, weakness in the Nikkei n falling U.S. treasury yields triggered broad-based buying of yen, the pair fell to a near 2-month trough of 101.31 b4 staging a recovery.

. On the daily picture, dlr's brief drop to 101.31 suggests the broad side-ways move inside recent established broad range of 101.32-103.02 has possibly ended with a downside break, a firm breach of 101.31/32 sup wud add credence to this bearish view, then decline fm 104.13 (Apr's high) wud pressure dlr twd 2014 bottom at 100.76 in Feb., below there anytime wud confirm MT decline fm Jan's 5-year peak at 105.45 has finally resumed n yield weakness twd 99.60 in Jun, this is a 'natural' 50% r of the LT intermediate uptrend fm 93.75-105.45. So selling dlr on recovery is the way to go (our weekly strategy is currently holding a short position). Only abv 102.36 prolongs consolidation, risks gain twd 103.02.

. Today, although Fri's rebound fm 101.36 to 101.36 suggests choppy trading abv said last Thu's 101.31 low wud continue, as long as 101.84 (50% r fm 102.36) holds, one more fall to 101.00/10 is likely. Only abv 102.12 aborts, 102.36.
JPYMAY%2019.png
 
Last edited by a moderator:
Back
Top