acetraderfx
AceTrader.com Representative
- Messages
- 1,109
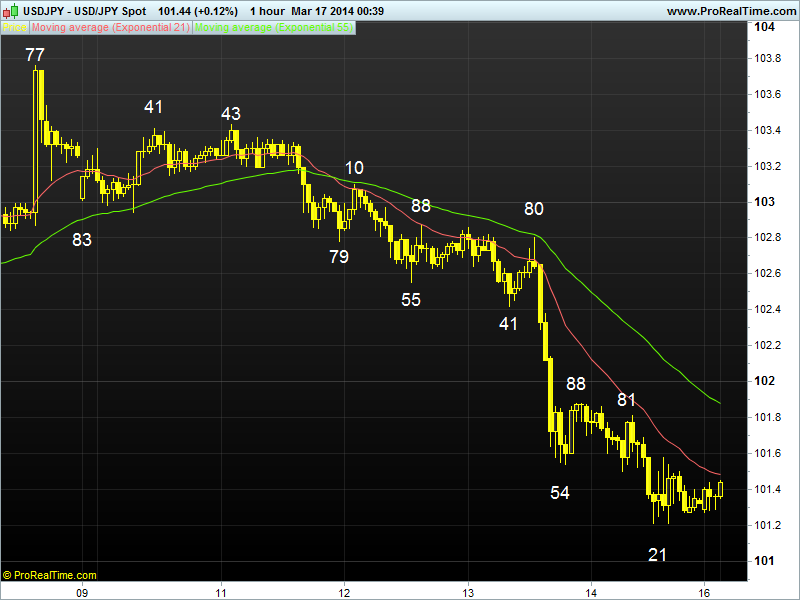
DAILY USD/JPY TECHNICAL OUTLOOK
Last Update At 18 Mar 2014 00:02GMT
Trend Daily Chart
Sideways
Daily Indicators
Falling
21 HR EMA
101.69
55 HR EMA
101.77
Trend Hourly Chart
Sideways
Hourly Indicators
Rising
13 HR RSI
63
14 HR DMI
+ve
Daily Analysis
Choppy sideways trading to continue
Resistance
102.80 - Last Thur's NY high
102.55 - Last Wed's low
102.19 - 38.2% r of 103.77-101.21
Support
101.20 - Mar 03 low
100.76 - Feb 04 low
100.00 - 'Psychological' sup
. USD/JPY - 101.85...Although dlr opened near Fri's NY low at 101.21 at 101.24 in NZ y'day, FX market showed relatively muted reaction to Sun's referendum in Crimea n short-covering in yen crosses lifted price to 101.88 in early Europe b4 easing. Later, dlr rebounded after finding sup at 101.56 in NY morning.
. Y'day's rebound fm 101.24 to 101.88 indicates early fall fm 103.77 (Mar 7 high) has made a temporary low at 101.21 n choppy trading with mild upside bias is seen today for a minor correction to 102.19, this is the 'minimum' 38.2% r of 103.77-101.21, however, as aforesaid selloff fm 103.77 signals corrective up move fm 100.76 has ended there n daily technical indicators are falling again, suggesting bearishness remains for a re-test of 100.76 after consolidation, break there wud be the confirmation LT uptrend fm 2011 record low at 75.32 has indeed formed a top at 105.45 (2013 5-year peak made in Dec), then the greenback shud be en route twd 99.60, this is the 'natural' 50% r of the intermediate rise fm 93.75-105.45, later this month.
. Today, buying dlr on dips or selling on upmove is favoured n only a daily
close abv 102.55 (prev. sup, now res) wud risk stronger gain twd 102.80.
Last edited by a moderator: