AceTraderFx Apr 29: Daily Technical Outlook on USD/JPY

AceTraderFx Sept 25: Daily Technical Outlook & Trading Ideals on USD/JPY

DAILY USD/JPY TECHNICAL OUTLOOK
Last Update At 24 Sep 2014 23:58GMT

Trend Daily Chart
Up

Daily Indicators

Rising

21 HR EMA
108.90

55 HR EMA
108.81

Trend Hourly Chart

Up

Hourly Indicators

Rising

13 HR RSI

74

14 HR DMI

+ve

Daily Analysis
Consolidation b4 uptrend resumes

Resistance

110.67 - 2008 peak (AUG)
109.90 - 61.8% proj. of 106.81-109.46 fm 108.26
109.46 - Last Fri's fresh 6-year high

Support

108.46 - Y'day's low
108.26 - Tue's low
108.14 - 50% r of 106.81-109.46

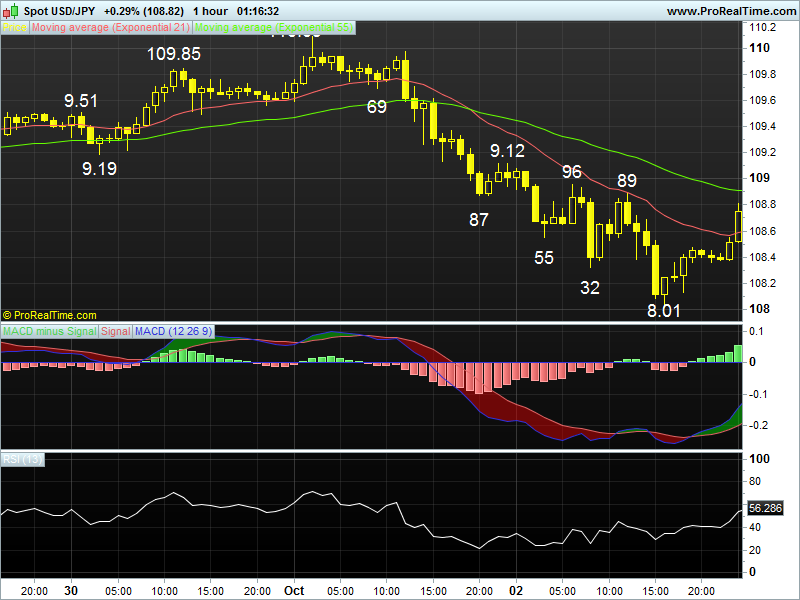
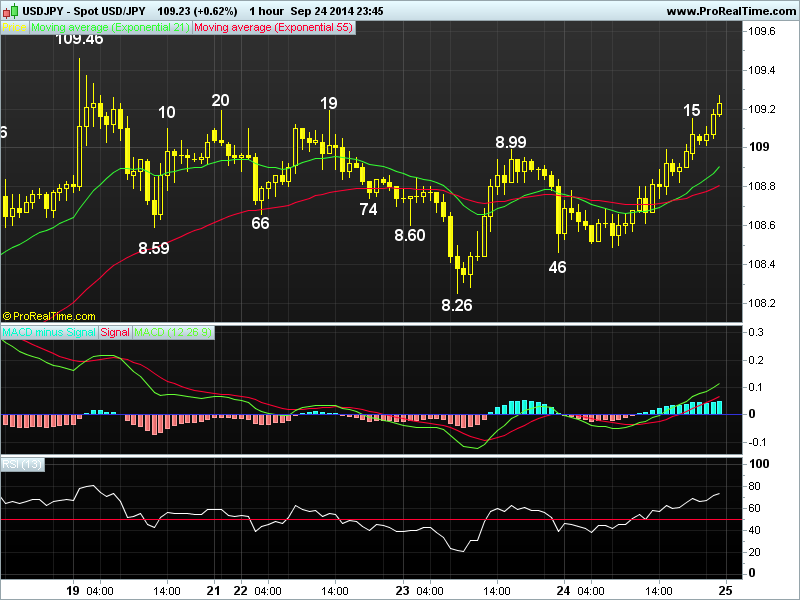
. USD/JPY - 109.27 ... Despite dlr's brief but sharp drop to 108.46 ahead of of Tokyo open on Wed due to Japan PM Abe's comment on weak yen, dlr rebounded to 108.78 in Asia on recovery in The Nikkei. The pair continued its intra-day gain n climbed to 109.15 near NY close due to dlr's broad-based strength.

. Looking at the hourly n daily charts, y'day's rebound n intra-day breach
of res at 109.19/20 suggests the correction fm last Fri's fresh 6-year peak at
109.46 has ended at 108.26 on Tue n upside bias remains for re-test of 109.46, abv wud confirm the LT uptrend fm 2011 record low at 75.32 (Nov) has once again resumed n yield gain to daily obj. at 109.70, however, as hourly oscillators wud display 'bearish divergences' on such move, reckon 109.90/110.00 wud cap upside, this is 61.8% proj. of 106.81-109.46 measured fm 108.26 n 'psychological' lvl respectively. On the downside, only below 108.26 wud defer bullishness on dlr.

. Today, as dlr has maintained a firm undertone after penetrating 109.19/20 res ahead of Tokyo open, buying on dips in anticipation of a resumption of said uptrend is favoured n only below 108.65/70 wud dampen bullish scenario, however, this week's low at 108.26 shud remain intact.

JPY%20sep%2025%281%29.png
 
Last edited by a moderator:
AceTraderFx Oct 3: Daily Technical Outlook & Trading Ideals on USD/JPY

DAILY USD/JPY TECHNICAL OUTLOOK
Last Update At 03 Oct 2014 00:20GMT

Trend Daily Chart
Up

Daily Indicators
Easing fm o/bot

21 HR EMA
108.58

55 HR EMA
108.91

Trend Hourly Chart
Nr term down

Hourly Indicators
Rising fm o/sold

13 HR RSI
52

14 HR DMI
-ve

Daily Analysis
Consolidation with downside bias

Resistance
109.69 - Prev. sup, now res
109.12 - Y'day's high in Aust.
108.89 - Y'day's NY morning res

Support
108.01 - Y'day's low
107.60 - 1.23 times extn of 110.09-108.87 fm 109.12
107.40 - Sep 12 high, now sup

. USD/JPY - 108.68 ... Dlr found renewed selling at 109.12 in Aust. on Thur n easily penetrated Wed's NY low at 108.87 in Asia due to tumble in N225, price ratcheted lower in Europe n fell to 108.01 in NY midday b4 short-covering lifted price in NY afternoon. Dlr rebounded to 108.73 shortly after Fri's Tokyo open.

. Y'day's breach of 108.26 (Sep 23 low) to 108.01 signals LT uptrend fm 2011 record low at 75.32 (Nov) has indeed made a temporary top at Wed's fresh 6-year peak at 110.09 n although subsequent intra-day rebound indicates initial choppy trading wud be seen in Asia, reckon 109.05, the 'natural' 50% r of 110.09-108.01 , wud cap upside n bearishness remains for another corrective fall to take place later. Having said that, as 'bullish converging signals' wud appear on hourly oscillators on next decline, sharp move below 108.01 is not likely today n price shud hold abv 107.60, this is the 1.23 times extension of 110.09-108.87 measured fm 109.12, n yield strg rebound.

. Today, whilst selling dlr on intra-day recovery is recommended, one may look to buy next decline to 107.85 n take profit on subsequent rebound. On the upside, only abv 109.30 (61.8% r fm 110.09) indicates correction over, 109.69.

jpy%288%29.png
 
Last edited by a moderator:
AceTraderFx Oct 10: Daily Technical Outlook & Trading Ideals on USD/JPY

DAILY USD/JPY TECHNICAL OUTLOOK
Last Update At 09 Oct 2014 23:55GMT

Trend Daily Chart
Up

Daily Indicators
Turning down

21 HR EMA
107.89

55 HR EMA
108.10

Trend Hourly Chart
Down

Hourly Indicators
Bullish convergences

13 HR RSI
46

14 HR DMI
-ve

Daily Analysis
Consolidation b4 one more fall

Resistance
109.23 - Tue's Asian high
108.75 - Wed's NY high
108.32 - Y'day's Asian high

Support
107.53 - Y'day's low
107.40 - 12 Sep high, now sup
106.81 - 16 Sep low

. USD/JPY - 107.84 ... Although dlr came under renewed selling pressure at Tokyo open on Thur n ratcheted lower below previous day's low at 107.76 to a 3-week trough of 107.53 ahead of NY open due to renewed weakness in the Nikkei future, dlr's broad-based rally in NY later lifted price to 108.18.

. Looking at the hourly n daily charts, yesterday's weakness after penetrating Wed's low at 107.76 to 107.53 suggests as long as 108.75 res (Wed's high) holds, decline fm Oct's fresh 6-year peak of 110.09 to retrace MT uptrend wud resume n extend initial weakness to 107.40/39 (Sep 12 high n 50% r of 104.69-110.09 respectively) after consolidation, however, 'bullish converging signals' on hourly oscillators shud prevent steep fall n price shud hold well abv previous daily sup at 106.81 (Sep 16 low) n yield a much-needed rebound early next week.

. In view of abv analysis, selling dlr on intra-day recovery in anticipation of further fall is still favoured n one may turn long on dips twd 107.00 for subsequent rebound. On the upside, only abv 108.75 confirms 1st leg of correction is over n risks stronger gain twd chart obj. at 109.23.
JPY%20oct%2010.png
 
Last edited by a moderator:
AceTraderFx Oct 23: Daily Technical Outlook & Trading Ideals on USD/JPY

DAILY USD/JPY TECHNICAL OUTLOOK
Last Update At 23 Oct 2014 00:11GMT

Trend Daily Chart
Sideways

Daily Indicators
Falling

21 HR EMA
107.11

55 HR EMA
106.98

Trend Hourly Chart
Near term up

Hourly Indicators
Neutral

13 HR RSI
56

14 HR DMI
+ve

Daily Analysis
One more rise b4 strg retreat

Resistance
107.65 - 50% r of 110.09-105.20
107.49 - Last Wed's high
107.39 - Mon's high

Support
106.79 - Y'day's low
106.58 - Tue's NY low
106.25 - Tue's low

. USD/JPY - 107.18 ... Despite y'day's initial retreat fm Australian high at 107.11 to 106.79 in European morning, the greenback ratcheted higher n then rose to a session high at 107.38 in NY morning after release of slightly higher-than-expected U.S. inflation data b4 easing due to retreat in U.S. equities.

. Dlr's rise fm Tue's low at 106.25 to 107.38 suggests early pullback fm Mon's high at 107.39 has indeed ended there n despite subsequent retreat in NY y'day, downside wud be ltd to 106.79 n as long as said Tue's 106.25 low holds, consolidation abv last Wed's 5-week trough at 105.20 wud continue with mild upside bias for further headway to 107.65 (50% r of 110.09-105.20), however, as hourly indicators wud display 'bearish divergences' on such move, 108.01 (prev.sup, now res) wud cap upside n yield resumption of decline fm Oct's 6-year peak at 110.09later this month, present 'falling' daily indicators (macd has cut below the zero line) add credence to this bearish view.

. In view of abv analysis, buying dlr on dips in anticipation of another corrective rise twd 107.65 is still favoured but position traders shud sell dlr on next upmove. Below 106.25 signals recovery is over, risks re-test of 105.20.
JPY%20oct%2023%281%29.png
 
Last edited by a moderator:
AceTraderFx Oct 30: Daily Technical Outlook & Trading Ideals on USD/JPY

DAILY USD/JPY TECHNICAL OUTLOOK
Last Update At 30 Oct 2014 00:04GMT

Trend Daily Chart
Sideways

Daily Indicators
Neutral

21 HR EMA
108.46

55 HR EMA
108.21

Trend Hourly Chart
Up

Hourly Indicators
Easing fm o/bot

13 HR RSI
79

14 HR DMI
+ve

Daily Analysis
Resumption of recent up move

Resistance
109.91 - Oct's 4
109.23 - Oct's 7 high
108.96 - Y'day's high

Support
108.37 - Mon's high
107.95 - Y'day's low
107.61 - Mon's low

. USD/JPY - 108.86 ... Despite dlr's brief retreat to 107.95 in Europe on Wed, the greenback jumped after FOMC rate decision n ended its 6-year long QE program. The pair rallied to as high as 108.96 on dlr's broad-based strength.

. Looking at the hourly n daily charts, y'day's resumption of upmove fm Oct's low at 105.20 confirms early corrective fall fm Oct's 6-year peak at 110.09 has ended there n as hourly indicators are rising n current price is trading well abv 21-hr n 55-hr emas, suggesting consolidation with upside bias remains for further gain to 109.23 n then twds 109.48 res, however, hourly oscillators' readings wud be in o/bot territory, this shud prevent strg gain today n res area at 109.91-110.09 shud hold on 1st testing n yield a much-needed retreat later. Looking ahead, a daily close abv 110.09 res wud confirm the LT uptrend fm record low at 75.32 (Oct 2011) has once again resumed n yield further gain to 110.50 (being 61.8% proj. of 101.51-110.09 measured fm 105.20).

. Today, buying dlr again on dips is still the way to go. On the downside, only a breach of y'day's low at 107.95 wud signal a temporary top is made n risk stronger pullback to 107.61 sup.
JPY%20oct%2030%281%29.png
 
Last edited by a moderator:
AceTraderFx Nov 3: Weekly Technical Outlook & Trading Ideals on USD/JPY

WEEKLY USD/JPY TECHNICAL OUTLOOK
Last Update At 02 Nov 2014 23:51GMT

Trend Daily Chart
Up

Daily Indicators
Bearish divergences

21 HR EMA
111.85

55 HR EMA
110.55

Trend Hourly Chart
Up

Hourly Indicators
O/bot

13 HR RSI
80

14 HR DMI
+ve

Daily Analysis
Resumption of uptrend

Resistance
113.54 - 50% proj. of 109.13-112.47 fm 111.89
113.16 - 2.618 times ext. of 106.25-108.37 fm 107.61
113.01 - Intra-day fresh high in NZ/AUS

Support

112.47 - Fri's high, now sup
111.89 - Reaction low fm 112.47
111.46 - Minor sup fm hourly chart

. USD/JPY - 112.87... The greenback maintained a steady tone initially last week as steady gains in the Nikkei boosted risk sentiment of yen selling. Dlr jumped on Fri when BoJ surprised the market with its aggressive stimulus measures, price jumped abv Oct's 110.09 high to a near 7-year peak of 112.47 in NY.

. Let's look at the bigger picture 1st, Fri's rally to 112.47 confirms the LT uptrend fm 2011 record low at 75.32 has once again resumed n price is en route to 114.92, this is 50% proj. of intermediate rise of 77.13-105.45 measured fm 100.76, however, as daily technical indicators have displayed 'bearish divergences' reckon 115.83, being 50% proj. of the entire said uptrend fm 75.32-105.45 measured fm 100.76, wud cap upside n yield correction later. Therefore, buying dlr on dips is recommended but profit shud be taken on subsequent rise. On the downside, below 110.09 (previous res, now sup) anytime wud signal temporary is in place n risk stronger retracement to 108.80/90.

. Today, dlr gapped higher to a fresh near 7-year peak of 113.01 in NZ/AUS , however, as hourly indicators' readings are in o/bot territory, reckon 113.54 wud cap upside. Look to buy on dips as sup at 11.89 shud hold fm here.
JPY%20nov%2003.png
 
Last edited by a moderator:
AceTraderFx Nov 13: Daily Technical Outlook & Trading Ideals on USD/JPY

DAILY USD/JPY TECHNICAL OUTLOOK
Last Update At 13 Nov 2014 00:29GMT

Trend Daily Chart
Up

Daily Indicators
Rising

21 HR EMA
115.47

55 HR EMA
115.33

Trend Hourly Chart
Sideways

Hourly Indicators
Neutral

13 HR RSI

51

14 HR DMI
-ve

Daily Analysis
Consolidation with upside bias

Resistance
117.09 - Equality proj. of 113.86-116.10 fm 114.85
116.42 - 61.8% proj. of 113.86-116.10 fm 114.85
116.10 - Tue's fresh 7-year high

Support
114.85 - Y'day's low
114.64 - Y'day's low
114.26 - Last Fri's low

. USD/JPY - 115.28 ...The greenback continued to take centre stage in Asia n swung wildly in Wed's session. Despite extending rebound fm Tue's 115.04 low to as high as 116.01 in Aust., price briefly dropped to 115.25 b4 bouncing back to 115.88 but only to ratchet lower to 114.85 in NY. Price later rose to 115.74.

. Looking at the hourly n daily charts, despite dlr's erratic fall fm Tue's fresh 7-year peak at 116.10 to 114.85 y'day, subsequent strg bounce in later NY trade suggests choppy consolidation with upside bias remains, however, abv 116.10 needed to extend the LT uptrend fm 2011 record low at 75.32 twd 116.42, this is 61.8% proj. of the near term rise 113.86-116.10 measured fm 115.04. Having said that, as hourly indicators' readings wud display prominent 'bearish divergences' on such move, upside shud falter well below 117.00 n risk has increased for a much-needed correction to occur. Failure to penetrate 115.88 (y'day's high in Tokyo) n a drop below 115.00/04 suggests choppy trading below 116.10 top wud continue, then stronger retracement to 114.64, n later 114.26 wud be seen.

. Today, in view of nr term upside risk, we have exited previous short position with a small loss n may sell dlr on recovery if price drops below 115.00.
jpy%2811%29.png
 
Last edited by a moderator:
Back
Top