AceTraderFx Apr 29: Daily Technical Outlook on USD/JPY

acetraderfx

AceTrader.com Representative
Messages
1,109
DAILY USD/JPY TECHNICAL OUTLOOK
Last Update At 28 Apr 2014 23:34GMT

Trend Daily Chart
Sideways

Daily Indicators
Neutral

21 HR EMA
102.39

55 HR EMA
102.33

Trend Hourly Chart
Sideways

Hourly Indicators
Rising

13 HR RSI
60

14 HR DMI
+ve

Daily Analysis
Consolidation with upside bias

Resistance
103.00 - Apr 7 low, now res
102.73 - Last Tue's high
102.63 - Y'day's high

Support
102.23 - Y'day's NY low
101.96 - Last Fri's low
101.50 - Apr 15 low

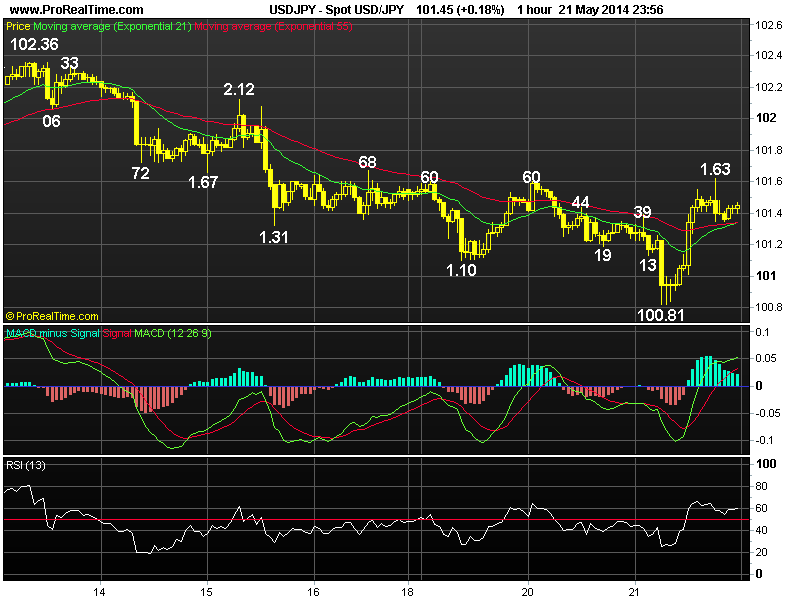
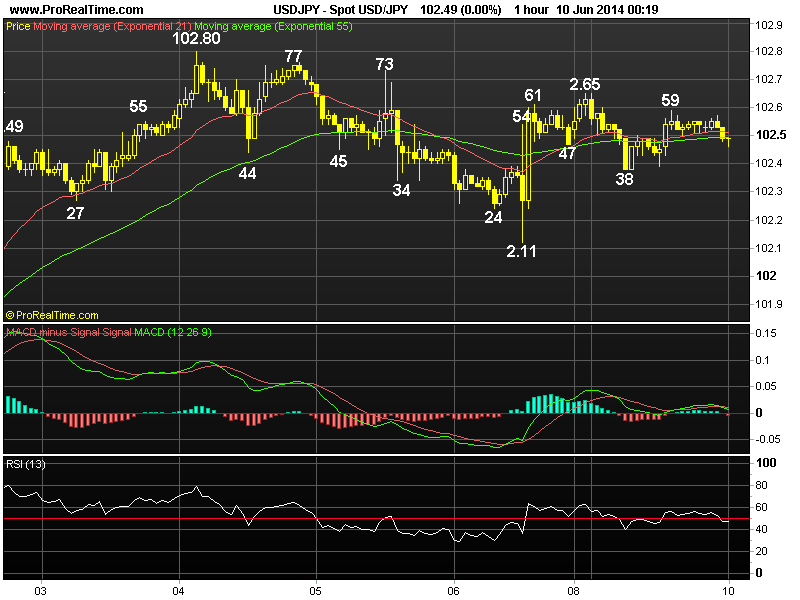
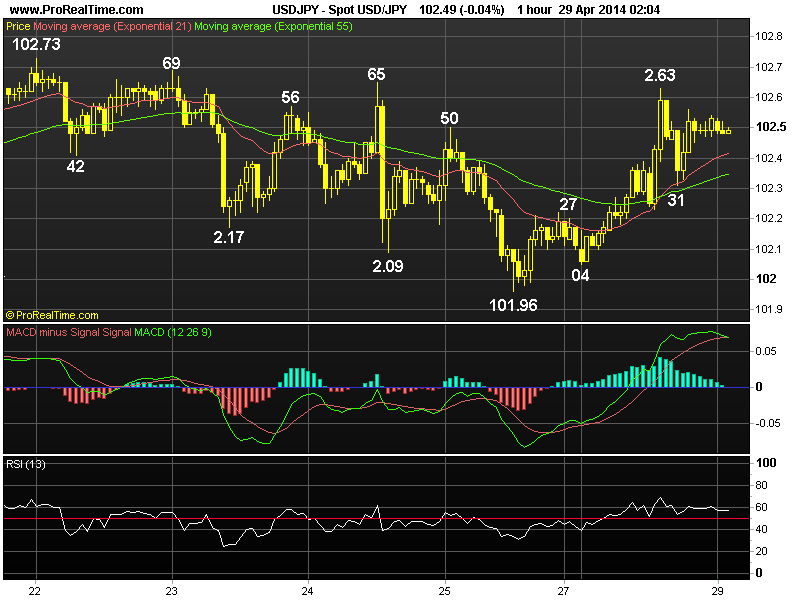
. USD/JPY - 102.51... Despite retreating to a 1-week low of 101.96 last Fri due to buying of yen on risk aversion, dlr ratcheted higher in Asia on Mon n intra-day upmove gathered pace on unwinding of previous long-yen positions, the pair climbed back to 102.63 in NY morning after upbeat U.S. pending home sales.

. Looking at the daily picture, although dlr's erratic fall fm last week's
high of 102.73 to 101.96 signals early upmove fm Apr's low at 101.32 has formed a temporary top there, Mon's stronger-than-expected cross-inspired rebound suggests pullback has ended there n re-test of 102.73 is likely, abv wud extend aforesaid rise fm 101.32 to correct dlr's decline fm Apr's 2-1/2 month peak at 104.13 twd 'dynamic' res at 103.06 (61.8% r), however, reckon pivotal res at 103.77 (Mar) wud remain intact ahead of release of the key U.S.jobs data this Fri. On the downside, below 101.96 sup wud shift to the downside for subsequent weakness to 101.50/60.

. Today, in view of abv analysis, we're turning long on dlr on dips in
anticipation of upmove to 103.00 but as hourly oscillators' readings wud be in o/bot territory on next rise, 103.30/31 shud cap upside.

JPYapr%2029.png
 
Last edited by a moderator:
AceTraderFx May 22: Daily Technical Outlook on USD/JPY


DAILY USD/JPY TECHNICAL OUTLOOK

Last Update At 22 May 2014 00:45GMT

Trend Daily Chart
Sideways

Daily Indicators
Rising

21 HR EMA
101.34

55 HR EMA
101.34

Trend Hourly Chart
Sideways

Hourly Indicators

Rising

13 HR RSI
60

14 HR DMI
+ve

Daily Analysis
Consolidation b4 decline resumes

Resistance
102.36 - Last Tue's high
102.12 - Last Thur's high
101.63 - Y'day's high

Support
101.10 - Mon's low
100.81 - Y'day's fresh 3-1/2 month low
100.76 - Feb 04 low


. USD/JPY - 101.45 ... Although dlr fell fm Tue's Asian 101.60 high to a
fresh 3-1/2 month low at 100.81 in European morning on Wed after BoJ refrained
fm adding further stimulus measures, usd's broad-based rebound in NY lifted
price to 101.55 n then climbed to 101.63 after FOMC minutes b4 easing.

. Looking at the hourly n daily charts, dlr's rebound after y'day's exten-
sion of decline fm Apr's peak at 104.13 to 100.81 suggests a temporary low has
been made n a few days of choppy trading abv 2014 bottom at 100.76 (Feb 04 low)
is in store, however, reckon res at 102.12 wud cap present rebound n another dec
line is still envisaged after consolidation. Below 100.76/81 anytime wud confirm
MT decline fm Jan's 5-year peak at 105.45 has finally resumed n yield weakness
twd 99.60 in Jun, this is a 'natural' 50% r of the LT intermediate uptrend fm
93.75-105.45.

. In view of abv analysis, we're turning long on dips today in anticipation
of further gain to 101.90/00 but aforesaid res at 101.12 shud remain intact. On
the downside, only below 100.76/81 wud abort near term bullish bias on the dlr n
risk weakness to 100.20/30 b4 correction occurs.

JPYmay%2022.png
 
Last edited by a moderator:
AceTraderFx May 27: Daily Technical Outlook on USD/JPY

=================
=================
=================


AceTraderFx May 27: Daily Technical Outlook on USD/JPY


DAILY USD/JPY TECHNICAL OUTLOOK
Last Update At 26 May 2014 23:22GMT

Trend Daily Chart
Sideways

Daily Indicators
Turning up

21 HR EMA
101.91

55 HR EMA
101.84

Trend Hourly Chart
Near term up

Hourly Indicators
Neutral

13 HR RSI
53

14 HR DMI
+ve

Daily Analysis
Consolidation with upside bias

Resistance
102.86 - 61.8% r of 104.13-100.81
102.36 - May 13 high
102.12 - May 15 high

Support
101.60 - Last Fri's low
101.35 - Hourly sup
101.10 - Mon's low


. USD/JPY - 101.92 ... Although the greenback climbed marginally abv Fri's 102.01 high to 102.05 shortly after Asian open on Mon due to initial gain in the Nikkei, cross-unwinding in yen quickly pushed price lower, dlr retreated to 101.87 n later to 101.84 in holiday-thinned North American session.

. Let's look at daily picture, as mentioned in prev. update, dlr's rebound fm last Wed's fresh 3-1/2 month trough at 100.81 to as high as 102.02 signals decline fm Apr's peak at 104.13 has indeed formed a temporary trough there n further choppy trading abv 2014 bottom at 100.76 (Feb 04 low) is in store with upside bias for gain to next chart obj. at 102.36, n then perhaps twd 102.86, being a 'dynamic' 61.8% r of the entire fall fm 104.13 to 100.81, however, as hourly oscillators wud display 'bearish divergences' on such a move, price shud falter below daily res at 103.02 (May's high) this week n yield strg retreat.

. Today, y'day's narrow movement shud spill into Asian morning session n consolidation below 102.05 wud continue, reckon Fri's low at 101.60 wud contain pullback n yield resumption of said near term upmove fm 100.81, bearish divergences on hourly indicators shud cap price below 102.47 (50% r fm 104.13-100.81).

JPYmay%2027.png


====================
====================
====================
 
Last edited by a moderator:
AceTraderFx May 30: Daily Technical Outlook & Trading Ideals on USD/JPY

DAILY USD/JPY TECHNICAL OUTLOOK
Last Update At 29 May 2014 23:47GMT

Trend Daily Chart
Sideways

Daily Indicators
Turning up

21 HR EMA
101.70

55 HR EMA
101.76

Trend Hourly Chart
Sideways

Hourly Indicators
Turning up

13 HR RSI
53

14 HR DMI
+ve

Daily Analysis
Consolidation b4 one more rise

Resistance
102.36 - May 13 high
102.14 - Tue's high
101.89 - Hourly res

Support
101.43 - Y'day's low
101.10 - May 19 low
100.81 - Last Wed's fresh 3-1/2 month low


. USD/JPY - 101.74... The greenback weakened on Thur n ratcheted lower fm Australian high of 101.87 to 101.47 in European morning due to broad-based buying of yen. Price briefly fell to a fresh session low of 101.43 in NY morning after mixed U.S. economic data b4 staging a rebound to 101.79.

. Looking at the hourly n daily charts, although y'day's breach of 101.64 sup signals recent upmove fm last Wed's fresh 3-1/2 month trough at 100.81 has formed a temporary top there, subsequent rebound signals pullback has possibly ended n as long as 101.43 sup holds, upside bias remains for aforesaid upmove to resume, abv 101.98 wud add credence to this view as hourly macd wud have cut abv zero line on such move, then dlr will be en route to next daily chart obj. at 102.36.(May 13 high), n later to 102.86 next week, this is the 'dynamic' 61.8% r of the entire fall fm 104.13 to 100.81, in early Jun, however, as broad outlook remains consolidative, daily res at 103.02 (May's high) wud hold.

. In view of abv analysis, trading dlr fm long side is still the favoured strategy today n only a daily close below 101.30 wud abort present bullish scenario n risk stronger retreat to 101.00.
JPY%20may%2030.png
 
Last edited by a moderator:
AceTraderFx Jun 5: Daily Technical Outlook & Trading Ideals on USD/JPY

DAILY USD/JPY TECHNICAL OUTLOOK
Last Update At 04 Jun 2014 23:38GMT

Trend Daily Chart
Sideways

Daily Indicators
Turning up

21 HR EMA
102.65

55 HR EMA
102.50

Trend Hourly Chart
Near term up

Hourly Indicators
Bearish divergecnes

13 HR RSI
55

14 HR DMI
+ve

Daily Analysis
Consolidation b4 marginal rise

Resistance
103.58 - 1.618 times extn of 100.81-102.14 fm 101.43
103.02 - May 02 high
102.80 - Y'day's 1-month high

Support

102.27 - Tue's low
102.14 - Last Tue's high, now sup
101.79 - Prev. res, now sup

. USD/JPY - 102.68... Although dlr retreated fm Asian fresh 1-month peak at 102.80 on Wed n then dropped to 102.44 in NY morning due to downbeat U.S. ADP private payrolls report, price rebounded to 102.75 as release of upbeat U.S. Service ISM boosted demand for the greenback b4 moving sideways in NY session.

. Looking at the hourly n daily charts, dlr's rebound after meeting renewed buying at 102.44 suggests pullback fm y'day's high of 102.80 has ended there n upside bias remains for upmove fm May's 3-1/2 month low at 100.81 to retrace erratic fall fm 104.13 (Apr) to resume n extend to 103.02, being May's high, how ever, as prominent 'bearish diverging signals' wud appear on hourly indicators on such move, strg gain unlikely to be seen n reckon price shud falter well below 103.58, this is the 1.618 times extension of 100.81-102.14 measured fm 101.43, n risk has increased for a much-needed correction to occur later.

. In view of abv mildly bullish outlook, we are holding our daily long position in anticipation of one more rise twd 103.15/20 today n only below 102.14 (prev. res, now sup) wud signal temporary top is made n risk a long-overdue retracement twd 101.79 b4 prospect of another rise next week.

JPY%20jun%2005.png
 
Last edited by a moderator:
AceTraderFx Jun 10: Daily Technical Outlook & Trading Ideals on USD/JPY

DAILY USD/JPY TECHNICAL OUTLOOK
Last Update At 09 Jun 2014 23:57GMT

Trend Daily Chart
Sideways

Daily Indicators
Rising

21 HR EMA
102.51

55 HR EMA
102.48

Trend Hourly Chart
Sideways

Hourly Indicators
Neutral

13 HR RSI
48

14 HR DMI
-ve

Daily Analysis
Consolidation b4 one more rise

Resistance
103.58 - 1.618 times extn of 100.81-102.14 fm 101.43
103.02 - May 02 high
102.80 - Last Wed's 1-month high

Support
102.38 - Y'day's low
102.11 - Last Fri's low
101.94 - Last Mon's European low


. USD/JPY - 102.49... Although dlr retreated after an initial marginal gain to 102.65 in Asian morning, price retreated as the release of upbeat Japan GDP boosted demand for yen. Later, dollar weakened to 102.38 in European morning n then rebounded to 102.59 in NY morning b4 moving sideways in quiet NY afternoon.

. Looking at the hourly n daily charts, dlr's strg rebound fm Fri's low at 102.11 to 102.65 y'day signals pullback fm last Wed's fresh 1-month peak at 102.80 has ended there n as the daily technical indicators are rising, suggesting upside bias remains for recent erratic upmove fm May's 3-1/2 month low at 100.81 to resume n extend to 102.86 n then 103.02, being the 'dynamic' 61.8% r of the early fall fm 104.13-100.81 n May 02 high. Looking ahead, a daily close abv there wud encourage for subsequent headway twd 103.50 (being 80.9% r) but as mentioned in previous updates, we're holding our view the broad sideways move fm 2014 5-year peak at 105.45 (Jan) is unfolding into a 'triangle' n pivotal res at 104.13 (possible B-leg top) wud continue to hold this month.

. Today, trading dlr fm long side for gain twd 103.02 is recommended n only below 102.11 wud confirm temporary is made n risk 101.57 (61.8% r fm 100.81).

JPY%20jun%2010.png
 
Last edited by a moderator:
AceTraderFx Jul 4: Daily Technical Outlook & Trading Ideals on USD/JPY

DAILY USD/JPY TECHNICAL OUTLOOK

Last Update At 03 Jul 2014 23:31GMT

Trend Daily Chart
Sideways

Daily Indicators
Turning up

21 HR EMA
102.09

55 HR EMA
101.88

Trend Hourly Chart
Up

Hourly Indicators
Easing fm o/bot

13 HR RSI
72

14 HR DMI
+ve

Daily Analysis
Consolidation b4 upmove resumes

Resistance
103.02 - May 02 high
102.80 - Jun 4 high
102.35 - Jun 18 high

Support
101.96 - Thur's European morning high
101.65 - Wed's high, now sup
101.41 - Wed's low


. USD/JPY - 102.21... Dlr strengthened after finding support at 101.76 in Aust. on Thur n price edged higher to 101.94 in Asia, then 101.96 in European morning. Later, release of upbeat U.S. payrolls data triggered broad-based buying in greenback n the pair surged to 102.27 in NY morning b4 easing.

. Looking at the daily picture, y'day's rally abv Wed's 101.84 high to 102.27 signals Jun's 3-legged decline 102.80 has ended at Mon's 5-week trough at 101.24 n as price is currently trading abv both 21-hr n 55-hr emas, suggesting bias to dlr remains to the upside, abv daily res at 102.35 (Jun 9 high) anytime wud confirm this view n bring re-test of 103.02 (May high), abv wud encourage for further headway to 103.23 (100% proj. of 100.81-102.80 measured fm 101.24) next week. Therefore, position players shud buy dlr on dips for this move.

. In view of abv analysis, trading dlr fm long side for gain twd 103.02 is recommended. On the downside, only below 101.41 (Wed's low) wud dampen current mildly bullish scenario n risk one more fall twd 101.00 but present 'horizontal' movement in the daily 13-day & 55-day emas suggests the near 6-month long side-ways range of 100.76-104.13 is set to continue, key sup 100.76 shud hold.

JPY%20jul%2004.png
 
Last edited by a moderator:
AceTraderFx Sept 3: Daily Technical Outlook & Trading Ideals on USD/JPY


DAILY USD/JPY TECHNICAL OUTLOOK
Last Update At 02 Sep 2014 23:52GMT

Trend Daily Chart
Up

Daily Indicators
Rising

21 HR EMA
104.97

55 HR EMA
104.63

Trend Hourly Chart
Up

Hourly Indicators
Bearish divergences

13 HR RSI
84

14 HR DMI
+ve

Daily Analysis
Resumption of recent up move

Resistance
106.26 - 1.618 times ext. of 100.76-104.13 fm 100.81
105.91 - 2.618 ext. of 103.56-104.25 fm 104.10
105.45 - Jan 02 5-year high

Support
104.78 - Tue's European low
104.49 - last Mon's NZ high (Reuters)
104.10 - Mon's European low


. USD/JPY - 105.24 ... The greenback jumped shortly after Tokyo open on Tue on speculation PM Abe will appoint a minister who will increase the national pension fund twd riskier assets led to rally in the Nikkei. Price climbed to a fresh 8-month high of 105.21 in NY morning after the release of stronger-than-expected U.S. ISM manufacturing PMI data. Dlr then rose to 105.27 in Aust. Wed.

. Looking at the hourly n daily charts, y'day's rally after early breach of Apr's 104.13 high confirms an 'upside break' of the 7-month long broad sideways consolidation fm Jan's 5-year peak at 105.45 has indeed taken place n a breach of aforesaid 2014 high at 105.45 will be forthcoming soon to confirm LT rise fm 75.32 (2011 record low) has finally resumed n yield further gain to 106.26 (being 1.618 times extension of 100.76-104.13 measured fm 100.81) n later twd 107.06, this is 50% proj. of 77.13-103.74 fm 96.73). On the downside, only a breach of 104.13 (Apr's high, now sup) wud signal a temporary top is made n risk stronger pullback to 103.81 but sup at 103.56 is expected to remain intact.

. In view of abv analysis, buying dlr again on dips in anticipation of a re-test of 105.45 res is favoured. Only a breach of 104.49 indicates top, 104.10.

JPYSEP%203.png
 
Last edited by a moderator:
AceTraderFx Sept 10: Daily Technical Outlook & Trading Ideals on USD/JPY

DAILY USD/JPY TECHNICAL OUTLOOK
Last Update At 10 Sep 2014 00:02GMT

Trend Daily Chart
Up

Daily Indicators
Rising

21 HR EMA
106.17

55 HR EMA
105.87

Trend Hourly Chart
Up

Hourly Indicators
Bearish divergences

13 HR RSI
50

14 HR DMI
-ve

Daily Analysis
Consolidation b4 one more rise

Resistance
106.96 - 2.618 times ext. of 101.07-103.15 fm 101.51
106.61 - 50% proj. of 93.75-105.45 fm 100.76
106.47 - Y'day's fresh near 6-year high

Support

105.95 - Y'day's low (AUS)
105.71 - Last Fri's high, now sup
105.23 - Mon's Asian high

. USD/JPY - 106.14 ... The greenback maintained a firm undertone on Tue n rose to 106.39 in European morning, then later to a fresh 6-year high of 106.49 in NY due to dollar's broad-based strength but weakness in the U.S. stocks triggered profit-taking in the dlr, knocking the pair to 106.04 near NY close.

. Looking at the hourly n daily charts, dlr's early rally abv Jan's 105.45 peak to 106.47 y'day signals the LT uptrend fm record low at 75.32 (Nov 2011') remains in force n marginal gain to 106.61 (being 50% projection of the intermediate rise fm 93.75-105.45 proj. fm 100.76) is likely after minor consolidation, however, as hourly technical indicators' readings have already displayed 'bearish divergences', reckon 107.06 (being 50% projection of 77.13-103.74 measured fm 96.73) wud hold on 1st testing n yield a 'much-needed' minor correction. On the downside, only below last Fri's 104.69 low signals temp. top is in place.

. Today, expect initial consolidation with mild downside bias b4 prospect of marginal rise. So buying on dips is still favoured n only below 105.71 (last Fri's high, now sup) confirms a temporary top is made n may risk a stronger retracement twd 105.23 but pivotal sup at 104.69 is expected to remain intact.

untitled%281%29.png
 
Last edited by a moderator:
AceTraderFx Sept 19: Daily Technical Outlook & Trading Ideals on USD/JPY

DAILY USD/JPY TECHNICAL OUTLOOK
Last Update At 18 Sep 2014 23:55GMT

Trend Daily Chart
Up

Daily Indicators
Rising

21 HR EMA
108.63

55 HR EMA
108.18

Trend Hourly Chart
Up

Hourly Indicators
Bearish divergences

13 HR RSI
66

14 HR DMI
+ve

Daily Analysis
Consolidation b4 one more fall

Resistance
110.67 - Aug 15 2008 high
109.52 - 2 times ext. of 101.51-104.49 fm 103.56
109.08 - Sep 08 2008 high

Support
108.50 - Thur's European low
108.14 - 38.2% r of 106.81-108.96
107.88 - 50% of 106.81-108.96


. USD/JPY - 108.82 ... The greenback maintained a firm undertone on Thur following Wed's rally due to broad-based gain in global stocks. Dlr rose to a fresh 6-year peak of 108.96 in New York after weekly U.S. jobless claims came in lower than market forecast, however, offers at 109.00 capped intra-day gain.

. Dlr's firmness after rallying to 108.96 suggests the LT uptrend fm 2011 record low at 75.32 (Nov) wud resume after consolidation n marginal gain abv next daily chart obj. at 109.08 (Sep 08 2008 high) is now envisaged, however,high readings on daily oscillators n 'bearish divergences' on hourly indicators shud prevent strg gain abv there n reckon 109.52, being 2 times extension of MT intermediate rise fm 101.51-104.49 measured fm 103.56, shud cap upside n yield a long-overdue minor correction. Looking ahead, dlr is en route to 2008 peak at 110.67. On the downside, only a daily close below 107.40 wud signal a temporary top is in place n risk stronger retrace. to 106.81 sup.

. In view of abv analysis, buying dlr again on dips in anticipation of further rise is the way to go as only below 108.00 wud confirm a temporary is in place n risks stronger retracement twd 107.40 next week.

JPY%20sep%2019.png
 
Last edited by a moderator:
Back
Top