acetraderfx
AceTrader.com Representative
- Messages
- 1,109
DAILY USD/JPY TECHNICAL OUTLOOK
21 Feb 2014 00:02GMT
Trend Daily Chart
Sideways
Daily Indicators
Turning up
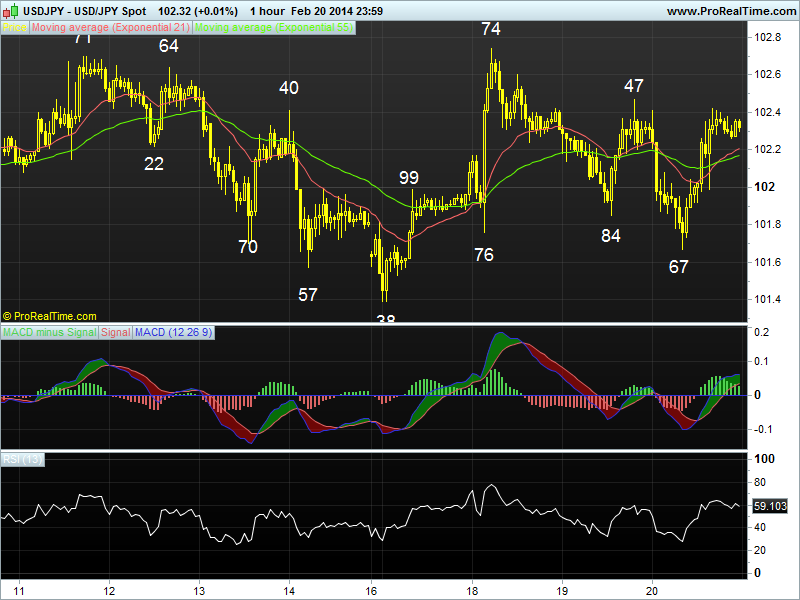
21 HR EMA
102.22
55 HR EMA
102.17
Trend Hourly Chart
Sideways
Hourly Indicators
Rising
13 HR RSI
62
14 HR DMI
+ve
Daily Analysis
Choppy consolidation to continue
Resistance
103.10 - 50% r of 105.45-100.76
102.74 - Tue's high
102.47 - Wed's high
Support
101.67 - Y'day's low
101.38 - Mon's low
100.76 - Feb 06 low
. USD/JPY - 102.32... The greenback met heavy selling pressure in Asia due to selloff in Nikkei index together with release of poor CH manf. PMI n tumbled to session low at 101.67 in European morning. However, dlr pared its losses n rose to 102.43 in NY morning after data showed U.S. jobless claims fell.
. Looking at the hourly n daily charts, despite y'day's initial retreat to 101.67, subsequent rebound suggests choppy consolidation abv Feb's 10-wk low at 100.76 wud continue with mild upside bias wud be seen, abv Tue's high at 102.74 is needed to confirm erratic decline fm Jan's 5-year peak at 105.45 has formed a low there n bring stronger correction twds 103.10, being the 'natural' 50% r of the abovementioned fall, a break there wud extend marginally but reckon daily res at 103.45 (Jan 28 peak) shud remain intact n yield decline early next week.
On the downside, only below 101.38 wud signal recovery fm 100.76 is over instead n turn outlook bearish for a re-test of said low.
. Today, in view of abv analysis n as dlr continues to edge higher at Asian open, buying on intra-day dips is the way to go with a stop placed below y'day's low at 101.67, break wud abort bullishness on the buck, risk 101.38.
21 Feb 2014 00:02GMT
Trend Daily Chart
Sideways
Daily Indicators
Turning up
21 HR EMA
102.22
55 HR EMA
102.17
Trend Hourly Chart
Sideways
Hourly Indicators
Rising
13 HR RSI
62
14 HR DMI
+ve
Daily Analysis
Choppy consolidation to continue
Resistance
103.10 - 50% r of 105.45-100.76
102.74 - Tue's high
102.47 - Wed's high
Support
101.67 - Y'day's low
101.38 - Mon's low
100.76 - Feb 06 low
. USD/JPY - 102.32... The greenback met heavy selling pressure in Asia due to selloff in Nikkei index together with release of poor CH manf. PMI n tumbled to session low at 101.67 in European morning. However, dlr pared its losses n rose to 102.43 in NY morning after data showed U.S. jobless claims fell.
. Looking at the hourly n daily charts, despite y'day's initial retreat to 101.67, subsequent rebound suggests choppy consolidation abv Feb's 10-wk low at 100.76 wud continue with mild upside bias wud be seen, abv Tue's high at 102.74 is needed to confirm erratic decline fm Jan's 5-year peak at 105.45 has formed a low there n bring stronger correction twds 103.10, being the 'natural' 50% r of the abovementioned fall, a break there wud extend marginally but reckon daily res at 103.45 (Jan 28 peak) shud remain intact n yield decline early next week.
On the downside, only below 101.38 wud signal recovery fm 100.76 is over instead n turn outlook bearish for a re-test of said low.
. Today, in view of abv analysis n as dlr continues to edge higher at Asian open, buying on intra-day dips is the way to go with a stop placed below y'day's low at 101.67, break wud abort bullishness on the buck, risk 101.38.
Last edited by a moderator: