acetraderfx
AceTrader.com Representative
- Messages
- 1,109
WEEKLY USD/JPY TECHNICAL OUTLOOK
Last Update At 23 Jun 2014 00:04GMT
Trend Daily Chart
Sideways
Daily Indicators
Neutral
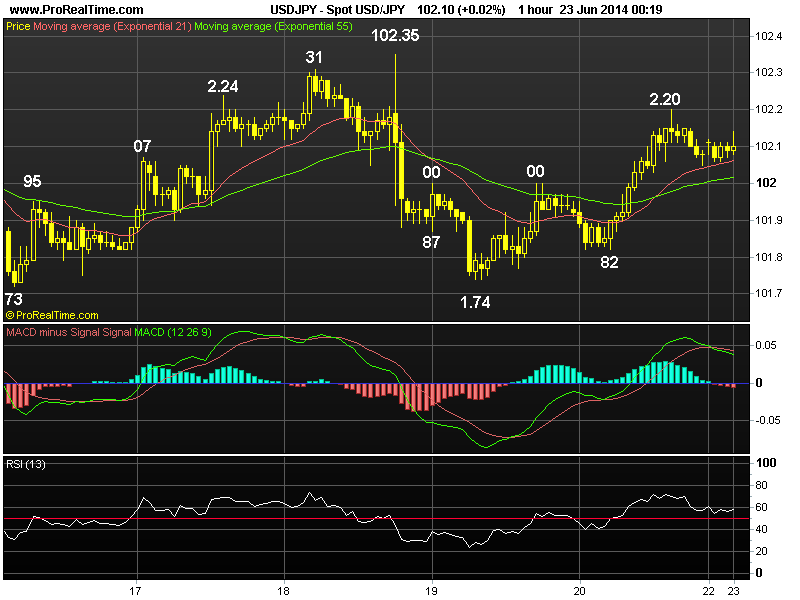
21 HR EMA
102.06
55 HR EMA
102.02
Trend Hourly Chart
Sideways
Hourly Indicators
Easing fm o/bot
13 HR RSI
61
14 HR DMI
+ve
Daily Analysis
Choppy trading to continue
Resistance
102.80 - Jun 04 high
102.65 - Mon's high
102.35 - Wed's high
Support
101.61 - Last Fri's low
101.43 - May 29 low
101.19 - 80.9% r of 100.81-102.80
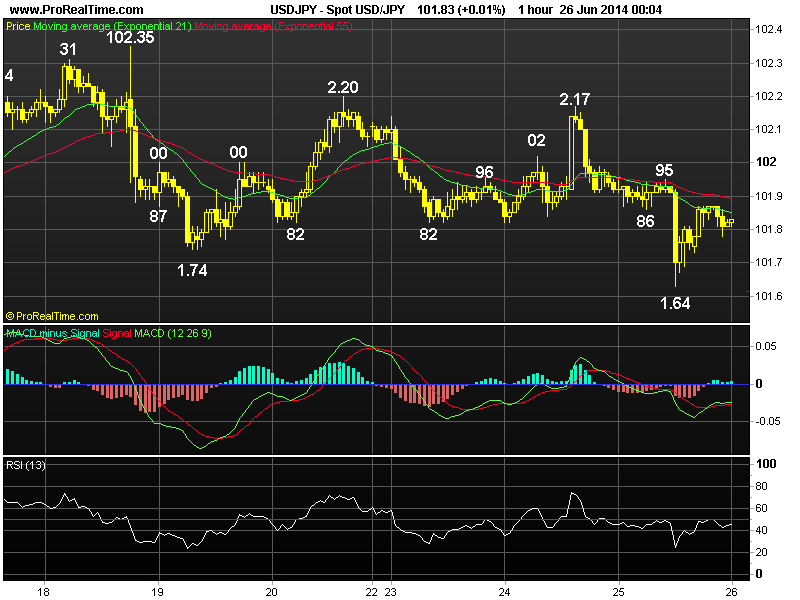
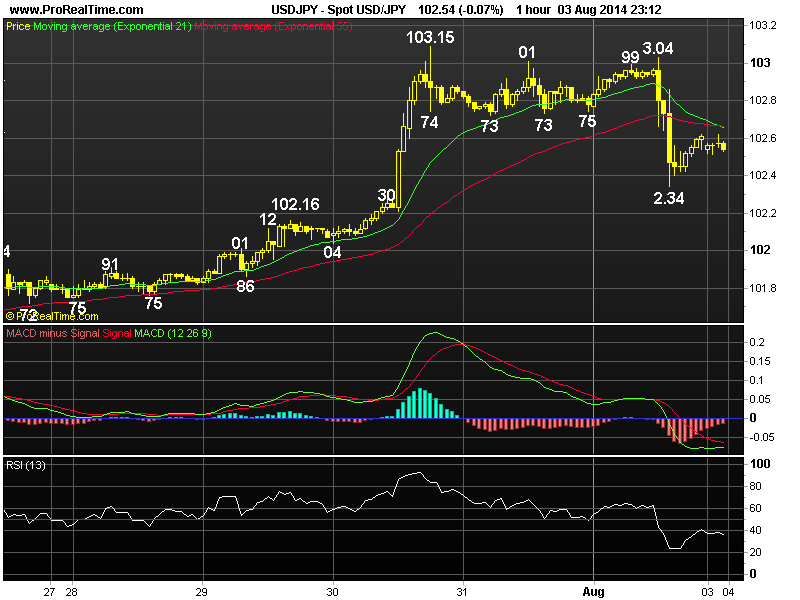
. USD/JPY - 102.12... The greenback spent a lackluster week gyrating inside a fairly narrow range of 101.73-102.35. Price ratcheted higher abv previous sup at 101.61 on Mon n then climbed to 102.35 b4 retreating back to 101.74 (Thur) on cross-buying of yen but dlr's broad-based strength lifted price to 102.20 Fri.
. Looking at the daily picture, although dlr's erratic fall fm Jun's high at 102.80 to 101.61 signals early 3-legged upmove fm May's 3-1/2 month bottom at 100.81 has formed a top there, as long as 101.19/21 holds, consolidation with upside bias remains, however, abv 102.80 is needed to retain bullish prospect of extending aforesaid rise fm 100.81 to next daily chart obj. at 103.02 but as broad outlook on dlr remains 'consolidative' (as evidenced by the horizontal movement in 13-day & 55-day emas), 103.50 (80.9% r of 104.13-100.81) shud cap upside n yield another retreat in Jul. In view of this analysis, buying dlr on dips or selling on upmove is the appropriate trading strategy this week.
. Today, despite Fri's rise fm 101.82 to 102.20 to 102.20 due to renewed cross-selling in yen, as long as 102.35 res holds, subsequent decline to 101.45 is still likely. Abv 102.35 res may risk stronger gain twd 102.80 b4 retreat.
Last Update At 23 Jun 2014 00:04GMT
Trend Daily Chart
Sideways
Daily Indicators
Neutral
21 HR EMA
102.06
55 HR EMA
102.02
Trend Hourly Chart
Sideways
Hourly Indicators
Easing fm o/bot
13 HR RSI
61
14 HR DMI
+ve
Daily Analysis
Choppy trading to continue
Resistance
102.80 - Jun 04 high
102.65 - Mon's high
102.35 - Wed's high
Support
101.61 - Last Fri's low
101.43 - May 29 low
101.19 - 80.9% r of 100.81-102.80
. USD/JPY - 102.12... The greenback spent a lackluster week gyrating inside a fairly narrow range of 101.73-102.35. Price ratcheted higher abv previous sup at 101.61 on Mon n then climbed to 102.35 b4 retreating back to 101.74 (Thur) on cross-buying of yen but dlr's broad-based strength lifted price to 102.20 Fri.
. Looking at the daily picture, although dlr's erratic fall fm Jun's high at 102.80 to 101.61 signals early 3-legged upmove fm May's 3-1/2 month bottom at 100.81 has formed a top there, as long as 101.19/21 holds, consolidation with upside bias remains, however, abv 102.80 is needed to retain bullish prospect of extending aforesaid rise fm 100.81 to next daily chart obj. at 103.02 but as broad outlook on dlr remains 'consolidative' (as evidenced by the horizontal movement in 13-day & 55-day emas), 103.50 (80.9% r of 104.13-100.81) shud cap upside n yield another retreat in Jul. In view of this analysis, buying dlr on dips or selling on upmove is the appropriate trading strategy this week.
. Today, despite Fri's rise fm 101.82 to 102.20 to 102.20 due to renewed cross-selling in yen, as long as 102.35 res holds, subsequent decline to 101.45 is still likely. Abv 102.35 res may risk stronger gain twd 102.80 b4 retreat.
Last edited by a moderator: