AceTraderFx Jun 23: Weekly/Daily Technical Outlook & Trading Ideals on USD/JPY

AceTraderFx Dec 2:Daily Technical Outlook & Trading Ideals on USD/JPY

DAILY USD/JPY TECHNICAL OUTLOOK
Last Update At 01 Dec 2014 23:27GMT

Trend Daily Chart
Up

Daily Indicators
Rising

21 HR EMA
118.38

55 HR EMA
118.33

Trend Hourly Chart
Sideways

Hourly Indicators
Falling

13 HR RSI
46

14 HR DMI
-ve

Daily Analysis
Consolidatoin with downside bias

Resistance
119.15 - Y'day's fresh 7-year peak
118.98 - Prev. high on Nov 20
118.53 - Hourly chart

Support
117.87 - Y'day's low
117.24 - Last Thur's low
116.51 - 50% of the intermediate rise of 113.86-119.15

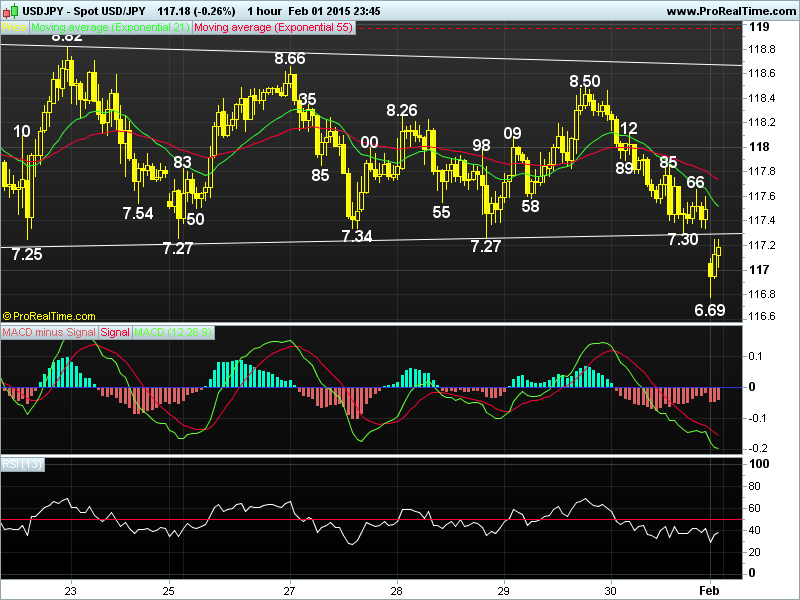
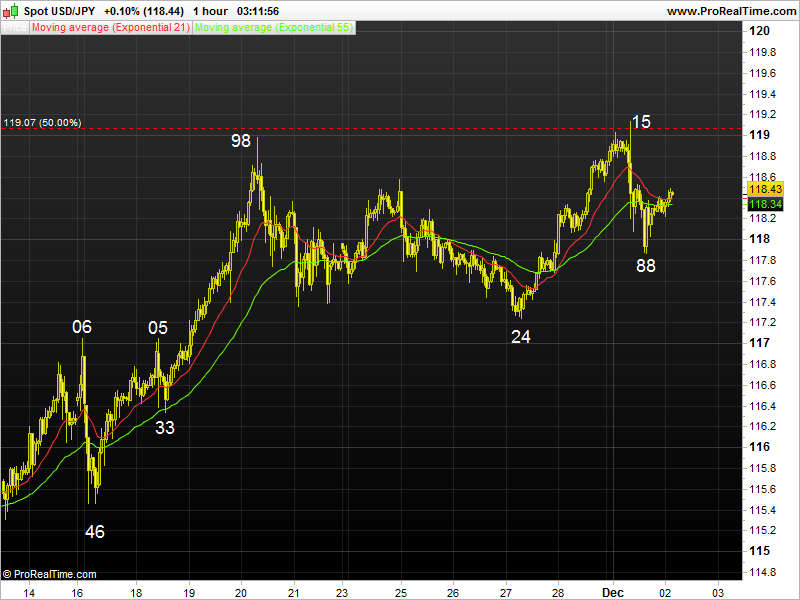
. USD/JPY - 118.30... Although dlr briefly jumped to a fresh 7-year peak at 119.15 in early Europe after Moody's downgraded Japan's rating to A1, price swiftly nose-dived to 118.09 on long-liquidation. Later, dlr fell to 117.87 in NY morning b4 recovering after upbeat ISM U.S. manf. PMI, d;r climbed to 118.41.

. Looking at the hourly n daily charts, y'day's aforesaid sharp decline after a brief breach of Nov's peak at 118.98 to 119.15 suggests LT up move fm record low at 75.32 (Oct 2011) has made a temporary top n a few days of choppy trading below this res wud be seen, a breach of 117.68/74 (hourly chart n 38.2% r of intermediate rise of 115.46-119.15) wud add credence to this view n yield stronger retracement twd 117.24/31, being last Thur's low n the 'natural' 50.0% of aforesaid upmove, however, reckon 116.51, being 50% r of intermediate rise of 113.86-119.15, wud hold n bring rebound later this week.

. Today, as long as 119.15 top holds, selling dlr on recovery in anticipation of another corrective fall twd 117.50 is favoured. Only a firm rise abv 119.15 wud revive early bullishness n extend gain to 119.35/40 n then later twd 119.80, this is 50% proj. of 113.86-118.98 measured fm 117.24.
JPY%2815%29.png
 
Last edited by a moderator:
AceTraderFx Dec 9: Daily Technical Outlook & Trading Ideals on USD/CHF


DAILY USD/CHF TECHNICAL OUTLOOK
Last Update At 09 Dec 2014 00:18GMT

Trend Daily Chart
Up

Daily Indicators
Bearish divergences

21 HR EMA
0.9774

55 HR EMA
0.9767

Trend Hourly Chart
Sideways

Hourly Indicators
Rising fm o/s

13 HR RSI
46

14 HR DMI
-ve

Daily Analysis
Resumption of MT downtrend

Resistance
0.9875 - 61.8% proj. of 0.8857-0.8690 fm 0.9360
0.9843 - 1.236 times extn. of 0.9530-0.9731 fm 0.9695
0.9818 - Y'day's high

Support
0.9738 - Last Fri's Euroepean high
0.9703 - Last Fri's low
0.9650 - Last Thur's low

. USD/CHF - 0.9767... Despite a brief retreat to 0.9774 in Asian morning y'day, renewed buying emerged n pushed price higher to a fresh 1-1/2 year peak of 0.9818 in European morning on renewed euro's weakness. However, price pared retreated sharply to 0.9738 in NY session due to broad-based usd's decline.

. Despite dlr's resumption of the 3-legged uptrend fm Mar's 2-1/2 year trough at 0.8698 to 0.9818, subsequent retreat to 0.9738 suggests a minor top is possibly in place n below 0.9703 wud add credence to this view, then several days of choppy consolidation with downside bias wud be seen n bring a long-overdue minor correction to 0.9650, however, reckon 0.9595 sup wud remain intact n yield subsequent rebound. On the upside, abv 0.9818 wud yield marginal gain twd 0.9875, this is 61.8% proj. of the MT intermediate rise fm 0.8857-0.8690 measured fm 0.9360. Having said that, as hourly & daily indicators' readings wud display 'bearish divergences' on such move, 'psychological res at 1.0000 shud remain intact this week n bring a strg correction.

. Today, in view of broad consolidation outlook, we're trading dlr on both sides of the market n wud sell on recovery or buy on next intra-day decline.
CHF%20dec%2009.png
 
Last edited by a moderator:
AceTraderFx Dec 22: Weekly Technical Outlook & Trading Ideals on USD/JPY

WEEKLY USD/JPY TECHNICAL OUTLOOK
Last Update At 21 Dec 2014 23:09GMT

Trend Daily Chart
Sideways

Daily Indicators
Bearish divergences

21 HR EMA
119.38

55 HR EMA
118.95

Trend Hourly Chart
Near term up

Hourly Indicators
Bearish divergences

13 HR RSI
61

14 HR DMI
+ve

Daily Analysis
Consolidation with upside bias

Resistance
120.20 - Dec 08 low
119.93 - Dec 10 high
119.66 - Intra-day high (NZ)

Support
119.04 - Hourly chart
118.84 - Fri's NY low
118.26 - Y'day's European sup

. USD/JPY - 119.54 ... Dlr swung fm loss to gain in last week's roller-coaster session. Price met renewed selling at 119.06 on Mon n penetrated 117.45 sup due to broad-based buying of yen on risk aversion, buying interest at 115.57 quickly lifted dlr n the pair later rallied back to as high as 119.62 on Fri.

. Looking at the bigger picture, dlr's aforesaid strg rebound suggests correction fm Dec's fresh 7-year peak at 121.85 has ended there n consolidation with upside bias is envisaged in this holiday-shortened X'mas week, a daily close abv 120.20 (previous sup, now res) wud encourage for further headway twd pivotal res at 121.00, break wud bring re-test of 121.85, then twd 123.89 later this month or in Jan 2015, this is 50% proj. of MT intermediate rise fm 105.20-121.85 measured fm 115.57. Having said that, as daily technical indicators wud display prominent 'bearish divergences' on such move, reckon 125.86 (61.8% proj. fm 115.57) wud remain intact. On the downside, below 117.76 wud prolong choppy consolidation n may risk weakness to 116.25, then twd 115.57.

. Today, as long as 118.84 sup holds, up move fm 115.57 wud head twd 119.90/00, 'bearish divergences' on hourly indicators wud cap dlr at 120.20.
JPY%20dec%2022.png
 
Last edited by a moderator:
AceTraderFx Jan 27: Daily Technical Outlook & Trading Ideals USD/JPY

DAILY USD/JPY TECHNICAL OUTLOOK
Last Update At 26 Jan 2015 23:52GMT

Trend Daily Chart
Sideways

Daily Indicators
Falling

21 HR EMA
118.28

55 HR EMA
118.13

Trend Hourly Chart
Near term up

Hourly Indicators
Rising

13 HR RSI
64

14 HR DMI
+ve

Daily Analysis
Consolidation with upside bias

Resistance
119.96 - Jan 8 high
119.32 - Last Mon's high
118.87 - Last Tue's high

Support
118.08 - Hourly chart
117.83 - Y'day's Asian moring high, now sup
117.18 - Last Wed's low

. USD/JPY - 118.56... Although active cross-buying in yen pressured dlr to 117.27 ahead of Asian open on Mon, renewed weakness in yen vs other currencies lifted price n dlr rallied to 118.48 in NY morning. Later, dlr briefly retreated to 118.13 n then climbed to session high of 118.50 at NY close.

. Let's look at the bigger picture, as mentioned in recent update, dlr's volatile price action fm Dec's 7-1/2 year peak at 121.85 is developing into a triangle with a-leg trough at 115.57, subsequent bounce to 120.83 marked the b-leg top, then the decline to Jan's low at 115.85 was the c-leg bottom, last week's rise to 118.87 (Tue) signalled d-leg rise was in progress which shud falter below 120.83 n yield an e-leg fall in Feb. On the downside, only below key sup at 115.57 wud invalidate abv triangle scenario n yield correction of the LT uptrend fm 75.32 (2011 record low) to 114.55 n possibly twd 113.52 next month.

. Today, dlr's strg rebound fm said y'day's low at 117.27 suggests as long as minor sup at 118.08 hold, intra-day upside bias remains for gain twd 118.87 res, break there wud confirm abovementioned triangle d-leg upmove has resumed n shud yield gain to 119.32/37. Therefore, buying dlr again on dips is favoured.
JPY%20jan%2027.png
 
Last edited by a moderator:
AceTraderFx Feb 2: Weekly Technical Outlook & Trading Ideals USD/JPY

WEEKLY USD/JPY TECHNICAL OUTLOOK
Last Update At 01 Feb 2015 23:54GMT

Trend Daily Chart
Sideways

Daily Indicators
Neutral

21 HR EMA
117.52

55 HR EMA
117.74

Trend Hourly Chart
Near term down

Hourly Indicators
Falling

13 HR RSI
38

14 HR DMI
-ve

Daily Analysis
Choppy consolidation to continue

Resistance
118.50 - Last Thur's high
118.12 - Hourly chart
117.66 - Hourly chart

Support
116.69 - Intra-day low in NZ (Reuters)
116.32 - Jan 16 European low
115.85 - Jan 16 low

. USD/JPY - 117.16... The greenback swung wildly last week inside previous broad range of 118.87-117.48. Dlr staged a strg bounce fm 117.27 (Mon) to 118.66 Tue but only to fall back to 117.27 Wed. Despite a rebound to 118.50 Thur, price fell to 117.30 in NY Fri, then gapped lower to 116.69 at NZ open today.

. Looking at the bigger picture, we've taken recent view dlr's volatile price action fm Dec's 7-1/2 year peak at 121.85 is developing into a triangle with a-leg trough at 115.57, 120.83 marked the b-leg top, the decline to Jan's low at 115.85 was the c-leg bottom. Then dlr's subsequent strg bounce to 118.87 was the 3-legged d-leg upmove. Despite today's weakness to 116.69, reckon downside wud hold well abv 115.85 n bring rebound later this week, however, a daily close abv 118.87 needed to signal an 'upside break' of recent broad consolidation has taken place. On the downside, only below key sup at 115.57 wud invalidate abv triangle scenario n yield correction of the LT uptrend fm 75.32 (2011 record low) to 114.55 n possibly twd 113.52 later.

. Today, intra-day buyong of yen on risk aversion following w/end's downbeat China PMIs may pressure dlr to 116.40/50 b4 prospect of another rebound.
JPY%20feb%2001.png
 
Last edited by a moderator:
AceTraderFx May 26: Daily Technical Outlook & Trading USD/JPY

DAILY USD/JPY TECHNICAL OUTLOOK
Last Update At 26 May 2015 00:00GMT

Trend Daily Chart

Sideways

Daily Indicators
Rising

21 HR EMA
121.53

55 HR EMA

121.37

Trend Hourly Chart
Up

Hourly Indicators
Bearish divergences

13 HR RSI
64

14 HR DMI
+ve

Daily Analysis
Consolidation b4 marginal rise

Resistance
122.52 - 50% projection of 115.57-122.03 fm 119.29
122.03 - Mar's 12-year high (10th)
121.78 - Y'day's high

Support
121.45 - Y'day's low
121.09 - Last Fri's Asian high (now sup)
120.64 - Last Fri's low

. USD/JPY - 121.66..Although dlr continued its recent winning streak y'day n climbed to a fresh 2-month high of 121.78 at Asian open due to renewed weakness in eur/usd in NZ/AUS, intra-day rebound in the euro led to long liquidation , the pair retreated to 121.45 in Europe n moved narrowly in thin NY session.

. On the bigger picture, dlr's early rally abv indicated pivotal res at 120.84 signals an 'upside break' of the 10-week long broad range of 122.03-118.33 has taken place n re-test of Mar's near 8-year peak at 122.03 wud be forthcoming soon. A daily close abv said key res wud confirm uptrend fm 2011 record low at 75.32 to retrace LT intermediate fall fm 147.64 (1998 Jun's high) has finally resumed, then outlook wud bode well for gain to 122.52, then 123.28, being 50% & 61.8% projections respectively of intermediate rise fm 115.57-122.03 measured fm 119.29. Our weekly strategy is holding a long position in anticipation of upmove to said upside obj n only below 120.64 wud dampen present bullish scenario, risk stronger retracement twd 120.04 b4 prospect of another rise.

. Today, intra-day firmness at Asian open suggests marginal gain abv 121.78 is likely but bearish divergences on hourly indicators may cap dlr below 122.03.
JPY%20may%2026.png
 
Last edited by a moderator:
AceTraderFx Jul 8: Daily Technical Outlook & Trading USD/JPY

DAILY USD/JPY TECHNICAL OUTLOOK
Last Update At 08 Jul 2015 00:15GMT

Trend Daily Chart
Sideways

Daily Indicators
Turning down

21 HR EMA
122.49

55 HR EMA
122.58

Trend Hourly Chart
Sideways

Hourly Indicators
Neutral

13 HR RSI
49

14 HR DMI
+ve

Daily Analysis
Choppy consolidation to continue

Resistance
123.75 - Last Thur's low
123.19 - Last Fri's high
122.93 - Mon's high

Support
122.01 - Y'day's low
121.70 - Y'day's fresh 1-month low (NZ)
121.49 - May 20 high (now sup)

. USD/JPY - 122.54... Despite a brief bounce to 122.88 on Tue, renewed selling below Mon's 122.93 high knocked price lower. Dlr nose-dived to 122.01 on renewed risk aversion due to the selloff in global equities b4 recovering.

. On the bigger picture, dlr's erratic fall fm Jun's near 13-year peak at 125.86 to last week's 121.94 low, then a fresh 1-month trough of 121.70 on Mon confirms the LT uptrend fm 2011 record low at 75.32 has formed a temporary high there. Despite dlr's rebound fm 121.70 to 122.93, subsequent strg retreat to 122.01 y'day suggests recovery has possibly ended, however, breach of said sup is needed to confirm aforesaid fall has once again resumed n extend to 121.49 sup. On the upside, abv 122.93/97 res wud bring stronger retracement to 123.19/29 (last Fri's high n 'min' 38.2% r of 125.86-121.70 respectively) is likely but last week's high at 123.75 would cap upside n yield resumption of aforesaid decline fm 125.86 to 121.49 (prev. res, now sup) n then next chart sup at 120.64.

. Today, despite y'day's cross-inspired sharp retreat fm 122.88 to 122.01, subsequent rebound in the Dow had lifted dlr in NY afternoon, suggesting choppy trading abv Mon's 121.70 low wud continue, abv 122.93/97 wud yield 123.19/24.
JPYJULY%2008.png
 
Last edited by a moderator:
Back
Top