SOLID ECN LLC
Solid ECN Representative
- Messages
- 513
MasterCard - Technical analysis
On the daily chart of the asset, a global sideways corridor of 306–380 is developing, within which the price has approached its lower border. There has not yet been a full-fledged attempt to consolidate below it but the likelihood of this remains quite high. The four-hour chart of the asset shows that if the quotes fix below the support level of 308, it is possible to continue to decline and reach an even stronger level of 280.
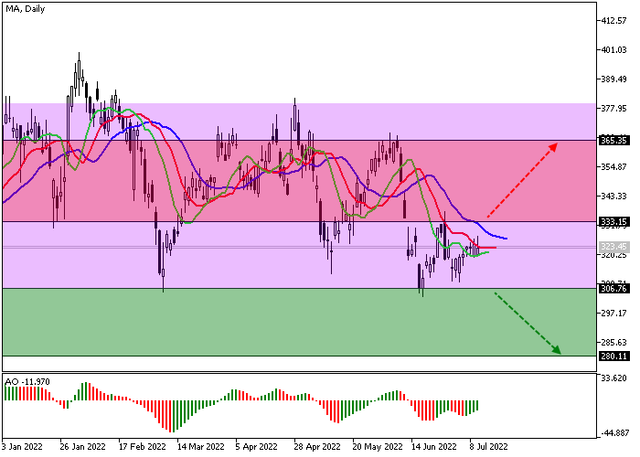
It is confirmed by the readings of technical indicators, which, working out a local correction, keep a stable sell signal: fast EMAs on the Alligator indicator are below the signal line, and the AO oscillator histogram forms new bars below the transition level.
On the daily chart of the asset, a global sideways corridor of 306–380 is developing, within which the price has approached its lower border. There has not yet been a full-fledged attempt to consolidate below it but the likelihood of this remains quite high. The four-hour chart of the asset shows that if the quotes fix below the support level of 308, it is possible to continue to decline and reach an even stronger level of 280.
It is confirmed by the readings of technical indicators, which, working out a local correction, keep a stable sell signal: fast EMAs on the Alligator indicator are below the signal line, and the AO oscillator histogram forms new bars below the transition level.