American Stock Exchange

xom-forum-1.png


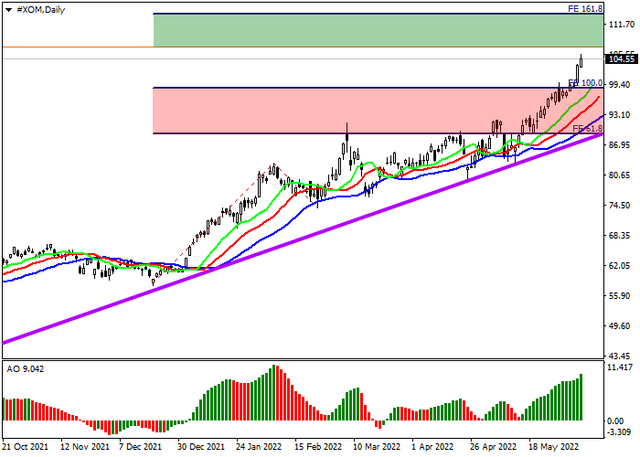
The shares of ExxonMobil Corp., one of the largest oil companies in the world, grew due to rising energy prices and are now trading near the level of 104.

An uptrend is forming on the daily chart of the asset, within which the rate renews global highs. The price has now broken the 100.0% underlying trend level of Fibonacci extension at 99.

On the 4-hour chart, it is seen that the global growth will continue soon, and the trading instrument will try to reach the full trend of 161.8% of the Fibonacci extension around 114. This scenario is supported by the readings of technical indicators: fast EMAs on the Alligator indicator expand the range of fluctuations, and the AO oscillator histogram forms rising bars high in the buying zone.

xom.png
 
amazon-1.png


The Nasdaq 100 index shows a lateral trend, trading at 12590.
US stock indices continue to experience significant pressure from the growth of bond yields, but are kept in the sideways amid investors' expectations regarding tomorrow's publication of data on consumer prices. Inflation in May could reach 0.7% after rising by 0.3%, while the annual rate, according to preliminary estimates, could remain at 8.3% in April, which, however, is unlikely given the monthly increase in fuel prices by almost 12% and the growth of oil prices above 122 dollars per barrel. In any case, until the actual data is published, new large transactions should not be expected.

Yesterday's auction for placement of 10-year Treasury notes ended with the expected growth of yield up to 3.030% against 2.943% at the previous placement. Today, auctions will be held for the placement of short-term treasury bills from 3 to 8 weeks, as well as global 30-year treasury bonds, the rate of return on which is now 3.183% against 2.997% before.

nq.png


Index quotes form a global downward channel, being in the middle of the range. Technical indicators are in a state of uncertainty: the range of EMA fluctuations on the Alligator indicator is narrowing actively and the AO oscillator histogram is near the transition level.

Support levels: 12200, 11470 | Resistance levels: 12895, 14200​
 
paypal-forum-1.png


The shares of PayPal, a debit payment processor, correct at the level of 84.
On the daily chart of the asset, the price left the wide downwards channel with the dynamic boundaries of 50 – 84, having broken the resistance line, and consolidated higher, around the local maximum of May 4 around 92.

On the four-hour chart, the instrument continues its growth attempts and is ready to break this high. While an upside scenario is a priority, a decline to the initial 61.8% trend level of the Fibonacci extension at 60 cannot be ruled out either.

Technical indicators confirm the high probability of the continuation of the current wave of corrective growth: fast EMAs on the Alligator indicator are above the signal line, and the AO oscillator histogram remains in the buying zone, forming rising bars.

paypal.png
 
ym-forum-1.png


The American stock market remains negative
The pressure on the American stock market is increasing against the background of the expected maintenance of inflation at the level of 8.3%, which, in turn, justifies the forecasts regarding the continuation of aggressive rate hikes by the US Federal Reserve. The traders are also concerned about the slowdown in the growth of the national economy, as well as the threat of a possible recession.

In the corporate segment, the American technology company Intel Corp. suspended the recruitment of new employees in the computer chip division due to increased risks of economic uncertainty, which forced management to reconsider the capital investment plan and the functioning of the departments.

Growth in the domestic bond market continues to be a negative factor for the index. According to yesterday's auction report, 3-week and 8-week short-term Treasury bills were placed at an increased rate of 1.040% and 1.150%, respectively, eliminating the possibility of a downward correction, while global 30-year Treasuries were placed at a rate of 3.185%, significantly higher than 2.997% on the previous placement.

ym.png


Quotes of the index are traded within a wide downward channel, reversing downwards. Technical indicators have significantly weakened the buy signal and are actively declining: the fluctuation range of the Alligator indicator EMAs has narrowed almost completely, and the histogram of the AO oscillator is forming new descending bars, being in the buy zone.

Support levels: 31900, 30620 | Resistance levels: 32690, 34100​
 
adobe-forum-1.png


A downtrend is forming on the daily chart of the asset, which may continue with renewed vigor if the price breaks the global year’s low of 373.

On a four-hour chart, the trading instrument failed to overcome the resistance line of the global downtrend at 440 and, having reversed, is actively declining. Despite the recent upward correction, the current momentum began with a price gap, one of the key markers reflecting its strength.

Technical indicators reflect a possible reversal: indicator Alligator’s EMA oscillation range began to actively narrow, and the histogram of the AO oscillator formed the first down bar in the buy zone.

adobe.png
 
usdjpy-forum-3.png


On the daily chart of the asset, the price, having left the limits of the global downward channel with the boundaries of 148 – 176, has broken the support line and completed the formation of a reverse test, which may signal a further continuation of the global decline to the basic trend of 100.0% on the Fibonacci expansion around 105.

On the four-hour chart, the trading instrument has broken the current local low at 132, which is the last necessary condition for continuing the downward dynamics of quotations. The nearest support for the price is the initial 61.8% Fibonacci extension trend at 122.

At the moment, indicator Alligator’s EMA oscillation range expands downwards, and the histogram of the AO oscillator forms downward bars in the sell zone.

usdjpy.png
 
cac-forum-2.png


The CAC 40 index is correcting at 6089. The French stock market continues to trade in a local downtrend against the background of the rapid growth of bonds, as well as in anticipation of another increase in domestic inflation.

Tomorrow France will publish data on inflation, which, as analysts suggest, will reflect an increase in the monthly rate of at least 0.7%, which, in turn, will lead to maintaining the annual rate at 5.8%.

cac.png


The quotes of the asset continue to trade within the global downtrend, falling to the lowest level of the year. Technical indicators are in a sell signal state: the range of EMA fluctuations on the Alligator indicator is expanding towards the decline, and the AO oscillator histogram is trading in the negative area forming descending bars.

Support levels: 5881, 5610 | Resistance levels: 6250, 6569​
 
true-ecn-broker-1.png


Tesla, technical analysis
On the daily chart, the price is within the global Expanding formation pattern, gradually approaching the support line around 550. At the moment, the formation of the fifth downward wave is observed, which has reached the basic trend of 100.0% of the Fibonacci extension around 628.
tesla.png


On a four-hour chart, the local dynamics close within the Triangle pattern with dynamic boundaries of 746 – 628, the location of which confirms the further development of negative dynamics. Fast EMAs on the Alligator indicator continues to move away from the signal line, and the AO oscillator histogram forms bars with a downward trend in the sell zone.

Read more market news
 
true-ecn-broker-1.png


Netflix, technical analysis
On the daily chart of the asset, the formation of a global downward channel with dynamic boundaries at 70 – 205 continues, within which the trading instrument has almost reached the resistance line and is preparing to continue its decline.

On the four-hour chart, it can be seen that the main obstacle for the negative dynamics is the year's low at 163, which the price has already tested twice but has not been able to break, so a slight upward pullback is quite justified: it will allow the market to gain sufficient strength and overcome the obstacle.

netflix.png


The technical indicators reversed and gave a sell signal: indicator Alligator's EMA oscillation range reversed downwards, and the histogram of the AO oscillator forms downward bars in the sell zone.​

Read more market news
 
6.png


Nasdaq 100, formation of a global descending channel
One of the leading US indices, the Nasdaq 100, shows a downward trend, being at 11211. Due to the continued decline of stock markets, investors are increasingly paying attention to third-party markers that can describe and predict the future behavior of stocks. So, according to the Dow Jones Market Data report, for the first 100 days of this year, the combined dynamics of the leading US indices Dow Jones and S&P 500 was estimated by experts to be the weakest since 1970, and of the Nasdaq 100 technology index – even in the entire history of observations. Among the main reasons are high inflation and the insufficiently transparent policy of the US Fed regarding the regulation of interest rates.

As for global dynamics, the Buffett indicator, popular among bidders, reached 205%, which points out a significant revaluation of the stock market relative to the current state of the economy and hints at a possible continuation of the collapse in prices. The Wilshire 5000 Total Market composite stock market capitalization index was 46.69T dollars, and the latest GDP data was 22.72T dollars, which corresponds to 205% in terms of the coefficient, reflecting the highest value in history, whereas before the 2008 crisis it was about 150%.

nq.png


The index quotes continue to form a global descending channel, declining in the direction of the support line. Technical indicators are in the state of a sell signal: the range of fluctuations of the EMAs of the alligator indicator is expanding in the direction of decline, and the histogram of the AO oscillator is trading in the sales zone.

Support levels: 11000, 10000 | Resistance levels: 11730, 12950

Read more market news
 
Back
Top