American Stock Exchange

baba-forum-1.png


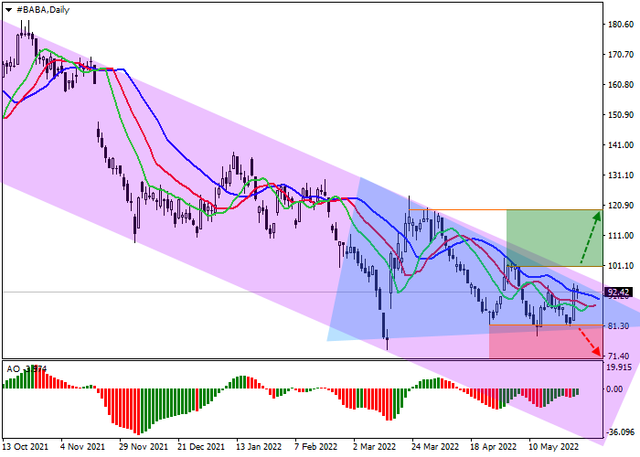
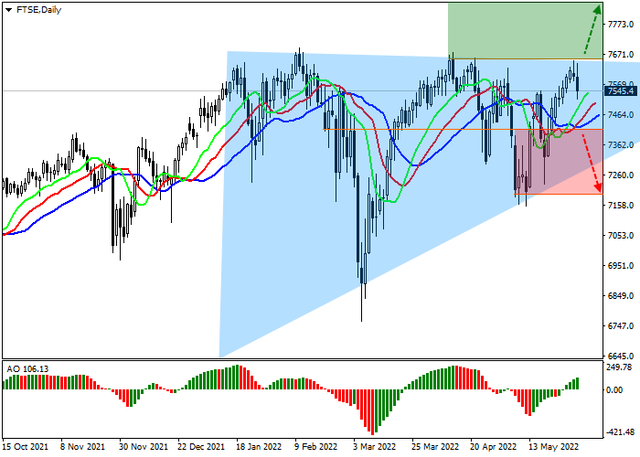
The shares of Alibaba Group Holdings Ltd., one of the largest companies in the world in the field of Internet commerce, are correcting, trading at 92. On the daily chart, a wide downwards channel with dynamic boundaries 70.00–100.00 is formed, within which the price is held for a long time near the resistance line, unsuccessfully trying to break it.

On the four-hour chart, the local Triangle pattern is formed, the upper border of which coincides with the resistance line of the global channel around 100.

At the moment, there is no clear signal from the indicators for the subsequent movement yet but, given the factor of the pattern, the growth potential prevails: fast EMA on the Alligator indicator is actively approaching the signaling line, and the histogram of the AO indicator forms upward bars.

baba.png

 
cat-forum-1.png


The shares of Caterpillar Inc., the world's leading manufacturer of construction and mining equipment, are trading in a corrective trend around 217.

On the daily chart of the asset, a global Expanding formation pattern is forming, within which the price is in the stage of developing another wave of decline, with the target located at the low of the year 179.

On the four-hour chart, a downward wave is formed within a local channel with dynamic boundaries at 193 – 213. Since it is the fourth in a row, according to the classical scenario of the development of a price pattern, the probability of its complete completion is very high, which is also confirmed by the indicators: fast EMAs on the Alligator indicator are below the signal line, and the AO oscillator histogram forms bars in the sell zone.

cat.png
 
pfizer-forum-1.png


The shares of Pfizer Inc., one of the world's largest pharmaceutical companies, are correcting slightly above 53.

An uptrend is forming on the daily chart of the asset, and the price is holding above the support line at 49, developing a local increase.

On the four-hour chart, it can be seen that the channel with dynamic boundaries 49–57 is quite stable, and the price is approaching the resistance line, which is the main goal of the current upward movement of quotes. Since the price is in the middle of the channel, a downward scenario with reaching the support line at 49 is not excluded.

Technical indicators keep a stable buy signal, which is a priority: fast EMAs on the alligator indicator are above the signal line, and the AO oscillator histogram is trading in the buy zone, forming upward bars.

pfe.png
 
amazon-forum-1.png


The shares of Amazon.com Inc., the world's largest e-commerce platform, show a moderate sideways correction, hovering around 2432. A global downtrend is forming on the daily chart of the asset, and after an unsuccessful attempt to break the year's low of 2027, the price reversed and began a local upward correction. On the 4-hour chart of the asset, after the reversal, the instrument has consolidated above the initial 23.6% Fibonacci retracement around 2347, and the next barrier to growth may be the 38.2% Fibonacci base retracement around 2550.

The readings of technical indicators also confirm the high probability of continuation of the corrective upward dynamics: indicator Alligator's EMA oscillation range began to actively narrow towards growth, and the histogram of the AO oscillator forms ascending bars in the sell zone.

amazon.png
 
ftse-forum-1.png


FTSE 100 shows local corrective dynamics, trading at around 7546.5 against the background of another increase in retail prices in the United Kingdom. Inflation was 2.8% this month, up from 2.7% in April, reflecting the strongest growth since 2011, according to data from the British Retail Consortium (BRC).

In turn, in the corporate segment, Tullow Oil Plc., an oil and gas exploration company, announced an imminent merger with another local industrial concern, Capricorn Energy Plc., which will increase the total value of the joint venture to 1.42 billion pounds. Shoe maker Dr. Martens Plc., which reported a 300% increase in pre-tax profit and a 17.5% increase in revenue in fiscal 2022, was the growth leader in the FTSE 100 index.

The index quotes are traded within the framework of the global Triangle pattern, being in the area of the resistance line. Technical indicators are holding a buy signal that remains fairly stable: the range of EMA fluctuations on the Alligator indicator is directed upwards and the AO oscillator histogram is trading in the purchases area, forming multidirectional bars.
Support levels: 7410, 7185 | Resistance levels: 7656, 7800

ftse.png
 
ebay-forum-1.png


The shares of eBay Inc., the world's largest online auction, are correcting upwards around the level of 47.

On the daily chart, the price is falling within a narrow downwards channel, approaching the resistance line. The key support remains a full correction of 61.8% Fibonacci 46, after its breakdown, the downward dynamics will intensify. On the four-hour chart, local growth may continue after consolidation above the local high of last week around 48.8. In this case, the movement target will be the 50.0% Fibonacci intermediate correction level at 53.3.

At the moment, fast EMAs on the Alligator indicator are approaching the signal line, and the AO oscillator histogram is forming upward bars in the sell zone.

ebay.png
 
hk50-1.png


The development of the COVID-19 pandemic puts pressure on the position of the asset

The leading index of the Hong Kong Stock Exchange HK 50 is trading in a corrective trend, being close to 21,380.

The situation with the development of the COVID-19 pandemic continues to have a key impact on the country's economy. Over the past two weeks, the number of new cases of the disease has begun to seriously increase: at the end of May an average of 220 cases per day was recorded, but yesterday there were detected already 515 new cases. The Hong Kong authorities do not adhere to the "zero tolerance" policy, as in China, but have already warned citizens about the introduction of new restrictive measures.

The Hong Kong bond market is trading in almost complete correlation with other major markets and is rising, putting pressure on stock indices. The main 10-year bonds are trading at a yield of 2.782%, while the global 15-year bonds reach 2.991%. Short-term treasuries are also showing an increase: annual bonds reached the level of 1.451%, and two-year bonds are trading at a yield of 2.103%.

hk50.png


On the global chart of the asset, a local Triangle pattern is forming, within which the price has reached the resistance line and is preparing for a reversal. Technical indicators are still in a state of purchase: the histogram of the AO oscillator is trading above the zero level, and the fast EMAs on the Alligator indicator are above the signal line.

Support levels: 20,000, 18,100 | Resistance levels: 22,100, 25,100.​
 
jnj-forum-1.png


The shares of Johnson & Johnson, the world's largest maker of health products, are correcting, trading at 176.

On the daily chart, the price is within the global ascending channel with dynamic boundaries of 166 –1 87, reversing from the resistance line towards the support.

On a four-hour chart, the channel's support line coincides with the multi-year support level at 166, which the asset is aiming for. The key obstacle for the downside momentum is the low of last month at 173, after which the potential for further downside dynamics will increase. The indications of technical indicators also confirm the continuation of the decline: fast EMAs on the Alligator indicator crossed the signal line downwards, and the AO oscillator histogram fell into the sell zone, where it is now, forming new downwards bars.

jnj.png
 
ge-forum-1.png


Global sideways correction in the shares of the American diversified corporation General Electric Co. strengthens, and quotes are traded around 78.

On the daily chart of the asset, a wide downward channel is forming with dynamic boundaries of 70 – 88, inside which the price reached the support line and formed a new low of the year around 71.

On the four-hour chart, the instrument starts forming a reversal formation, which so far looks like a local corridor. The prospect of upward dynamics and reaching the global resistance line at 87 is a priority, which is confirmed by the readings of technical indicators: fast EMAs on the Alligator indicator are actively approaching the signal line, narrowing the range of fluctuations, and the AO oscillator histogram is forming upward bars, almost reaching the transition level.

ge.png
 
dax-forum-1.png


Weak statistics put pressure on the stock market
DAX 30 is correcting upwards trading at 14592 ahead of what could be the most productive European Central Bank's (ECB) meeting in 8 years.

High annual inflation, recorded in April at around 7.5%, is forcing officials to move to tighten monetary policy, the first step towards which can be taken tomorrow. According to preliminary statements by the President of the regulator, Christine Lagarde, a complete cessation of the asset purchase program may be announced, and the question of raising the interest rate from –0.50% to a positive value may also be raised. The indicator was last updated in July 2011. According to Lagarde, these measures are necessary to curb the rapid growth in consumer prices, which could exceed the 9% barrier as early as June.

In turn, macroeconomic statistics remain negative, putting pressure on the stock market. According to data for April, the volume of Factory Orders in Germany decreased by 2.7% against an expected increase of 0.3%, and the Construction PMI fell to 45.4 points from 46.0 points a month earlier.

dax.png


On the global chart of the asset, the price continues to implement the local Flag pattern, gradually moving away from the resistance line. Technical indicators maintain a steady buy signal: fast EMAs on the Alligator indicator are actively moving away from the signal line, expanding the range of fluctuations, and the AO oscillator histogram, having moved into the buy zone, forms ascending bars.

Support levels: 14350, 13540 | Resistance levels: 14836, 15710​
 
Back
Top