Daily Analysis

1705057950637.png


1705057950661.png

EUR/USD Holds Near Median Line with Data Uncertainty
The EUR/USD is hovering around the median line without a clear direction after yesterday's data. Today's PPI data may provide more direction. The next resistance level is at 1.1000, while the support level is close to 1.0850.

Resistance 3 Resistance 2 Resistance 1 Support 1 Support 2 Support 3
1.1200 1.1100 1.1000 1.0900 1.0850 1.0750

1705057950678.png

GBP/USD Approaches 1.2800 Resistance, Correction May Target 1.2630
The GBP/USD currency pair came close to the resistance level of 1.2800. Data from yesterday didn’t support a breakout or a correction as uncertainty continues. If prices break out, they may reach the next target of 1.2930. However, if there is a correction, prices may fall back to 1.2630.

Resistance 3 Resistance 2 Resistance 1 Support 1 Support 2 Support 3
1.2930 1.2800 1.2700 1.2650 1.2500 1.2400

1705057950692.png


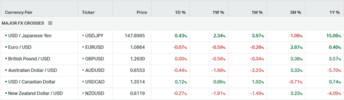
USD/JPY Faces 50MA Resistance, Undergoes Slight Correction
The USD/JPY encountered resistance from the 50MA and is currently undergoing a slight correction. There is no confirmation yet of a clear direction for the pair, but the next support level is at 144.00. As the fundamentals decline, the yen may weaken further, while the direction of the pair will also depend on the dollar.

Resistance 3 Resistance 2 Resistance 1 Support 1 Support 2 Support 3
155.00 152.00 148.30 145.00 144.80 140.00

1705057950707.png


Gold Prices Rebound on Treasury Yield Dip, Decline May Test 2006 Support
Today, gold prices bounced back following a drop in the treasury yield. If the rebound is sustained, the next resistance level will be at 2050. However, if prices continue to fall, the next support level will be at 2006.

Resistance 3 Resistance 2 Resistance 1 Support 1 Support 2 Support 3
2140 2090 2050 2032 2006 1979

1705057950723.png


WTI Rises as 50MA Poses Temporary Challenge, Bearish Trend Prevails

WTI is moving up today following the geopolitical tension in the Middle East where the 50MA may be temporarily a challenge for the price. The resistance area is between 74 and 76, while support is at 68. The trend is currently bearish.

Resistance 3 Resistance 2 Resistance 1 Support 1 Support 2 Support 3
81 78 74 70 68 64.9
 

Attachments

  • 1705057950621.png
    1705057950621.png
    19.5 KB · Views: 1
  • 1705057950597.png
    1705057950597.png
    40.8 KB · Views: 1
  • 1705057950610.png
    1705057950610.png
    30.1 KB · Views: 1
1705319470469.png

1705319470484.png

EUR/USD Uncertainty Continues, Eyes the 1.1000 Resistance Level
The EUR/USD continues to hover around the median line without a clear direction after last week's data. This week's data may give more direction for the pair. The next resistance level is at 1.1000, while the support level is close to 1.0850.

Resistance 3 Resistance 2 Resistance 1 Support 1 Support 2 Support 3
1.1200 1.1100 1.1000 1.0900 1.0850 1.0750

1705319470501.png

GBP/USD Still Unclear with Correction Possibility
The GBP/USD currency pair found resistance at 1.2800 the direction is still unclear while the market is still uncertain. If prices break out, they may reach the next target of 1.2930. However, if there is a correction, prices may fall back to 1.2630.

Resistance 3 Resistance 2 Resistance 1 Support 1 Support 2 Support 3
1.2930 1.2800 1.2700 1.2650 1.26501.2650
1705319470528.png

USD/JPY Pair Unclear as Fundamentals Deteriorate
The USD/JPY encountered resistance from the 50MA and is building a reversal in the short term. There is no confirmation yet of a clear direction for the pair, but the next support level is at 144.80. As the fundamentals deteriorate, the yen may weaken further, while the direction of the pair will also depend on the Dollar.

Resistance 3 Resistance 2 Resistance 1 Support 1 Support 2 Support 3
155.00 152.00 148.30 144.80 144.00 142.00

1705319470549.png


Gold; Safe Haven Amidst Geopolitical Tensions
Gold is benefiting from geopolitical tensions increasing the heaven gold appeal. If the trend continues the next target will be 2070, Conversely, if the prices come back declining, the next support level is in 2032.

Resistance 3 Resistance 2 Resistance 1 Support 1 Support 2 Support 3
2140 2090 2070 2032 2006 1979

1705319470564.png


Oil Prices Face a Challenge with 50MA, Trend Bearish
The 50-day moving average (50MA) poses a challenge for the price, as it could potentially lead to a reversal. Meanwhile, the path of the oil price remains uncertain. Currently, the resistance area is between 74 and 76, with support found at 68. The trend is currently bearish in an accumulation phase.

Resistance 3 Resistance 2 Resistance 1 Support 1 Support 2 Support 3
81 78 74 70 68 64.9
 

Attachments

  • 1705319470430.png
    1705319470430.png
    37.5 KB · Views: 1
  • 1705319470454.png
    1705319470454.png
    19.3 KB · Views: 1
  • 1705319470443.png
    1705319470443.png
    28.5 KB · Views: 1
1705397911508.png

1705397911525.png

EUR/USD Declines, Eyes 200MA at 1.0850 with Dollar Strength
The EUR/USD is currently experiencing a decline, breaching the median line. Although the 50-day moving average (50MA) could serve as a transient support level, the focus is now on the 200-day moving average (200MA) with a target set at 1.0850. The main force driving this movement is the strength of the dollar.

Resistance 3 Resistance 2 Resistance 1 Support 1 Support 2 Support 3
1.1200 1.1100 1.1000 1.0900 1.0850 1.0750

1705397911542.png

GBP/USD Corrects to 1.2600, Eyes 50MA Support
The GBP/USD currency pair is correcting toward 1.2600 where the 50MA also is placed while the 1.2540 is the strong next support with the 200MA. The long bullish tends to remain strong and the correction can be temporary.

Resistance 3 Resistance 2 Resistance 1 Support 1 Support 2 Support 3
1.2930 1.2800 1.2700 1.2600 1.2500 1.2400

1705397911564.png


USD/JPY Gains Momentum, Approaches 147.40 Resistance
The USD/JPY is on an upward trajectory, supported by the resilience of the dollar and the yen's weakness. The pair is advancing towards the upcoming resistance, situated at both the upper parallel of the downtrend and the 100-day moving average at 147.40.

Resistance 3 Resistance 2 Resistance 1 Support 1 Support 2 Support 3
155.00 152.00 147.40 145.00 144.80 140.00
1705397911584.png


Gold Correction Following Strong Dollar and Rising Yields
Gold is currently influenced by the strength of the dollar and rising treasury yields, undergoing a correction from its recent level of 2056. While this correction may be temporary, the next support level is expected to be 2036, signaling a potential stabilization point for the precious metal.

Resistance 3 Resistance 2 Resistance 1 Support 1 Support 2 Support 3
2140 2090 2070 2036 2006 1979

1705397911598.png


Stable Oil Prices with Uncertain Fundamentals and Geopolitical Tensions

Over the last three days, oil prices have remained stable without showing any significant movements. The uncertain fundamentals of the oil market and the geopolitical tensions have made the market picture unclear and blurred. Currently, the resistance level is at 50MA, while the support level stands at 70.

Resistance 3 Resistance 2 Resistance 1 Support 1 Support 2 Support 3
81 78 74 70 68 64.9
 

Attachments

  • 1705397911480.png
    1705397911480.png
    27.9 KB · Views: 1
  • 1705397911469.png
    1705397911469.png
    38.8 KB · Views: 1
  • 1705397911491.png
    1705397911491.png
    19.2 KB · Views: 1
1705480868161.png


1705480868178.png

EUR/USD Support at 1.0850, Key Data and Events Awaited
The EUR/USD is currently nearing the support level of 1.0850. Although a rebound from this support is possible, today's important data and events may impact its direction. If a breakout continues, then the next target would be 1.0800, while the next resistance level is at 1.0920.

Resistance 3 Resistance 2 Resistance 1 Support 1 Support 2 Support 3
1.1100 1.1000 1.0920 1.0850 1.0800 1.0750

1705480868192.png

GBP/USD Holds Firm at 1.2600 with Potential Direction to 1.2700
The GBP/USD found support at the 1.2600 at the 50MA. A rebound may lead the price to 1.2700, while a breakout below the 50MA could find support at 1.2540.

Resistance 3 Resistance 2 Resistance 1 Support 1 Support 2 Support 3
1.2930 1.2800 1.2700 1.2600 1.2500 1.2400
1705480868207.png


Yen Faces Continued Downward Pressure while USD/JPY Strengthens
The dollar has gained strength against the yen, with USD/JPY on the rise, aiming for the next target at 148.35. The yen's downward trajectory may persist, as current fundamentals do not favor the currency.

Resistance 3 Resistance 2 Resistance 1 Support 1 Support 2 Support 3
152.00 150.00 148.35 146.50 144.80 144.00
1705480868224.png


Gold Prices React to USD Strength and Yields, 50MA Support Crucial
Gold prices are currently being affected by the strength of the US dollar as well as rising treasury yields. Currently, it is at the 50MA support level and whether the correction will continue or not depends on today's economic calendar. If it continues to decline, the price is expected to drop towards the 2006 support level, while a comeback will push the price towards 2056 as the next target.

Resistance 3 Resistance 2 Resistance 1 Support 1 Support 2 Support 3
2090 2070 2056 2021 2006 1979


1705480868240.png

Oil Still Uncertain with Modest Movements, Support at 70
Oil lacks clear direction, displaying modest fluctuations following recent losses over the past two days. The next support stands at the 70 level, with an uncertain overall outlook and unpredictable market movements.

Resistance 3 Resistance 2 Resistance 1 Support 1 Support 2 Support 3
81 78 74 70 68 64.9
 

Attachments

  • 1705480868126.png
    1705480868126.png
    28.8 KB · Views: 1
  • 1705480868146.png
    1705480868146.png
    20.8 KB · Views: 1
  • 1705480868114.png
    1705480868114.png
    41.1 KB · Views: 1
1705571169882.png

1705571169903.png

EUR/USD Rebounds with Support at Key Levels
The EUR/USD has garnered support from both the 200MA and the 1.0850 level, currently showing signs of a rebound. The trajectory of this rebound may be influenced by today's data, potentially paving the way for either a sustained recovery or a breakout. The next support is at 1.0800 and the next resistance is at 1.0900.

Resistance 3 Resistance 2 Resistance 1 Support 1 Support 2 Support 3
1.1100 1.1000 1.0900 1.0850 1.0800 1.0750

1705571169917.png

GBP/USD Eyes the 1.2800 Level After Meeting Expectations
The GBP/USD discovered support at the 1.2600 level with 50MA. As anticipated, the rebound propelled the price back towards 1.2700. If this upward momentum persists, the next target stands at 1.2800.

Resistance 3 Resistance 2 Resistance 1 Support 1 Support 2 Support 3
1.3100 1.2930 1.2800 1.2600 1.2500 1.2400
1705571169935.png


USD/JPY Faces Resistance at 148.35, Eyes 146.50
The USD/JPY pair encountered resistance at 148.35, as predicted. The next support is at 146.50. If a breakout occurs, the next target is 150.00.
Resistance 3 Resistance 2 Resistance 1 Support 1 Support 2 Support 3
152.00 150.00 148.35 146.50 144.80 144.00

1705571169950.png


Gold Nears Support at 2006 with Yields and Dollar Pressure
Gold is currently trading at a support level of 2006. The recent rise in yields and the value of the dollar have had a negative impact on gold. However, gold will likely rebound from this support level. If gold does break out of this support level, the next target will be 1979.

Resistance 3 Resistance 2 Resistance 1 Support 1 Support 2 Support 3
2070 2056 2021 2006 1979 1960


1705571169965.png


Oil Displays Ambiguous Pattern, Next Resistance at 50MA
Oil is exhibiting an unclear pattern with low probability projections. The next support is at 70, while the resistance is at 50MA.

Resistance 3 Resistance 2 Resistance 1 Support 1 Support 2 Support 3
81 78 74 70 68 64.9
 

Attachments

  • 1705571169852.png
    1705571169852.png
    28.9 KB · Views: 1
  • 1705571169840.png
    1705571169840.png
    39.8 KB · Views: 1
  • 1705571169863.png
    1705571169863.png
    20.8 KB · Views: 1
US Indices
1705582272288.png


Futures tied to the S&P 500 gained 0.4%, while those linked to the Nasdaq-100 advanced 0.7%. Apple shares saw an increase of over 1% in premarket trading after Bank of America upgraded the stock to 'buy', predicting more than a 20% upside over the next 12 months. Investors are concerned that a strong December retail sales report, indicative of a robust consumer base, could lead to fewer rate cuts from the Federal Reserve than previously anticipated. Currently, markets are pricing in about a 56% chance of a quarter-percentage-point rate cut in March. In terms of economic indicators, weekly jobless claims, housing starts, and building permits data are scheduled for release Thursday morning. Additionally, Atlanta Fed President Raphael Bostic is set to speak.
In the premarket, U.S.-listed shares of Taiwan Semiconductor Manufacturing (TSMC) are leading gains among chipmakers with a 4.9% rise. This follows the world's largest contract semiconductor maker's report of upbeat quarterly profit and a projection of upwards of 20% revenue growth, driven by demand for artificial intelligence chips. Other chipmakers like Nvidia, Microchip Technology, and Intel saw increases ranging between 0.2% and 3.5%.
While the Nasdaq and other major U.S. indices are under pressure, today the Nasdaq may see a rebound, supported by these fundamentals. Generally, the Nasdaq is experiencing uncertainty as the bullish trend pauses, and the shift in market sentiment could be negative for the index.


Crypto
1705582272307.png


The Bitcoin price has remained stagnant in recent days, leaving investors and analysts searching for reasons behind this trend. Three key factors are contributing to Bitcoin's current sideways trading:
Spot Bitcoin ETFs, particularly Grayscale's GBTC, have been a major focus in the market. While ETF inflows continue to break records, the Bitcoin price has not seen significant gains. This is partially due to outflows from GBTC, which is considered overpriced with a 1.5% annual fee compared to 0.25% by other issuers. Thomas Fahrer of Apollo highlighted the flow discrepancies, and there is an expectation that Grayscale outflows may reduce over time as investors shift to other Bitcoin exposures.
On-chain data suggests that Bitcoin miners have increased their selling activity, which is contributing to the price stagnation. This behaviour aligns with historical trends where miners sell to manage cash flow or capitalize on price increases during market rallies.
Following the excitement around Bitcoin ETFs, which led to an 82% rally, the market is now in a consolidation phase. This phase is considered natural and resembles patterns seen in other markets, like the first gold ETF. It may take some time before asset managers' marketing efforts and new institutional investors fully embrace this new asset class.
Bitcoin has entered a period of tight price range after hitting $47,000. The trend is bullish, but reaching the upper parallel of the channel could lead to further correction.
 
1705661851852.png


1705661851869.png

The EUR/USD Support Hovers Around 200MA
The EUR/USD continues hovering around the support at the 200MA and the 1.0850 and rebounding at the moment. The next support is at 1.0800 and the next resistance is at 1.0900.

Resistance 3 Resistance 2 Resistance 1 Support 1 Support 2 Support 3
1.1100 1.1000 1.0900 1.0850 1.0800 1.0750

1705661851884.png

GBP/USD Faces Selling Pressure Today
The GBP/USD rebounded after the 1.2600 support level, reaching the 50-day moving average (50MA). However, today the pair is experiencing selling pressure following the release of retail sales data. The next resistance if the rebound continues is at 1.2800 while the 50MA will be the next support.

Resistance 3 Resistance 2 Resistance 1 Support 1 Support 2 Support 3
1.3100 1.2930 1.2800 1.2600 1.2500 1.2400
1705661851902.png


USD/JPY Still Muted on the Second Day

The USD/JPY pair remained unchanged for the second day at the 148.35 resistance level. The next support is at 146.50. If a breakout occurs, the next target is 150.00.

Resistance 3 Resistance 2 Resistance 1 Support 1 Support 2 Support 3
152.00 150.00 148.35 146.50 144.80 144.00

1705661851925.png


Gold Rebounds as Bearish Trend Goes Down
Gold is rebounding after the 2006 played support and the next resistance level is at 2052 while the short-term bearish trend is forming a down channel.

Resistance 3 Resistance 2 Resistance 1 Support 1 Support 2 Support 3
2070 2052 2021 2006 1979 1960

1705661851943.png


Oil: A Possible Reversal?
Oil has broken the 50MA and is rebounding towards the next target at 78. The down-long trend indicates a possible reversal.

Resistance 3 Resistance 2 Resistance 1 Support 1 Support 2 Support 3
81 78 74 70 68 64.9
 

Attachments

  • 1705661851827.png
    1705661851827.png
    30.9 KB · Views: 1
  • 1705661851837.png
    1705661851837.png
    20.7 KB · Views: 1
  • 1705661851814.png
    1705661851814.png
    41 KB · Views: 1
1705930965500.png

1705930965527.png

EUR/USD Hovers Around 200MA for the Fourth Session
The EUR/USD continues hovering for the fourth session around the support at the 200MA and the 1.0850 and rebounding at the moment. The next support is at 1.0800 and the next resistance is at 1.0900.

Resistance 3 Resistance 2 Resistance 1 Support 1 Support 2 Support 3
1.1100 1.1000 1.0900 1.0850 1.0800 1.0750

1705930965545.png

GBP/USD Silently Awaits the Week’s Data
The GBP/USD is quiet today. The next move will depend on this week's data and market sentiment. The next resistance if the rebound continues is at 1.2800 while the 50MA will be the next support.

Resistance 3 Resistance 2 Resistance 1 Support 1 Support 2 Support 3
1.3100 1.2930 1.2800 1.2600 1.2500 1.2400

1705930965561.png


USD/JPY Muted at the 148.35 Resistance
The pair continued for their third day, muted at the 148.35 resistance level. The next support is at 146.50. If a breakout occurs, the next target is 150.00.

Resistance 3 Resistance 2 Resistance 1 Support 1 Support 2 Support 3
152.00 150.00 148.35 146.50 144.80 144.00

1705930965579.png


Gold Resists at 200MA, Eyes 2006
Gold found resistance at the 200MA on a 4H chart and came back where the short-term bearish trend is still active. If it continues its downward trajectory, the next level is again will be at 2006.

Resistance 3 Resistance 2 Resistance 1 Support 1 Support 2 Support 3
2070 2052 2021 2006 1979 1960

1705930965595.png


Uncertainty Continues for Oil at 50MA
Geopolitical tensions continue to impact oil prices, leaving future projections uncertain. The 50MA still holds as resistance.

Resistance 3 Resistance 2 Resistance 1 Support 1 Support 2 Support 3
81 78 74 70 68 64.9
 

Attachments

  • 1705930965459.png
    1705930965459.png
    54.5 KB · Views: 1
  • 1705930965472.png
    1705930965472.png
    37.2 KB · Views: 1
  • 1705930965484.png
    1705930965484.png
    24.9 KB · Views: 1
1706018741410.png

1706018741438.png

EUR/USD Maintains Position Near 200MA Support at 1.0850
EUR/USD, rebounding currently, continues hovering around the support at the 200MA again with the 1.0850 level. The next support is at 1.0800 and the next resistance is at 1.0900.

Resistance 3 Resistance 2 Resistance 1 Support 1 Support 2 Support 3
1.1100 1.1000 1.0900 1.0850 1.0800 1.0750

1706018741459.png

Pound Sterling Gains Momentum with Slight Restraint
The GBP/USD is increasing today but is slightly limited. The next move will depend on this week's economic data and market sentiment. The next resistance level is at 1.2800 while the 50MA will act as the next support if the rebound continues.

Resistance 3 Resistance 2 Resistance 1 Support 1 Support 2 Support 3
1.3100 1.2930 1.2800 1.2600 1.2500 1.2400

1706018741479.png


USD/JPY Retreats from 148.35 Resistance Post-BoJ Meeting
The USD/JPY pair came back from the resistance at 148.35 after today's BoJ meeting. The next support is at 146.50 and if a breakout occurs, the next target is 150.00.

Resistance 3 Resistance 2 Resistance 1 Support 1 Support 2 Support 3
152.00 150.00 148.35 146.50 144.80 144.00

1706018741501.png


Gold Faces Resistance at 200MA, Extends Short-Term Bearish Trend
Gold continued finding resistance at the 200MA on a 4H chart and came back where the short-term bearish trend is still active. The next level will be at 2006 again if it continues its downward course.

Resistance 3 Resistance 2 Resistance 1 Support 1 Support 2 Support 3
2070 2052 2021 2006 1979 1960

1706018741520.png


Geopolitical Tensions Increases Volatility in Oil Prices
Geopolitical tensions create volatility in oil prices again, leaving future projections uncertain. The 50MA seems still holding as resistance.

Resistance 3 Resistance 2 Resistance 1 Support 1 Support 2 Support 3
81 78 74 70 68 64.9
 

Attachments

  • 1706018741345.png
    1706018741345.png
    40.5 KB · Views: 1
  • 1706018741380.png
    1706018741380.png
    17.9 KB · Views: 1
  • 1706018741364.png
    1706018741364.png
    28.6 KB · Views: 1
1706104685856.png

1706104685874.png

EUR/USD Holds Steady at 200MA Support, Awaits Data for Next Move
The EUR/USD pair maintains its position near the 200MA support at 1.0850, in a holding pattern as it awaits today's data developments to determine its next direction. The next support is at the 1.0800 level, with resistance at 1.0900 on the horizon.

Resistance 3 Resistance 2 Resistance 1 Support 1 Support 2 Support 3
1.1100 1.1000 1.0900 1.0850 1.0800 1.0750

1706104685890.png

GBP/USD Sees Incremental Gains Today with Some Constraints
GBP/USD experienced gains today but faces mild constraints, with the upcoming move dependent on today's economic data and market sentiment. Although the current pattern somewhat resembles a descending triangle, the likelihood remains low. If the rebound persists, the next resistance is at 1.2800, with the 50MA serving as the next support.

Resistance 3 Resistance 2 Resistance 1 Support 1 Support 2 Support 3
1.3100 1.2930 1.2800 1.2600 1.2500 1.2400
1706104685906.png


USD/JPY Eyes 146.50 Support with Yen Strength Limited
The uncertainty persists for the USD/JPY pair near the 148.35 resistance following the recent BoJ meeting, with the Yen displaying limited strength. The next support lies at 146.50, and in the event of a breakout, the next resistance is set at 150.00.

Resistance 3 Resistance 2 Resistance 1 Support 1 Support 2 Support 3
152.00 150.00 148.35 146.50 144.80 144.00

1706104685933.png


Gold Maintains Short-Term Bearish Trend Following Market Uncertainty
Uncertainty in the market is affecting gold, keeping it in proximity to both the 50MA and the 200MA on a 4-hour chart. The short-term bearish trend is still active. If it continues down the next levels again at the 2006.

Resistance 3 Resistance 2 Resistance 1 Support 1 Support 2 Support 3
2070 2052 2021 2006 1979 1960


1706104685952.png


Oil Influenced by Ongoing Tensions, Remains Muted

Oil remains in a state of uncertainty, exhibiting volatile movements with no clear direction established, influenced by economic uncertainty and geopolitical tensions. The next resistance looms near 78, closely tied to the 200MA, while support rests at 70.

Resistance 3 Resistance 2 Resistance 1 Support 1 Support 2 Support 3
81 78 74 70 68 64.9
 

Attachments

  • 1706104685839.png
    1706104685839.png
    20 KB · Views: 1
  • 1706104685820.png
    1706104685820.png
    30.6 KB · Views: 1
  • 1706104685802.png
    1706104685802.png
    42.1 KB · Views: 1
Back
Top