You are using an out of date browser. It may not display this or other websites correctly.
You should upgrade or use an alternative browser.
You should upgrade or use an alternative browser.
Daily Analysis
- Thread starter Zforex
- Start date
-
- Tags
- daily analysis
Zforex
zForex.com Representative
- Messages
- 30
On Wednesday, Asia-Pacific markets experienced mostly positive gains as investors digested the better-than-expected results from Wall Street. The earnings season had a strong start, with 84% of S&P 500 companies surpassing profit estimates, according to FactSet.
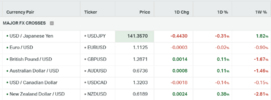
In Japan, the Nikkei 225 rose by 1.07%, and the Topix increased by 0.96%. However, business sentiment among manufacturers in Japan declined for the first time in six months in July, according to the Reuters Tankan survey, which measures confidence among large Japanese companies. The survey also indicated a decrease in confidence among large Japanese manufacturers. This decline is significant as it is the first time in six months that the index has recorded a negative change, with the manufacturing index dropping from +8 in June to +3.
Meanwhile, New Zealand's consumer price index showed a year-on-year growth of 6%, marking the second consecutive quarter of slowing inflation. This figure is lower than the 6.7% recorded in the first quarter and the 7.2% in the fourth quarter of 2022.
Futures saw an increase following the release of the U.K. consumer price index figures, which showed an annual headline inflation rate of 7.9%. This rate was lower than the consensus forecast of 8.2% and a decrease from May's 8.7%. The core consumer price index was 6.9%, also below the estimated 7.1% stability.
ASML, a Netherlands-based semiconductor equipment producer, reported a net profit of 1.9 billion euros ($2.131 billion) in the second quarter. This figure was higher than the previous year's 1.4 billion euros and exceeded analyst expectations of 1.82 billion euros. Additionally, the company raised its full-year sales growth forecast from 25% to 30%.
In the U.S., Goldman Sachs will report earnings before the market opens, while Netflix, Tesla, IBM, and United Airlines will announce their earnings after the market closes.
Investors will closely monitor the inflation data for the eurozone, which is expected to be released later on Wednesday. European bonds experienced gains after Klaas Knot, a member of the European Central Bank Governing Council, stated that monetary tightening beyond the upcoming meeting is uncertain.
Zforex
zForex.com Representative
- Messages
- 30
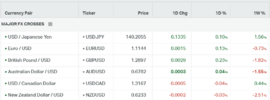
ERUUSD
The US Retail Sales data had a mixed impact on the greenback's performance against major currencies. While the headline figures showed a slight decrease, the Retail Sales Control Group exceeded expectations. The DXY has been sluggish, allowing the EUR/USD pair to take a break from its multi-month high. Meanwhile, European Central Bank (ECB) member Klaas Knot suggested that rate hikes beyond July are likely but uncertain. EU Commissioner Paolo Gentiloni stated that Eurozone inflation is expected to reach the 2% target in 2024, earlier than the ECB's forecast. The market's risk-on mood, positive US bank performance, and favorable news on China supported the EUR/USD price. However, US Treasury bond yields remained under pressure.
The EUR/USD shows a concentration of price signaling a correction on Builth, with the target expected to be the 1.1150 level, followed by the 1.1100 level. Additionally, the daily chart reveals three Dojis, confirming the possibility of a correction.
| Resistance 3 | Resistance 2 | Resistance 1 | Support 1 | Support 2 | Support 3 |
| 1.1400 | 1.1300 | 1.1250 | 1.1200 | 1.1500 | 1.1000 |
GBPUSD
UK inflation in June showed a significant cooling, falling below consensus expectations at an annual rate of 7.9%. Economists had anticipated a higher rise of 8.2% based on the previous month's reading of 8.7%, indicating that price increases are still well above the Bank of England's target of 2%. On a monthly basis, the headline consumer price index rose by only 0.1%, lower than the expected 0.4%. Core inflation, excluding volatile items, remained high at an annualized rate of 6.9% but decreased from the 31-year high of 7.1% seen in May. The Office for National Statistics attributed the drop in the annual CPI rate to declining motor fuel prices, while food prices experienced a smaller increase compared to the same period last year.
The GBP/USD is currently undergoing a correction toward the support level of 1.3000. However, this correction has been more substantial than anticipated, and it is pushing the pair toward the lower support level of 1.2850.
| Resistance 3 | Resistance 2 | Resistance 1 | Support 1 | Support 2 | Support 3 |
| 1.3310 | 1.3200 | 1.3000 | 1.2650 | 1.2540 | 1.2460 |
USDJPY
The Yen pair is reflecting concerns about the Bank of Japan's dovish stance while ignoring downbeat Treasury bond yields and discussions about the US Federal Reserve's potential pause in rate hikes. The market is significantly influenced by mixed news about China's economy and overall optimism in equity markets. China's Industry Ministry expressed fears of insufficient demand and declining revenues, impacting commodity prices. US banks anticipate increased profits from higher rates, supporting sentiment. Bank of Japan Governor Kazuo Ueda defended easy-money policies. Concerns about Japan's cabinet reshuffle and pessimism among Tokyo's industrial players weigh on the Japanese Yen, favoring USD/JPY bulls.
USDJPY is undergoing a correction, similar to other major currency pairs. It has tested the 137.7 level twice, forming a double bottom pattern. The next resistance levels to watch for are approximately 140.225 and 141.50.
| Resistance 3 | Resistance 2 | Resistance 1 | Support 1 | Support 2 | Support 3 |
| 142.00 | 141.20 | 140.22 | 139.00 | 138.00 | 136.00 |
The previous day saw an improvement in sentiment due to US banks expecting increased profits from higher interest rates. Concerns about the Federal Reserve's policy shift after a 0.25% rate increase in July also contributed to the positive mood and boosted the price of XAU/USD. However, the positive details of US Retail Sales and expectations of the Fed maintaining higher rates for a longer period, possibly without announcing many rate hikes, have recently exerted downward pressure on the gold price.
In other news, China's Industry Ministry recently expressed concerns about insufficient demand and declining revenues, providing justification for the downbeat Gross Domestic Product (GDP) data in the second quarter (Q2). These concerns raised fears about a slowdown in the economic recovery of the world's largest industrial player. Given China's significant consumption of oil, pessimism regarding the nation's economic outlook has weighed on commodity prices.
Gold experienced a correction, pulling its price back toward the 1972 level after reaching a new high since June. The next support levels to watch are at 1970 and 1964. However, if yields continue to decrease, gold may resume its upward movement, and a potential breakout above the current resistance level at 1985 could lead to further gains toward the 2000 level.
| Resistance 3 | Resistance 2 | Resistance 1 | Support 1 | Support 2 | Support 3 |
| 1982 | 1970 | 1960 | 1931 | 1920 | 1904 |
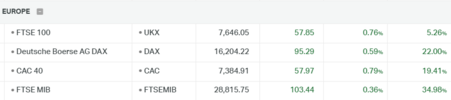
DAX40
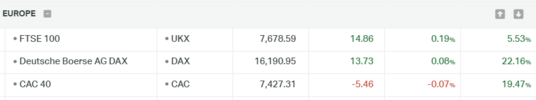
European shares experienced an increase on Wednesday, supported by positive news related to Kering and other notable companies. Kering saw a significant rise of 6.5% after announcing Jean-Francois Palus as the new CEO and president of Gucci during a transitional period, replacing Marco Bizzarri who will depart on September 23.
In addition, Dutch semiconductor equipment maker ASML reported better-than-expected second-quarter net profit of 1.9 billion euros ($2.13 billion) and raised its full-year sales forecasts. Handelsbanken and AB Volvo, both based in Sweden, also provided encouraging updates. Furthermore, Renault attracted attention following reports from Reuters that Nissan and the French carmaker are expected to make an announcement in the coming days regarding their restructured alliance.
The DAX came back toward the 16,200 level. In the short term, the DAX remains bullish due to the prevailing risk-on sentiment in the markets, Q2 earnings started positive and better than expected which may help the Dax reach the last high at 16400.
| Resi Level 3 | Resi Level 2 | Resi Level 1 | Suppo level 1 | Suppo level 2 | Suppo level 3 |
| 16800 | 16600 | 16370 | 15650 | 15400 | 15200 |
Attachments


Zforex
zForex.com Representative
- Messages
- 30
Eurozone's underlying inflation, a crucial indicator of price increases monitored by the European Central Bank, showed a stronger acceleration than initially reported in June. This development further cements the widely anticipated interest-rate increase expected to take place next week.
According to Eurostat's report on Wednesday, core consumer prices, which exclude volatile elements like food and energy, rose by 5.5% compared to the previous year. This figure is slightly higher than the preliminary estimate of 5.4% and the reading of 5.3% recorded in May.
The main gauge of inflation, which stands at 5.5%, has been confirmed. This rate is the lowest since before Russia's invasion of Ukraine. Economists surveyed by Bloomberg predict that underlying price growth will continue to exceed the overall inflation rate until the end of 2024.
While headline inflation has significantly decreased from its peak of 10.6% in October, policymakers are now focusing on the narrower measure, which is proving more resistant to decline. The upward revision on Wednesday could provide support for ECB members who advocate for further rate hikes into the fall. However, some officials have recently adopted a more cautious stance.
Zforex
zForex.com Representative
- Messages
- 30
Japan Surprises with Trade Surplus, China Maintains Rates, Property Sector Sees Respite
Asia-Pacific markets were mixed on Thursday as investors digested a slew of economic data across the region.
Japan’s Nikkei 225 was down 0.97%, while the Topix was 0.5% lower as the country posted a surprise trade surplus of 43 billion yen ($308 million), its first surplus in 23 months.
China kept its one and five-year loan prime rates unchanged, days after China’s second quarter GDP came in below expectations. China’s major state-owned banks were seen selling dollars to buy yuan in the offshore spot market in early trades on Thursday.
China’s efforts to revive growth, from cutting rates to closing out a regulatory crackdown on tech firms, have so far done little to support growth in the world’s second-largest economy. However, some relief surfaced for the property sector as Chinese authorities reportedly considered easing home buying restrictions in major cities, leading to a rise in shares of developers.
Australia’s seasonally adjusted unemployment rate remained unchanged at 3.5% in June, slightly lower than the 3.6% expected by economists polled by Reuters.
European markets are set for a muted open on Thursday as investors assess the implications of some big U.S. corporate results and the start of earnings season at home.
German producer prices rose by 0.1% year on year in June, the federal statistics office said Thursday, slightly exceeding analyst expectations of no annual change.
Today, economic data for the US will be released, including the Initial Jobless Claims and the Philadelphia Fed Manufacturing PMI.
EURUSD
The German producer prices recorded a year-on-year increase of 0.1% in June, according to the Federal Statistical Office's report on Thursday. This figure slightly exceeded the expectations of analysts, who were anticipating no change in annual prices. Additionally, recent data on CPI for the EU, as well as Germany, indicates that inflation remains persistent, particularly in the core measure, which rose to 5.5% in June from 5.3% in May. As a result, the ECB will likely implement another rate increase in its upcoming meeting.
Yesterday's reports on both building permits and housing starts in the US for June fell below expectations, raising concerns about a possible slowdown in the housing market. Moreover, today's release of the Philadelphia Fed Manufacturing Index and Initial Jobless Claims will provide insights into the current state of the labor market, which appears to be steady, and the manufacturing activity, which seems to be showing signs of slowing down.
The EUR/USD has shown a concentration of price and formed a bearish pattern, signaling a potential correction. The target for this correction is expected to be the 1.1150 level, followed by the 1.1100 level. Additionally, on the daily chart, we can observe 3 Dojis, further confirming the likelihood of a correction.
| Resistance 3 | Resistance 2 | Resistance 1 | Support 1 | Support 2 | Support 3 |
| 1.1400 | 1.1300 | 1.1250 | 1.1200 | 1.1500 | 1.1000 |
GBPUSD
In the UK, the Consumer Price Index (CPI) rose slightly below expectations, indicating softer inflation. This could influence the Bank of England (BoE) to consider a smaller rate hike in the upcoming policy meeting. In the US, Housing Starts declined in June, and Building permits also saw a drop, leading to speculations that the Federal Reserve (Fed) might adopt a more dovish policy stance. Investors are closely watching upcoming data, including Unemployment Claims and Retail Sales in the US, as well as Flash Manufacturing and Services PMI figures from both countries, which will impact the GBP/USD pair's direction.
The GBP/USD is continuing its correction towards the 1.2850 support level. A first rejection of this level has occurred, and a breakout may lead the price toward the next target of 1.2750.
The GBP/USD is continuing its correction towards the 1.2850 support level. A first rejection of this level has occurred, and a breakout may lead the price toward the next target of 1.2750.
| Resistance 3 | Resistance 2 | Resistance 1 | Support 1 | Support 2 | Support 3 |
| 1.3310 | 1.3200 | 1.3000 | 1.2850 | 1.2750 | 1.2650 |
USDJPY
The Japanese government has recently announced a downward revision of the growth forecasts for the Asian major's Financial Year (FY) 2023-24. According to policymakers in Tokyo, they now anticipate the FY 2023-24 growth to be 1.3%, as opposed to the previously expected 1.5%.
On a different note, Japan's trade figures for June revealed a positive Merchandise Trade Balance Total, despite a decrease in Imports and encouraging figures for Exports.
In addition, Japan's Prime Minister (PM) Fumio Kishida has defended the Bank of Japan (BoJ) against dovish concerns by expressing readiness to create a society where wage hikes become the norm.
It's noteworthy that the US Treasury bond yields reflect mixed concerns about the Federal Reserve (Fed), even with the widely expected July rate hike.
USDJPY is undergoing a correction, similar to other major currency pairs. It has tested the 137.7 level twice, forming a double bottom pattern. The next resistance levels to watch for are approximately 140.225 and 141.50.
Resistance 3 | Resistance 2 | Resistance 1 | Support 1 | Support 2 | Support 3 |
| 142.00 | 141.20 | 140.22 | 139.00 | 138.00 | 136.00 |
XAUUSD
The markets have recently adjusted their expectations, and now it appears that the possibility of further interest rate hikes by the Federal Reserve (Fed) is being priced out. This shift in sentiment follows the expected 25 basis points (bps) increase in July and is a response to a decrease in inflationary pressures. Investors now believe that the Fed is approaching the end of its current policy tightening, which has contributed to a significant decline in US Treasury bond yields and continues to be a challenge for the value of the Greenback. Adding to the situation are concerns about a potential global economic slowdown, deteriorating US-China relations, and geopolitical tensions. These factors are providing additional support to the safe-haven gold price, as investors seek a stable store of value during uncertain times.
Furthermore, there are indications that the European Central Bank (ECB) may signal a victory in its battle against inflation and potentially pause its rate-hiking cycle. This development also seems to be beneficial for the price of gold, as the metal does not yield interest but gains appeal when other safe assets become less attractive due to lower interest rates.
Gold came back towards 1970, then proceeded to move higher towards 1988. However, the price action now suggests a higher probability of a price concentration for a potential correction towards 1964. The bullish trend is also currently testing the upper parallel of the channel.
| Resistance 3 | Resistance 2 | Resistance 1 | Support 1 | Support 2 | Support 3 |
| 1982 | 1970 | 1960 | 1931 | 1920 | 1904 |
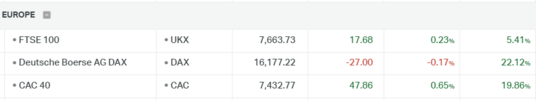
DAX 40
European stocks are set to open on a subdued note on Thursday as traders sift through a mixed bag of earnings reports. The focus will be on the Frankfurt-listed shares of prominent U.S. companies, Netflix and Tesla, which have experienced declines of 3.7% and 8.3%, respectively, following their latest quarterly earnings announcements.
Tesla's CEO, Elon Musk, hinted at potential price cuts, which had a negative impact on the company's shares. On the other hand, Netflix reported impressive results, adding 5.9 million new streaming customers between April and June, and surpassing earnings expectations. However, traders remain concerned about the company's revenue and a weaker-than-anticipated Q3 revenue forecast.
Additionally, European investors will closely monitor the semiconductor sector at the market's opening, particularly after Dutch semiconductor equipment manufacturer ASML reported better-than-expected second-quarter earnings on Wednesday and raised its full-year sales outlook.
Overall, the market sentiment is cautious due to the mixed earnings reports, and all eyes are on the performance of these key companies as the trading day begins.
The DAX came back toward the 16,200 level. In the short term, the DAX remains bullish due to the prevailing risk-on sentiment in the markets, Q2 earnings started positive and better than expected which may help the DAX reach the last high at 16400.
| Resi Level 3 | Resi Level 2 | Resi Level 1 | Suppo level 1 | Suppo level 2 | Suppo level 3 |
| 16800 | 16600 | 16370 | 15650 | 15400 | 15200 |
Attachments

Zforex
zForex.com Representative
- Messages
- 30
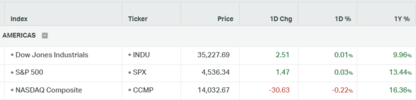
US INDICES:

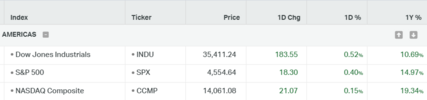
On Thursday, both the S&P 500 and Nasdaq futures experienced declines. Netflix Inc. faced its most significant intraday drop since December due to missed sales estimates and a third-quarter revenue projection that fell short of Wall Street's expectations. Similarly, Tesla Inc. also saw a decrease in profitability during the second quarter, indicating a squeeze on the electric-vehicle maker's margins.
The remarkable rally in the tech-heavy Nasdaq, which surged 45% this year, surpassing the S&P 500's 19% increase, seems to have hit a pause. This rally was fueled by enthusiasm over the potential for artificial intelligence.
IBM (IBM.N), a provider of enterprise software, experienced a 0.6% slip after its second-quarter revenue failed to meet Wall Street's expectations. The decline was mainly driven by reduced sales of its mainframe computers as businesses cut back on tech spending.
The U.S.-listed shares of Taiwanese chipmaker TSMC also dropped by -2.2% after warning of a projected 10% sales decrease in 2023.
According to Refinitiv data from Wednesday, overall earnings across various industries are expected to decline by 8.2% for the second quarter.
There are concerns about a potential U.S. recession this year, primarily due to central banks tightening policy and constricting economies until inflation returns to their 2% targets.
The Nasdaq is rebounding from the target of 15,800 and consistently testing the upper boundary of the current bullish channel on a daily basis. The price action of the Nasdaq on the 4-hour chart suggests a potential correction towards the support level at 15,250.
USOIL:

The price of crude oil remained stable despite the impact of a stronger US dollar and a bullish inventory report indicating robust demand. The US dollar's recovery dampened investor sentiment, which was triggered by a bond rally resulting from lower-than-expected UK inflation.
On the other hand, the US Energy Information Administration reported a decline of 708,000 barrels in US crude stockpiles compared to the previous week. Notably, at the pricing point for WTI in Cushing, inventories fell by 2.9 million barrels, the largest drop since October 2021, as reported by the EIA. Additionally, the implied demand for all oil products also increased during the reported week.
Furthermore, there are noticeable signs of supply cuts from the Organization of the Petroleum Exporting Countries (OPEC), with Russia's crude shipments dropping to a six-month low in the four weeks leading up to July 16.
WTI crude oil is currently holding near the lower boundary of the existing bullish channel. Breaking through the 77-resistance level remains a challenge for WTI as it aims for the next target of 79. Moreover, on a weekly basis, the 200MA is acting as a resistance at the 77 mark.
Crypto:

The U.K. government has rejected a proposal from the U.K. Treasury Committee to regulate crypto retail trading similar to gambling. It firmly disagrees with the Committee's stance.
During the second quarter of 2023, the Grayscale Bitcoin Trust (GBTC) proved to be one of the best performers at Cathie Wood's ARK Invest.
According to ARK's latest quarterly ETF Report, released on July 19, GBTC significantly contributed to the success of the ARK Next Generation Internet exchange-traded fund (ARKW) in Q2.
NYDIG, a prominent crypto trading firm, released a research report suggesting that the introduction of Bitcoin spot-based exchange-traded funds (ETFs) could potentially create $30 billion in new demand for Bitcoin, the world's largest digital asset. CoinDesk reported this information today.
BTC news, analysis, and On-Chain analysis all indicate a forming bullish run.
Technically , Bitcoin (BTC) is experiencing a range-bound price action formation, with the resistance level at 31,800 and the support level at 29,900. Traders are paying close attention to the weekly chart, specifically watching for a potential breakout above the 100-day moving average (100MA). A successful breakout above this level has the potential to drive the price towards the initial resistance at 36,000.
On Thursday, both the S&P 500 and Nasdaq futures experienced declines. Netflix Inc. faced its most significant intraday drop since December due to missed sales estimates and a third-quarter revenue projection that fell short of Wall Street's expectations. Similarly, Tesla Inc. also saw a decrease in profitability during the second quarter, indicating a squeeze on the electric-vehicle maker's margins.
The remarkable rally in the tech-heavy Nasdaq, which surged 45% this year, surpassing the S&P 500's 19% increase, seems to have hit a pause. This rally was fueled by enthusiasm over the potential for artificial intelligence.
IBM (IBM.N), a provider of enterprise software, experienced a 0.6% slip after its second-quarter revenue failed to meet Wall Street's expectations. The decline was mainly driven by reduced sales of its mainframe computers as businesses cut back on tech spending.
The U.S.-listed shares of Taiwanese chipmaker TSMC also dropped by -2.2% after warning of a projected 10% sales decrease in 2023.
According to Refinitiv data from Wednesday, overall earnings across various industries are expected to decline by 8.2% for the second quarter.
There are concerns about a potential U.S. recession this year, primarily due to central banks tightening policy and constricting economies until inflation returns to their 2% targets.
The Nasdaq is rebounding from the target of 15,800 and consistently testing the upper boundary of the current bullish channel on a daily basis. The price action of the Nasdaq on the 4-hour chart suggests a potential correction towards the support level at 15,250.
USOIL:
The price of crude oil remained stable despite the impact of a stronger US dollar and a bullish inventory report indicating robust demand. The US dollar's recovery dampened investor sentiment, which was triggered by a bond rally resulting from lower-than-expected UK inflation.
On the other hand, the US Energy Information Administration reported a decline of 708,000 barrels in US crude stockpiles compared to the previous week. Notably, at the pricing point for WTI in Cushing, inventories fell by 2.9 million barrels, the largest drop since October 2021, as reported by the EIA. Additionally, the implied demand for all oil products also increased during the reported week.
Furthermore, there are noticeable signs of supply cuts from the Organization of the Petroleum Exporting Countries (OPEC), with Russia's crude shipments dropping to a six-month low in the four weeks leading up to July 16.
WTI crude oil is currently holding near the lower boundary of the existing bullish channel. Breaking through the 77-resistance level remains a challenge for WTI as it aims for the next target of 79. Moreover, on a weekly basis, the 200MA is acting as a resistance at the 77 mark.
Crypto:
The U.K. government has rejected a proposal from the U.K. Treasury Committee to regulate crypto retail trading similar to gambling. It firmly disagrees with the Committee's stance.
During the second quarter of 2023, the Grayscale Bitcoin Trust (GBTC) proved to be one of the best performers at Cathie Wood's ARK Invest.
According to ARK's latest quarterly ETF Report, released on July 19, GBTC significantly contributed to the success of the ARK Next Generation Internet exchange-traded fund (ARKW) in Q2.
NYDIG, a prominent crypto trading firm, released a research report suggesting that the introduction of Bitcoin spot-based exchange-traded funds (ETFs) could potentially create $30 billion in new demand for Bitcoin, the world's largest digital asset. CoinDesk reported this information today.
BTC news, analysis, and On-Chain analysis all indicate a forming bullish run.
Technically , Bitcoin (BTC) is experiencing a range-bound price action formation, with the resistance level at 31,800 and the support level at 29,900. Traders are paying close attention to the weekly chart, specifically watching for a potential breakout above the 100-day moving average (100MA). A successful breakout above this level has the potential to drive the price towards the initial resistance at 36,000.
Zforex
zForex.com Representative
- Messages
- 30
EURUSD
The latest data released on Thursday indicates a slight improvement in consumer sentiment in the eurozone for July. The index moved up to -15.1 from the previous -16.1 in June. However, the German Producer Price Index experienced a decline of 0.3% in June, resulting in an annual rate drop from 1% to 0.1%. Looking ahead, the European Central Bank is expected to raise rates by 25 basis points next week. The interest rate market is indicating a 60% chance of another 25 bps hike in September, making the ECB's statements crucial in shaping future market movements.
Meanwhile in the US, the latest data revealed that Initial Jobless Claims decreased to 228K for the week ending on July 15, marking the lowest reading since mid-May. This suggests that the US labor market remains tight. Consequently, US yields surged, leading to a boost in the US dollar. However, other reports presented a mixed picture. The Philly Fed saw a marginal increase from -13.7 in June to -13.5 in July, falling below the market consensus of -10. Additionally, Existing Home Sales dropped to 4.16 million (annual rate), below the estimated 4.2 million.
The EUR/USD corrected the first target around the 1.1125 level and also the DXY touched its resistance level at 100.800. However, the possibility of the breakout of these levels is high toward the 1.1100 level for EURUSD and 101.50 for DXY.
| Resistance 3 | Resistance 2 | Resistance 1 | Support 1 | Support 2 | Support 3 |
| 1.1400 | 1.1300 | 1.1250 | 1.1125 | 1.1100 | 1.1040 |
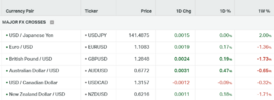
Investor expectations for the number of interest rate hikes from the Bank of England experienced a rapid decline. Expectations fell sharply following the release of UK inflation data that was weaker than the market was anticipating at 7.9% year-on-year.
The market now sees a roughly 40% chance the Bank goes with a 50-basis point hike at its next meeting on August 03 in light of decelerating inflation.
UK headline inflation undershot expectations when it read at 7.9% on Wednesday, below the market's consensus of 8.2% with all sub-components also undershooting.
The GBP/USD stopped at the targeted 1.2850 support level. A first rejection of this level has occurred, and a breakout may lead the price toward the next target of 1.2750.
| Resistance 3 | Resistance 2 | Resistance 1 | Support 1 | Support 2 | Support 3 |
| 1.3310 | 1.3200 | 1.3000 | 1.2850 | 1.2750 | 1.2650 |
USDJPY
In recent reports, the Bank of Japan (BoJ) has indicated that it sees little need to take immediate action on yield control. Despite this stance, the bank remains uncertain about achieving its price goal in a stable manner.
The BoJ acknowledges the importance of maintaining its easing measures, especially in light of the progress made thus far. However, it is still hesitant to fully commit to a course of action.
Officials from the Bank of Japan have stated that a final decision will be made after carefully reviewing the most up-to-date data available. This cautious approach suggests that they are closely monitoring economic indicators before implementing any significant changes to their policies.
USDJPY continued the correction by breaking the first resistance level at 140.500, and now the 141.50 level serves as the second resistance level, especially since the 100 and 200 MA (Moving Averages) are pointing to the same level.
| Resistance 3 | Resistance 2 | Resistance 1 | Support 1 | Support 2 | Support 3 |
| 142.00 | 141.20 | 140.22 | 139.00 | 138.00 | 136.00 |
XAUUSD
US employment clues joined disappointment from the US energy and technology shares to propel US Treasury bond yields, as well as the US Dollar, the previous day. Adding to this, pessimism surrounding China’s economic growth also challenged the gold buyers on Thursday.
It’s worth noting that apart from the US employment clues, the majority of the US statistics haven’t been impressive to support the Fed in announcing more rate hikes past July in the next week, which in turn pushed back the market bears and keep the gold buyers hopeful. However, it all depends upon how well the US central bank can defend the hawkish bias and the US Dollar.
Gold reached the second support level around $1964. The correction in DXY (the US Dollar Index) is what is pushing gold today towards its second support, as the correction in the dollar was long awaited. Additionally, DXY is currently at its resistance area zone.
| Resistance 3 | Resistance 2 | Resistance 1 | Support 1 | Support 2 | Support 3 |
| 1982 | 1970 | 1960 | 1931 | 1920 | 1904 |
DAX40
On Friday, European shares experienced a relatively subdued performance. The market saw a decline in technology stocks, primarily due to software maker SAP's disappointing forecast, which had a negative impact on investor sentiment. SAP's announcement of trimming its full-year outlook for key cloud sales led to a significant drop of 4.8% in the company's stock.
Conversely, there were some gains in the energy sector as energy companies benefited from the rise in oil prices. This led to a 0.7% increase in energy firms' stock prices. Investors were closely evaluating the possibility of additional stimulus measures from China, which played a role in influencing energy stocks.
The technology sector in Europe, represented by the (.SX8P) index, had a tough week overall, being the most significant decliner among major sectors. By the end of the week, it experienced a further decline of 1.6%.
Despite new support measures implemented by the Chinese government to bolster their economy, it failed to have the desired effect on lifting overall market sentiment, contributing to the muted performance in European shares.
The DAX came back toward the 16,200 level. In the short term, the DAX remains bullish due to the prevailing risk-on sentiment in the markets, Q2 earnings started positive and better than expected which may help DAX reach the last high at 16400.
| Resi Level 3 | Resi Level 2 | Resi Level 1 | Suppo level 1 | Suppo level 2 | Suppo level 3 |
| 16800 | 16600 | 16370 | 15650 | 15400 | 15200 |
Attachments
Zforex
zForex.com Representative
- Messages
- 30
EURUSD
The preliminary estimate revealed that the Germany Composite PMI declined to 48.3 in July 2023 from June's 50.6, falling below the expected 50.3. This indicates the first contraction in private sector activity this year and the most significant downturn since November. The decline is attributed to a sharp drop in manufacturing production since May 2020, mainly due to decreasing demand for goods.
Similarly, the HCOB France Composite PMI dropped to 46.6 in July 2023 from June's 47.2, falling short of the projected 47.8. This points to the most substantial contraction in private sector activity since November 2020, with both manufacturing and services output experiencing a decline for the second consecutive month.
As the week progresses, there is an upcoming ECB meeting where the market anticipates a 25 bp hike, potentially raising interest rates to 4.25%. However, it's worth noting that last week, ECB members hinted that after this rate increase, further actions are uncertain or not guaranteed.
The EUR/USD continues the selloff towards the lower parallel of the current bearish channel at the 1.1085 support level. A breakout of this level may take the price to the next target around the 1.1045 support level.
| Resistance 3 | Resistance 2 | Resistance 1 | Support 1 | Support 2 | Support 3 |
| 1.1400 | 1.1300 | 1.1250 | 1.1085 | 1.1046 | 1.1000 |
On Friday, the UK's Office for National Statistics (ONS) released its report indicating that the country's monthly Retail Sales data increased by 0.7% in June, compared to a mere 0.1% rise in May, which exceeded the expected 0.2% growth. However, the annual Retail Sales data contracted by 1.0%, although it was better than the anticipated -1.5% and the previous -2.1%.
Additionally, the monthly headline Consumer Price Index (CPI) showed a 0.1% expansion, falling short of the consensus forecast of 0.4% and lower than the 0.9% figure from the previous period.
As of August 3, investors held divergent views on the Bank of England's (BoE) future interest rate policy. While some market participants expected BoE Governor Andrew Bailey to implement a 50-basis point (bps) interest rate hike, a group of investors leaned towards a more conservative 25-bps rate hike due to the softer inflation data.
In the US, the labor market exhibited resilience as unemployment claims data showed lower-than-anticipated levels recently. Consequently, the market is now pricing in almost a 100% probability of a 25-bp rate hike during the upcoming FED meeting, which would mark the last hike in this tightening cycle.
The GBP/USD found support at the 1.2850 level. A first rejection of this level has occurred, and a breakout may lead the price toward the next target of 1.2750.
| Resistance 3 | Resistance 2 | Resistance 1 | Support 1 | Support 2 | Support 3 |
| 1.3310 | 1.3200 | 1.3000 | 1.2850 | 1.2750 | 1.2650 |
The Bank of Japan is scheduled to hold its upcoming 2-day policy meeting next week. It is widely anticipated that the bank will maintain its current policy settings, with interest rates to be kept at -0.1% and Yield Curve Control (YCC) retained. The YCC aims to flexibly target 10-year yields at 0%, allowing a range of +/- 50 basis points.
During the meeting, the central bank will also release its latest Outlook Report, which includes the Board members' median forecasts for Real GDP and Core CPI. Some press reports have suggested that the Bank of Japan might raise the inflation forecast above the 2% target level at this meeting. If this happens, it could potentially pave the way for further policy normalization.
There has been speculation regarding a possible adjustment to yield curve control. Former BoJ Director Hayakawa expects that the bank might tweak its policy by raising the 10-year yield ceiling to 1.0% this month. However, on Friday, Reuters sources indicated that the Bank of Japan is leaning towards maintaining its current yield control policy during the upcoming meeting.
USDJPY at the 142 level serves as the second resistance level, especially the upper parallel of the current downward channel act as resistance for the current price action also the historical level of 142 is important.
| Resistance 3 | Resistance 2 | Resistance 1 | Support 1 | Support 2 | Support 3 |
| 142.00 | 141.20 | 140.22 | 139.00 | 138.00 | 136.00 |
XAUUSD
With the major bond yields of developed countries going down, gold has become more attractive. The tightening cycle is ending as a slowdown in inflation has become clear in the US and EU, leading economies. In such conditions, gold generally becomes more attractive for holding. Additionally, the EU has started signaling worse-than-expected economic activity, as evidenced by PMI from manufacturing and services being in the contraction territory, and this trend may continue downward. A possible recession can affect risk-taking, and Gold is considered a safe haven in times of risk-off sentiment, especially as Q2 earnings results in the US were lower than expected.
Gold found support and stabilized at the $1959 level. Additionally, the RSI in the 2H chart signals a divergence, indicating a possible reversal towards the $1968 level, followed by the $1973 resistance level.
| Resistance 3 | Resistance 2 | Resistance 1 | Support 1 | Support 2 | Support 3 |
| 1982 | 1970 | 1960 | 1931 | 1920 | 1904 |
Shares in Europe were poised to begin the week with a negative outlook on Monday following the inconclusive results of the Spanish elections. In addition, markets were preparing for central bank meetings, where another round of interest rate hikes was anticipated. Investors also had their attention on corporate earnings.
The outcome of Sunday's vote in Spain didn't provide a clear victory for either the left or right bloc, leaving the eurozone country facing the challenge of lengthy negotiations or the possibility of holding fresh elections to form a government.
Regarding earnings, Vodafone reported a 3.7% growth in quarterly service revenue, driven by a strong performance in Britain and an improvement in the rate of decline in Germany, Italy, and Spain. Dutch operator KPN also released its results, showing a 16% rise in second-quarter net profit. Ryanair was under scrutiny as the airline expressed caution about travel demand for the remainder of the year. Due to Boeing delivery delays, the company had to revise its passenger growth forecast despite achieving quarterly profit levels surpassing pre-pandemic figures.
On a more positive note, Philips raised its targets slightly after posting better-than-expected core earnings. The health technology company attributed this success to improved supply chains, a strong order book, and efficiency measures. The DAX came back toward the 16,200 level. In the short term, the DAX remains bullish due to the prevailing risk-on sentiment in the markets, Q2 earnings started positive and better than expected which may help the Dax reach the last high at 16400.
| Resi Level 3 | Resi Level 2 | Resi Level 1 | Suppo level 1 | Suppo level 2 | Suppo level 3 |
| 16800 | 16600 | 16370 | 15650 | 15400 | 15200 |
Attachments
Zforex
zForex.com Representative
- Messages
- 30
The Eurozone PMIs for June disappointed as both the Manufacturing PMI and the Services PMI came in below expectations, recording figures of 42.7 and 51.1, respectively. The Composite Index also experienced a decline, reaching 48.9, marking its lowest reading since November. Germany and France were hit particularly hard, with their Composite Indexes falling below 50, which adds to concerns about potential recession risks in the region. Despite these indicators reflecting economic weakness, the European Central Bank (ECB) is likely to raise interest rates by 25 basis points on Thursday. The key to watch out for will be the messaging surrounding this decision.
In the United States, market participants adjusted their positions as they awaited the Federal Reserve's decision. The expectation is that the Fed will raise its key rate by 25 basis points on Wednesday. The central bank's communication following this move will be crucial for the Dollar and financial markets alike. In terms of US PMI data, the Services PMI showed a decrease from 54.4 to 52.4 in July, falling short of the expected 54. However, the Manufacturing PMI rebounded from 46.3 to 49, surpassing the market consensus of 46.4.
Today, the market will pay close attention to important economic data from both Europe and the US. From Europe, the Ifo Business Climate Index will be released, while the US will provide insights into CB Consumer Confidence.
The EUR/USD extended its selloff towards the lower parallel of the current bearish channel, reaching the 1.1060 support level, which aligns with the 100MA on the 4H chart. Additionally, the price is nearing the historical level of 1.1045, and a breakout below this point could potentially lead to a decline toward 1.1000.
| Resistance 3 | Resistance 2 | Resistance 1 | Support 1 | Support 2 | Support 3 |
| 1.1400 | 1.1300 | 1.1250 | 1.1085 | 1.1046 | 1.1000 |
GBPUSD
The recent selloff of the USD, caused by a miss in the US CPI report, has been completely reversed due to better-than-expected US economic data. These positive surprises have kept the possibility of a rate hike after the July increase alive. Last week, the US Initial Claims beat expectations and reached record lows, while the US PMIs showed a mixed picture, although the Manufacturing PMI exceeded expectations significantly. The market expects the Fed to raise rates by 25 bps this week and maintain a data-dependent approach. Therefore, if the US continues to receive positive economic data, another rate hike is highly likely.
On the other hand, the UK CPI missed expectations across the board last week, leading to a significant revision in interest rate expectations. Prior to the report, the market had been pricing in a higher chance of a 50-bps hike due to the higher wages data from the previous UK employment report. Now, the market believes there is a higher likelihood that the Bank of England (BoE) will raise rates by 25 bps at the upcoming meeting, and this adjustment has put downward pressure on the GBP.
The GBP/USD has found support at the 1.2800 level, which is now acting as a new support after previously serving as a resistance level. This development is a positive sign for the continuation of the bullish long trend. If the price manages to break out above this level, it is likely to move towards the 1.2700 mark.
| Resistance 3 | Resistance 2 | Resistance 1 | Support 1 | Support 2 | Support 3 |
| 1.3310 | 1.3200 | 1.3000 | 1.2850 | 1.2750 | 1.2650 |
JPYUUSD
On Monday, the preliminary S&P Global US Manufacturing PMI data surpassed expectations, coming in at 49, which was higher than the market's anticipated 46.4 and also above the previous reading of 46.3 in June. However, the Services PMI declined from 54.4 to 52.4. As a result, the US S&P Global Composite PMI fell to 52, down from June's 53.2.
In addition to the mixed US PMI figures, the data released last week indicated that inflationary pressures are easing, and the labor market remains tight. These findings have sparked speculation that the Federal Reserve might conclude its tightening monetary policy after the July meeting.
On Friday, the Bank of Japan (BoJ) is set to announce its monetary policy. BoJ Governor Kazuo Ueda dismissed speculation of a Yield Control Curve policy change and asserted that achieving the 2% inflation target would still require additional efforts. This suggests that Japanese policymakers are likely to maintain a dovish policy stance to sustain inflation at a level above 2%. Furthermore, BoJ policymakers prefer to assess more data to ensure wages and inflation continue to rise before considering any policy modifications.
After reaching the 142.00 resistance level the pair is coming back with the next support around the 140.50 level followed by the 139.00 area.
| Resistance 3 | Resistance 2 | Resistance 1 | Support 1 | Support 2 | Support 3 |
| 142.00 | 141.20 | 140.22 | 139.00 | 138.00 | 136.00 |
XAUUSD
The Asia-Pacific zone is experiencing a boost in optimism, thanks to China's stimulus measures and interventions by Beijing's central bank. Nonetheless, concerns persist due to mixed reactions to the recently released PMI data and central bank actions, encouraging the XAU/USD bulls.
Fears of a looming recession have resurfaced following the continuous decline in Europe and US PMI figures, indicating a deterioration in economic activity. The falling yields are also contributing to Gold's increasing allure as a safe-haven asset.
In the near term, the direction of the gold price is expected to be influenced by the US CB Consumer Confidence data for July, projected at 112.10 compared to the previous reading of 109.70. However, the primary focus will be on the upcoming monetary policy meetings of the Federal Reserve (Fed) and the European Central Bank (ECB), as market participants keenly await any hints or insights into their future policies.
Gold continued to decline until the 1952 level, which now appears to be a correction. However, the actual short-term trend seems healthy and may continue to decline if the dollar gains more momentum.
| Resistance 3 | Resistance 2 | Resistance 1 | Support 1 | Support 2 | Support 3 |
| 1982 | 1970 | 1960 | 1940 | 1931 | 1920 |
DAX40
On Tuesday, European stock markets exhibited little movement, hovering around the flat line. Investors were cautious as they awaited the US Federal Reserve and European Central Bank meetings scheduled for later in the week, where rate hikes were expected to be announced.
Moreover, traders reacted positively to China's commitment to strengthening its economy through increased policy support.
In terms of corporate performance, Unilever's quarterly sales figures exceeded expectations, providing a positive outlook. However, the markets were dealt a blow when German chemicals giant Bayer reduced its outlook.
Luxury stocks like LVMH and Richemont, which have significant exposure to the Chinese market, saw an increase of more than 1% each.
Remy Cointreau experienced a 5.0% gain after the French spirits group expressed confidence in a sharp sales rebound in the US from the third quarter.
As for the DAX, it remained around the 16,200 level. In the short term, the DAX's momentum remained bullish, and there might be a possible price concentration around the current resistance area of 16,200-16,400, which could indicate the formation of a reversal pattern.
| Resi Level 3 | Resi Level 2 | Resi Level 1 | Suppo level 1 | Suppo level 2 | Suppo level 3 |
| 16600 | 16400 | 16200 | 15650 | 15400 | 15200 |
Attachments
Zforex
zForex.com Representative
- Messages
- 30
EURUSD
Germany's IFO Business Climate Index declined to 87.3 in July, missing expectations of 88.0 and down from the previous value of 88.6. Additionally, the Current Economic Assessment for the same month was reported at 91.3, compared to June's 93.7 and the projected 93.0. Furthermore, the IFO Expectations Index, which indicates firms' outlook for the next six months, dropped to 83.5 in July, lower than the previous value of 83.8 and the market forecast of 83.0. Following this mostly negative economic data from Germany, IFO Economist Klaus Wohlrabe commented that the "German GDP is likely to contract in the third quarter."
On the other hand, the US Conference Board (CB) Consumer Confidence surged to 117.0 in July, up from the revised figure of 110.10 in the previous period, surpassing market expectations of 112.10. The survey also revealed a slight decrease in one-year consumer inflation expectations to 5.7%, while the Present Situation Index and Consumer Expectations Index rose to 160.0 and 88.3, respectively, for the same month.
Today's FED meeting, which the market has priced with almost 100% certainty to result in a 25bp hike, may provide insight into the Fed members' future projections, specifically whether they plan to pause at the current interest rate levels or implement another rate hike later this year. Markets are confident that this potential hike could be the final one in the current tightening cycle.
The EUR/USD has found support at the 1.1040 level, which coincides with the lower boundary of the current bearish channel. An upward correction is now underway, and the next target for the pair could be the median line at the 1.1100 level. In case of a sudden breakout, the pair may move toward the 200MA support level.
| Resistance 3 | Resistance 2 | Resistance 1 | Support 1 | Support 2 | Support 3 |
| 1.1400 | 1.1300 | 1.1250 | 1.1085 | 1.1046 | 1.1000 |
GBPUSD
The data released earlier this week revealed that economic activity in the United Kingdom was weaker than expected. The Manufacturing PMI for July declined to 45.0 from June's figure of 46.5, falling short of the anticipated 46.1. This marks the 12th consecutive month of contraction in the manufacturing sector. Additionally, the preliminary Services PMI for July dropped to 51.5 from the previous reading of 53.0, missing the expected 53.7.
In June, the Bank of England (BoE) took the markets by surprise when it raised its Bank Rate by 50 basis points (bps) to 5.00%. This prompted investors to quickly factor in a terminal rate of 6.50%. The BoE's aggressive rate hikes, the most significant in three decades, have raised concerns about their potential impact on the UK's economy and put pressure on the pound sterling.
Nonetheless, according to the latest Reuters poll, 42 out of 62 economists predict that the Bank Rate will see a 25-bps increase to 5.25% during the upcoming BoE meeting scheduled for August 3. In contrast, only 20 economists predicted a half-point hike.
The GBP/USD has found support at the 1.2800 level, which is now acting as new support after previously serving as a resistance level. This development is a positive sign for the continuation of the bullish long trend. If the price manages to break out above this level, it is likely to move towards the 1.2980 mark.
| Resistance 3 | Resistance 2 | Resistance 1 | Support 1 | Support 2 | Support 3 |
| 1.3310 | 1.3200 | 1.3000 | 1.2800 | 1.2750 | 1.2650 |
The International Monetary Fund (IMF) has issued a warning about the possibility of higher inflation in Japan and has called on the Bank of Japan (BoJ) to exit its easy-money policy. However, BoJ Governor Kazuo Ueda reiterated on Wednesday that the central bank will maintain its accommodative monetary stance and assured that the long-term yield rate remains stable due to the yield curve control (YCC) policy.
Meanwhile, the Federal Reserve (Fed) is expected to raise interest rates by 25 basis points. Nevertheless, investors have gained some confidence that the US central bank may adopt a more dovish stance in response to a potential downturn in economic activity. As a result, the focus will be on the accompanying policy statement and the press conference by Fed Chair Jerome Powell.
Investors will closely watch for clues about the future path of rate hikes, which will significantly impact the dynamics of the USD price and could provide significant momentum to the USD/JPY pair.
After reaching the 142.00 resistance level the pair is coming back with the next support is around 140.50, followed by the 139.00 area.
| Resistance 3 | Resistance 2 | Resistance 1 | Support 1 | Support 2 | Support 3 |
| 142.00 | 141.20 | 140.22 | 139.00 | 138.00 | 136.00 |
The price of gold is attempting to recover as investors come to terms with the Federal Reserve's (Fed) plan to raise interest rates by 25 basis points, bringing the rate to the range of 5.25% to 5.50%. This has led to increased demand for the precious metal as market participants hope that the rate hike in July will be the final one for this year, and the Fed might pause its rate-hiking cycle for a longer duration.
Furthermore, concerns about a global recession have eased due to the positive Consumer Confidence in the United States, along with expectations that the Fed will soon announce the peak of interest rates. These factors have put pressure on the US Dollar Index (DXY), causing it to retreat. Investors believe that Fed Chair Jerome Powell will not take an overly aggressive stance on handling sticky inflation.
Following the Fed's policy decision on Wednesday, there is anticipation around the release of US GDP numbers for the second quarter on Thursday, which is keeping investors on edge.
Gold, after finding support around the 1954 level, underwent a correction and is currently facing resistance in 1970, coinciding with the upper parallel of the downtrend. If there's a breakout above the current level, the first resistance will likely be encountered around 2074, followed by the 2080 level.
| Resistance 3 | Resistance 2 | Resistance 1 | Support 1 | Support 2 | Support 3 |
| 1982 | 1970 | 1960 | 1940 | 1931 | 1920 |
DAX 40
European shares experienced a decline on Wednesday as investors assessed a range of corporate earnings, and there was a prevailing sense of caution in the markets ahead of the Federal Reserve's upcoming monetary policy decision.
Notably, Deutsche Bank faced a setback, with its shares slipping nearly 1% following a 27% decrease in second-quarter profit due to a significant drop in investment banking revenue.
Similarly, the French luxury group LVMH had an impact on the personal and household goods sector, witnessing a decline of 3.6% following the release of its half-yearly results.
In contrast, British aero-engineer Rolls-Royce witnessed a substantial surge of over 24%, claiming the top position in the index. This impressive gain, the largest since August 2021, was attributed to a trading update that raised its full-year operating profit forecast by approximately 45%.
Furthermore, French glass packaging producer Verallia emerged as the second-biggest gainer, enjoying a rise of over 10% in response to better-than-expected H1 results and an optimistic guidance hike.
DAX is coming back from the 16200 level. There is a possible price concentration around the current resistance area of 16,200-16,400, which could indicate the formation of a reversal pattern.
| Resi Level 3 | Resi Level 2 | Resi Level 1 | Suppo level 1 | Suppo level 2 | Suppo level 3 |
| 16600 | 16400 | 16200 | 15650 | 15400 | 15200 |
Attachments
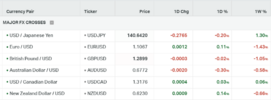
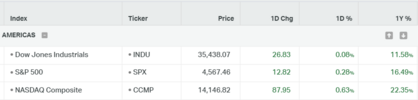
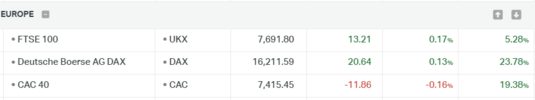
Similar threads
- Replies
- 0
- Views
- 17
- Replies
- 0
- Views
- 45
- Replies
- 7
- Views
- 22
- Replies
- 0
- Views
- 23