Daily Market Analysis from Investizo.com

General analysis USDCHF for 20.07.2022

Current dynamics


The USD/CHF pair opened today's trading session with a decline. To continue the bearish performance of the pair for the third consecutive session. As the pair witnessed yesterday, Tuesday, a strong slide from the highest level in several weeks, touched last Thursday.

The US dollar continued its bearish path and extended its losses significantly during trading on Tuesday, with lower expectations of investors that the US Federal Reserve will tighten its monetary policy more strongly during its meeting next week, in light of the sharp decline in gasoline prices during the past month, a development that officials are likely to welcome. The Fed is concerned that expectations of high inflation may become ingrained and complicates their task of curbing price increases.

In addition to the statements of the Fed members that came to confirm that they are committed to raising the interest rate by 75 basis points in the current July meeting to reduce bets about the Federal Reserve escalating the pace of raising interest rates.

Whereas, Lewis Waller and James Bollader, Fed members said that they are leaning toward a 75 basis point rate increase at the next meeting, rather than a move by 100 basis points, to mitigate the negative effects on the economy.

As data published by the US Census Bureau on Tuesday, building permits came in at 1.685 million, above expectations (1.65 million) in June, and housing starts in the United States (MoM) came in at 1.559 million, below expectations (1.585 million) in June, the rate increased Building permits changed to -0.6% in June from the previous -7%. The initial housing change rate increased from -14.4% previously to -2% in June.

The main keys affecting the pair will be this week Initial Jobless Claims, and S&P Global Purchase Managers Index (PMI).

Support and resistance levels

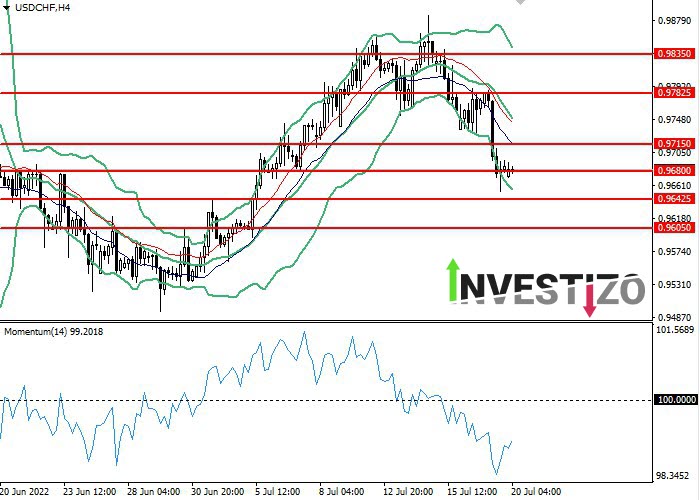
On the 4 hour chart, the instrument is testing the consolidation at the bottom of the Bollinger Bands. The indicator is directed downward and the price range is widening, which indicates that the current trend is about to continue. The momentum chart is below the 100 level, which gives buy signals. The Envelopes indicator gives clear sell signals.

✔️ Support levels: 0.96800, 0.96425, 0.96050.
✔️ Resistance levels: 0.97150, 0.97825, 0.98350.

Trading scenarios

✔️ Short positions should be opened at the 0.96800 with a target of 0.96425 and a stop loss at 0.97150. Implementation period: 1-2 days.
✔️ Long positions can be opened above the level of 0.97150 with a target of 0.97825 and a stop-loss at the level of 0.96800. Implementation period: 1-2 days.

chf.jpg.760b93453887087e09025f0fb1454eb7.jpg


More analytics on our website

Analytical department investizo.com

Disclaimer:
This material is provided as a general marketing communication for information purposes only and does not constitute an independent investment research. Nothing in this communication contains, or should be considered as containing, an investment advice or an investment recommendation or a solicitation for the purpose of buying or selling of any financial instrument.
 
General analysis AUDUSD for 27.07.2022

Current dynamics


AUD/USD drops to 0.69450 ahead of major macroeconomic news on the pair

The pair AUD/USD, traditionally sensitive to the appetite for risk and dependent on it in direct relation, since the beginning of the trading week is in a downtrend, as a whole market is in an anxious condition, expecting the probable occurrence of economic recession. These concerns are dictated not only by steadily rising inflation and a consistent increase in the key rate of the U.S. Federal Reserve, but also negative forecasts about the prospects for economic growth in the whole world, including the Peoples Republic of China, heavily affected by prolonged restrictions caused by the epidemic situation around the pandemic of Covid-19. Another round of geopolitical tension in the world also affects the reduction of appetite for risk: the USA confronts China about its claims in the Taiwan issue, relations between Russia and European countries are complicated due to the news about a possible further reduction of gas supplies to the West. 

Negative statistics were released in the USA, showing a consecutive three-month decline in consumer confidence (95.7 vs. previous 98.4), new home sales in June (0.59 million vs. previous 0.64 million).

In Australia, experts predict the worst performance since 1990, probably in annual terms, it will reach 6.2%, which will inevitably provoke an increase in interest rates of the Reserve Bank of Australia.  The main reasons for such a surge in inflation in Australia is the energy and agricultural crisis, the global rise in prices for energy and food products.

The meeting of the Reserve Bank of Australia will be held on August 2, the main agenda is expected to raise the main interest rate to 1.35%. Experts believe that the most probable decision is to increase the rate by 50 basis points, at the same time the ceiling of its growth at the moment is forecasted at 3.35%, as the situation does not look inclined to stabilization and the cycle of tightening of the monetary policy, probably, will not end soon. The nearest step in the pairs development is for the U.S. Federal Reserve meeting, which is scheduled for July 27. Analysts expect the key rate to be raised by 75 basis points at once this time.

Support and resistance levels

Alligator is sleeping: the moving averages are twisted, the instrument is flat. The nearest fractal below the alligators teeth (red line) is at 0.69340. Awesome Oscillator (AO) and Accelerator Oscillator (AC) are in the gray area, showing a divergence, which is not a reliable signal to open a position.

✔️ Support levels: 0.69340, 0.69040, 0.68720.
✔️ Resistance levels: 0.70510, 0.70150, 0.69760.

Trading scenarios

✔️ Short positions should be opened at the 0.96800 with a target of 0.69040 and a stop loss at 0.69550. Implementation period: 1-2 days.
✔️ Long positions can be opened above the level of 0.69760 with a target of 0.70150 and a stop-loss at the level of 0.69550. Implementation period: 1-2 days.

aud.jpg.9ccabc1091d0363e4d6461504ecd4c2e.jpg


More analytics on our website

Analytical department investizo.com

Disclaimer:
This material is provided as a general marketing communication for information purposes only and does not constitute an independent investment research. Nothing in this communication contains, or should be considered as containing, an investment advice or an investment recommendation or a solicitation for the purpose of buying or selling of any financial instrument.
 
General analysis USDJPY for 16.08.2022

Current DynamicsJapan's economy grew 0.5% in real terms from April to June. Consumption in Japan, which accounts for more than half of the country's GDP, grew on 1.1%, exports increased on 0.9% and imports increased on 0.7%. Builder confidence in the U.S. housing market fell harder than expected in August to its lowest level since the COVID-19 pandemic. Citizens of border areas in California started regularly traveling to Mexico for shopping products.GDP in Japan rose for the third quarter in a row. According to data released Aug. 15 by the country's Cabinet, Japan's economy grew 0.5% in real terms from April to June. Personal consumption, on which more than half of GDP accounts, increased on 1.1%.More people started going to restaurants and traveling after covid restrictions were removed in Japan. Capital spending increased on 1.4%. It is worth noting that in the previous quarter the same figure showed a decline from 0.3%.At the same time public investment in Japan also increased on 0.9% in real terms. In the previous quarter there was a decrease by 3.2%. Exports increased on 0.9%, and imports - on 0.7%.Even though Japan's economy grew at an annualized rate of 2.2%, which is worse than economists' expectations for 2.7%, Minister Daishiro Yamagiwa, who is in charge of economic recovery, said that Japan's economy is gradually recovering.Meanwhile in the U.S., builder confidence in the housing market fell in August to its lowest level since the COVID-19 pandemic. High inflation and rising borrowing costs have affected the downturn. The Wells Fargo index of the National Association of Home Builders (NAHB) in the United States, which measures the dynamics of the single-family housing market, fell for the eighth straight month and dropped to 49, which is the worst reading for the housing market since the financial crisis of 2008.Along with that, residents of California's border areas have started regularly traveling to Mexico for shopping products. For example, gasoline in Mexico for $1.24 cheaper than in California; milk is twice cheaper. Sellers and supermarkets in Tijuana are seeing a 20-30% increase of U.S. shoppers.Against the backdrop of declining GDP in the U.S. for the second quarter in a row, Japan's economy looks much better off. Low key interest rates and growing imports exports indicate the economy is recovering even though energy resources are expensive.

The USD/JPY tested the 38.2 Fibonacci level, but failed to consolidate near it and went back to the 50.0 Fibonacci level. Trend is descending. The RSI oscillator is in the lower half near 50.

Support and resistance levels

✔️ Support levels: 135.57, 134.43, 133.72, 133.15
✔️ Resistance levels: 132.57, 131.86, 130.70

Trading scenarios

✔️ Short positions can be opened below the level of 132.57 with a target of 131.86 and a stop loss of 133.72 : Implementation period: 1-3 days
✔️ Long positions can be opened above the level of 133.72 with a target of 134.43 and a stop loss of 133.15 : Implementation period: 1-3 days
jpy.jpg.22e77ed9f4c1f44cc2f3a72c36bd88fa.jpg

More analytics on our website


Analytical department investizo.com


Disclaimer: This material is provided as a general marketing communication for information purposes only and does not constitute an independent investment research. Nothing in this communication contains, or should be considered as containing, an investment advice or an investment recommendation or a solicitation for the purpose of buying or selling of any financial instrument.
 
Fundamental analysis of EUR/USD

EUR/USD started the week with a decline to $1.09750 amid disappointing German retail sales data and mixed Eurozone economic data.

In terms of Eurozone data, Monday saw the release of July's harmonized consumer price index, which rose 5.5% year-on-year, as well as a flash GDP figure of 0.3% QoQ and 0.6% YoY. Despite a 1.6% y/y increase in German retail sales in June, the monthly figure fell to -0.8%. The ECB, raising interest rates, added 25 basis points to 4.25%, suggesting a pause in interest rate hikes in September as signs of weakening inflation and recession fears emerge. The media's interpretation of today's PMI, especially its sub-components - prices, employment and new orders - could affect market sentiment.

20230801EURUSD.thumb.png.26668e6155ffb7b003a08ea30347fd1b.png

read more
 
Fundamental analysis of XAU/USD

Gold is going through a volatile period marked by significant fluctuations and economic events that have affected its price and demand. XAU/USD is currently trading at 1949.50 after an upward correction.

gold.thumb.png.e6aab1148b4ecd605b8f77efec5646a4.png

One of the main catalysts for the rise in gold prices was the unexpected downgrade of the US credit rating by Fitch Ratings from AAA to AA+. The move was attributed to concerns over the country's slowing financial growth and increasing government debt over the next three years. While the previous downgrade sent the market into turmoil, this time the initial reaction was relatively calm, but experts continue to monitor the situation. U.S. Treasury Secretary Janet Yellen disagreed with the decision, calling it "arbitrary," and this disagreement has raised concerns about the U.S. debt ceiling crisis. The downgrade led to a drop in confidence in the economy, prompting investors to rush to gold, considered a safe-haven asset. This has led to an increase in demand, reflecting gold's historical role as a preferred investment during periods of economic uncertainty and stress.

Read more
 
Fundamental analysis of USD/JPY

The USD/JPY pair is correcting after a slight decline and is trading at 143.340 as Japanese authorities took steps to defend the currency. This reaction is the result of cautious optimism in the markets and a weaker US dollar amid upcoming US economic data and changes in the dynamics of bond yields.

20230803USDJPY.thumb.png.53d01e13727d1226a393f5694a89e059.png

The Bank of Japan expanded the ceiling on the allowed rate on 10-year Japanese government bonds from 0.5% to 1.0%. The move pushed JGB yields to their highest levels in a decade, and to control the volatility of the Japanese yen, the BOJ announced unscheduled purchases of 5- and 10-year bonds. Japanese Governor Hirokazu Matsuno expressed confidence in the BOJ's strategy and remained vigilant against currency fluctuations.

Read more
 
Fundamental analysis of XAU/USD

XAU/USD prices are trading in a narrow range at 1936.00 ahead of important macroeconomic data on the US economy.While the US dollar reached a four-week high and the yield on 10-year US Treasuries reached its highest level since November last year, XAU/USD is about to hit a three-week low. This situation makes gold more expensive for those who trade in other currencies and puts pressure on gold, which is fraught with the risk of breaking the support level of 1916.00.

20230804XAUUSD.thumb.png.5476969bd0dbb6a7ef14f866a0c71bfd.png

Read more
 
Fundamental analysis of XAU/USD

XAU/USD is currently in swing territory, trading at 1937.00 as traders ponder the potential impact of U.S. labor market trends and upcoming inflation data on the direction of U.S. monetary policy. While a weaker dollar and lower bond yields have supported the precious metal, the way forward remains unclear.

20230807XAUUSD.thumb.png.b0aee45934d7dedede08b82b08ec4338.png

Current market conditions have been driven primarily by slowing US job growth, which has weakened the dollar and bond yields, and contributed to gold's rally last Friday. The U.S. jobs report for July showed slower than expected job growth, indicating that the labor market may be stabilizing. This suggested that the recent Fed rate hike could be the last in an ongoing tightening cycle. However, strong wage growth and a declining unemployment rate suggest that the labor market remains tight, providing an opportunity to assess the Fed's future interest rate decisions. In light of these mixed signals from the labor market, attention now turns to the upcoming consumer price index (CPI) data due on Wednesday. This data will be key in determining whether further rate hikes are needed to curb inflation. If interest rates rise, gold, traditionally a hedge against inflation, could lose its appeal.

Read more
 
Fundamental analysis of WTI

WTI crude oil price is hovering at 82.35, pointing to concerns about a drop in Chinese oil demand following news on trade and inflation, as China is the largest oil consumer. These concerns were heightened when China's crude oil imports fell 18.8% in July. However, there is a positive side to the U.S. Energy Information Administration's monthly report. With GDP growth forecast for 2023 rising from 1.5% to 1.9% and crude oil prices rising since June, largely due to a prolonged voluntary production cut in Saudi Arabia and rising global demand, this is an optimistic sign. This optimism is also supported by Saudi Arabia's recent announcement to extend its voluntary oil production cuts and Russia's plan to cut oil exports in September.

20230809WTI.thumb.png.56dccb0b80a6bd1640a98a8a42e3ec14.png


Read more
 
Fundamental analysis of EUR/USD

EUR/USD rose slightly and is trading at 1.09960. The US CPI report led to an unpredictable development: despite a lower than expected core inflation reading, core inflation remained flat, limiting further upside.

20230811EURUSD.thumb.png.da10e5eb7b226bc43124569471eb72fe.png


Read more
 
Back
Top