Admiral Markets
AdmiralMarkets.com Representative
- Messages
- 95
ABC zigzags lead direction of Forex waves
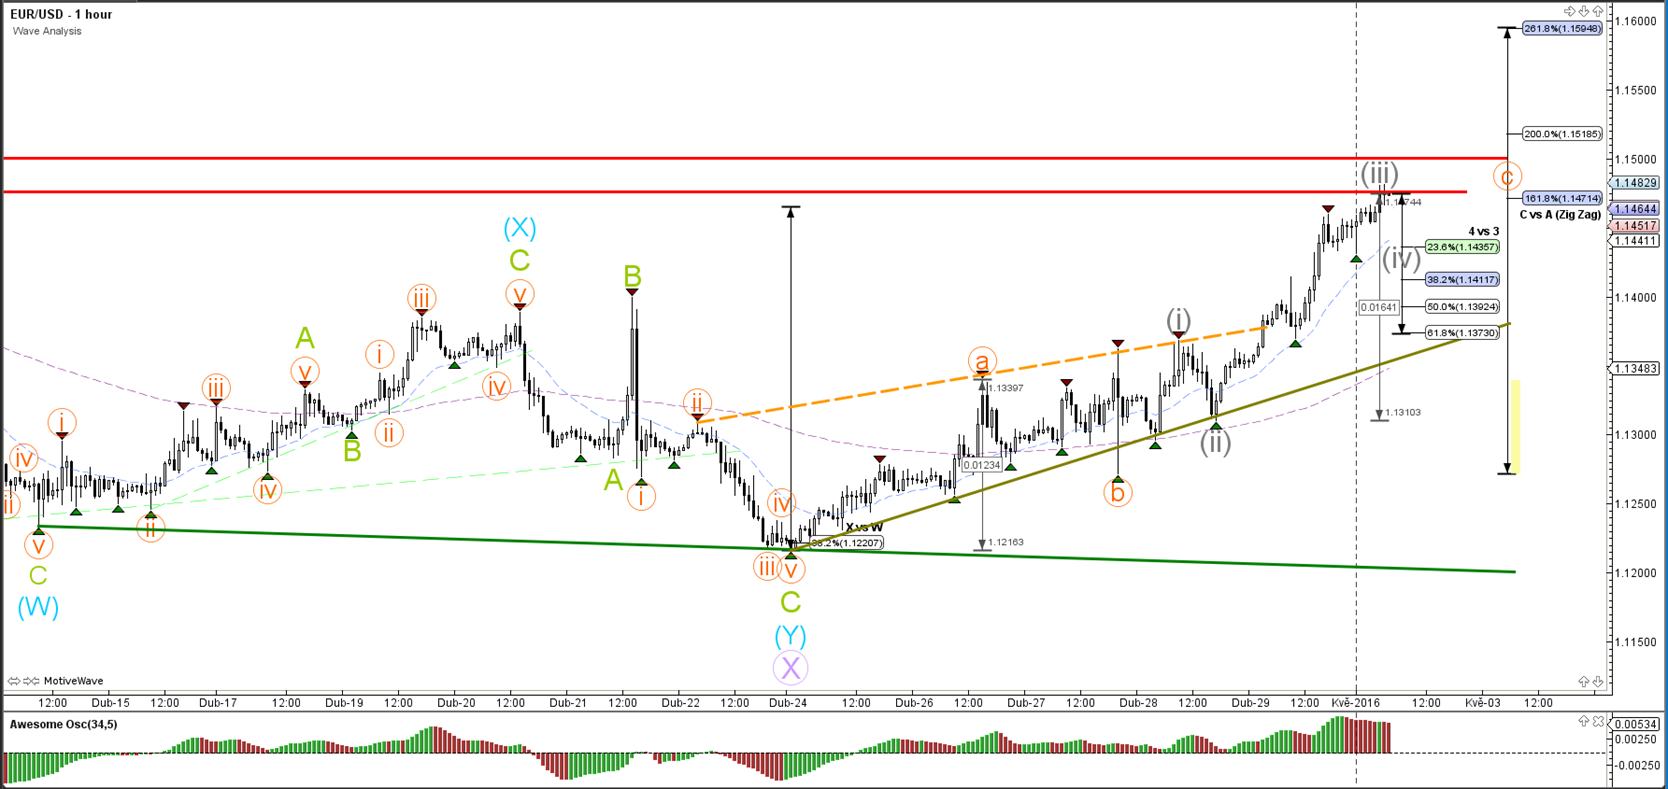
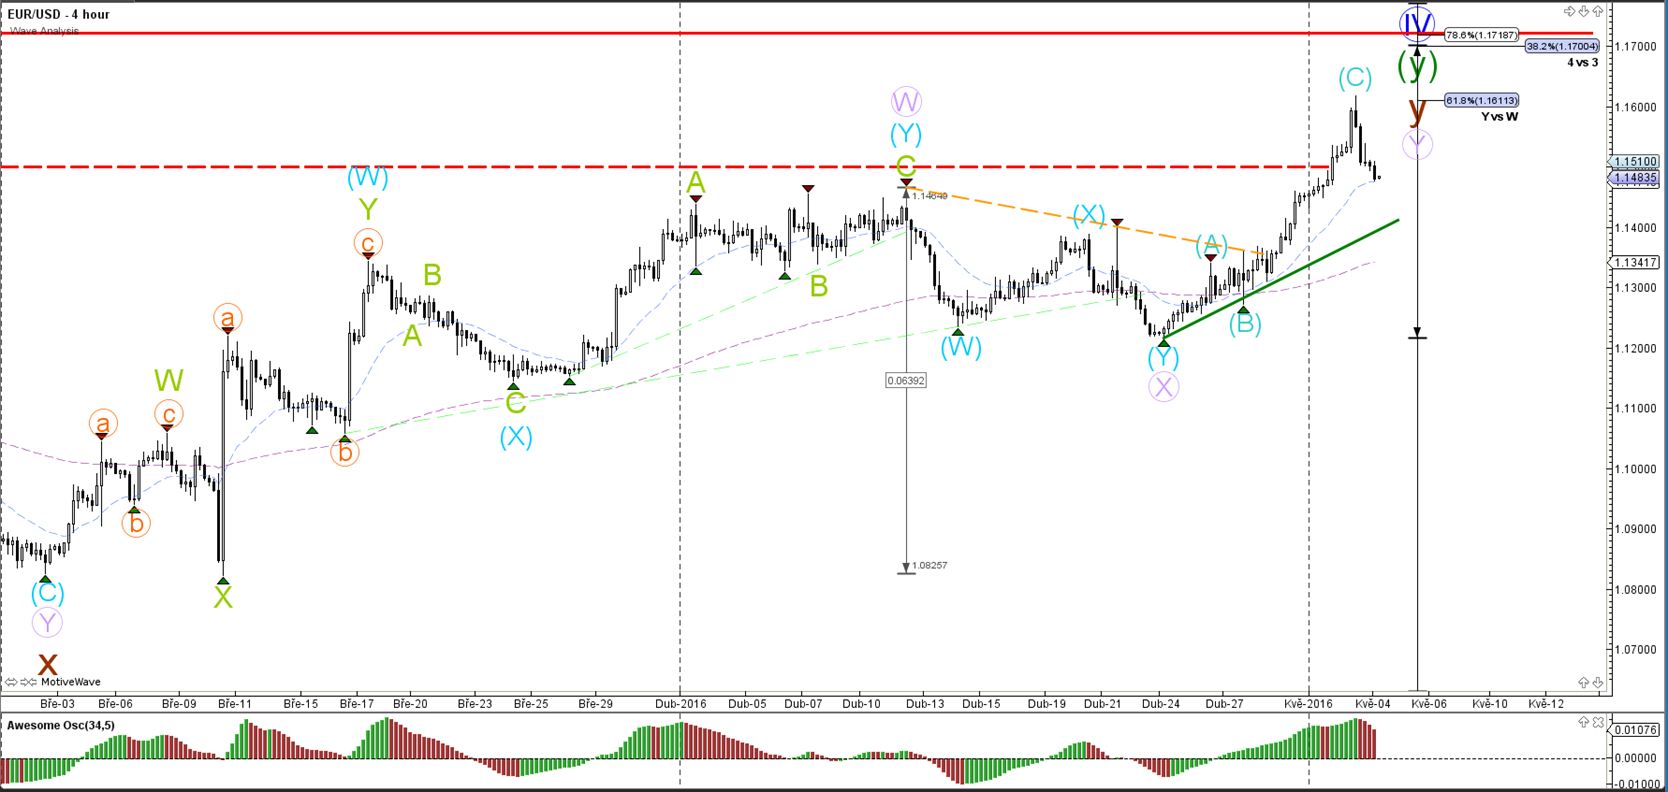
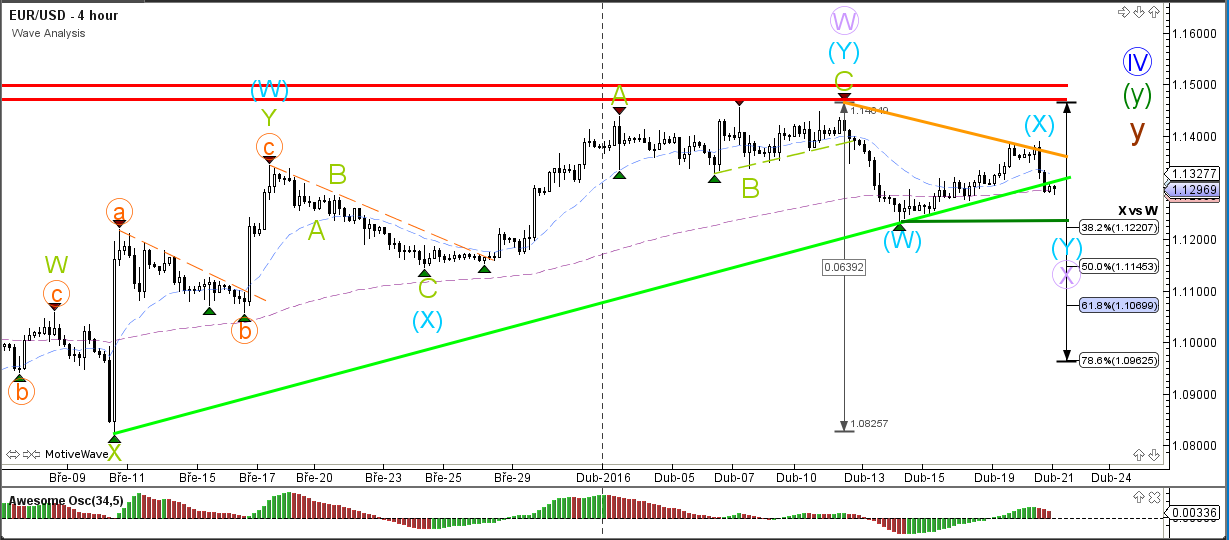
EUR/USD
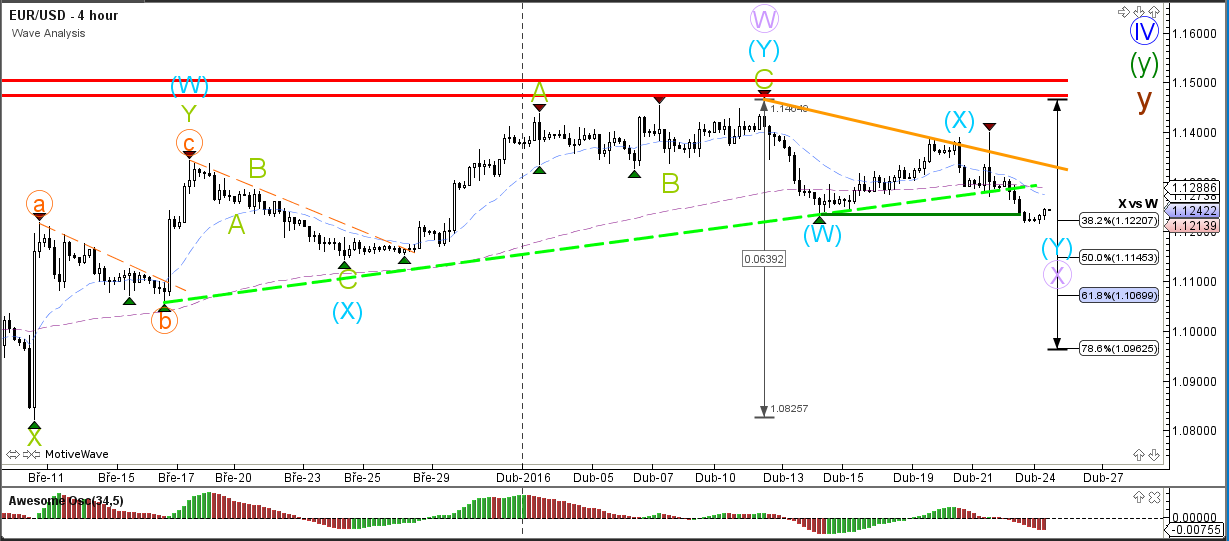
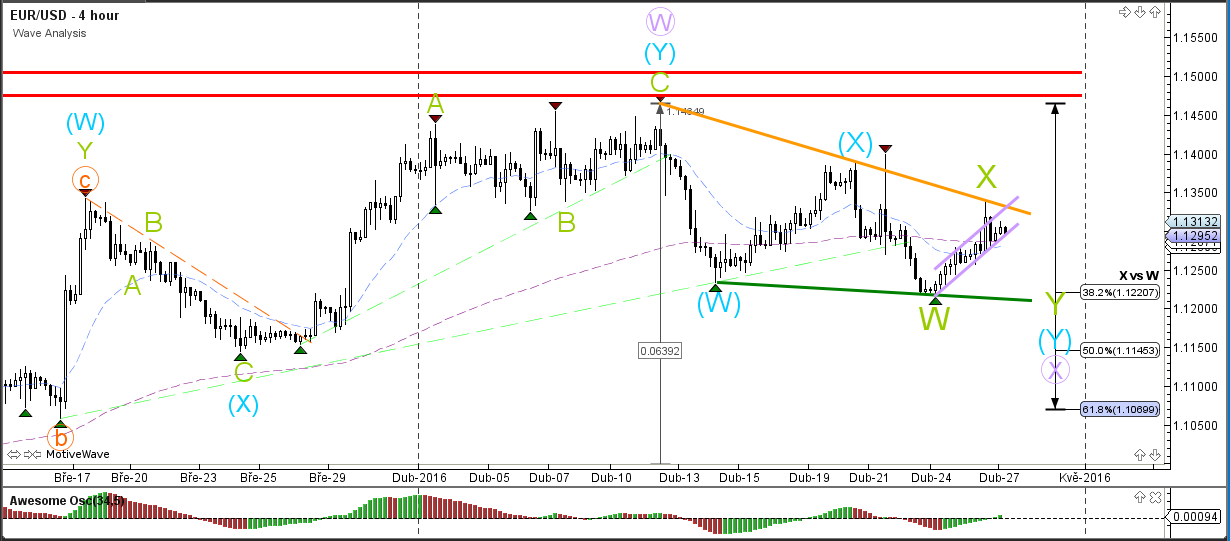
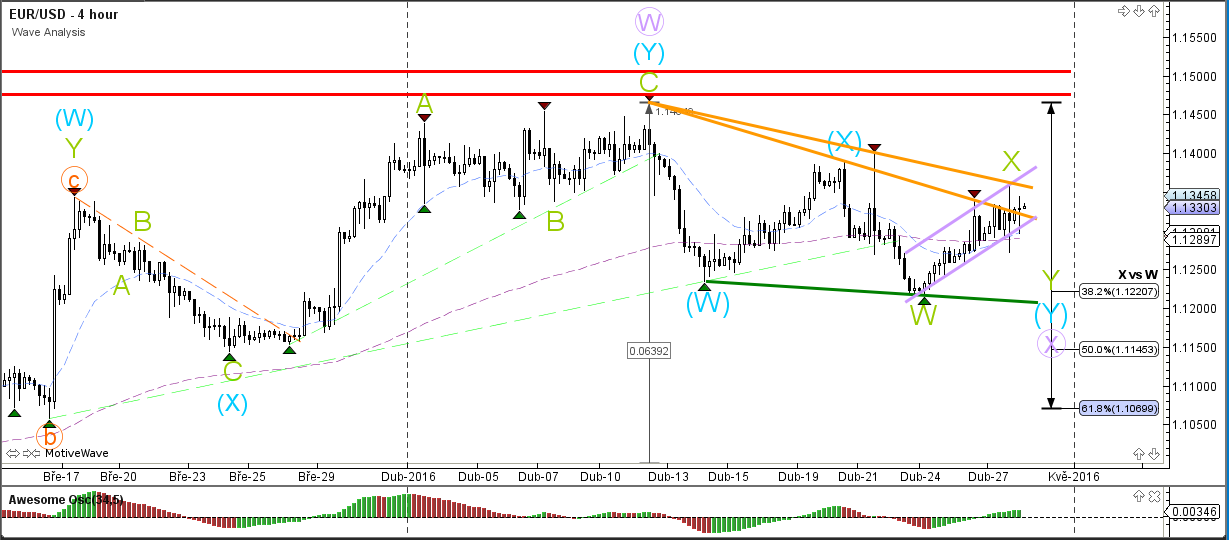
4 hour

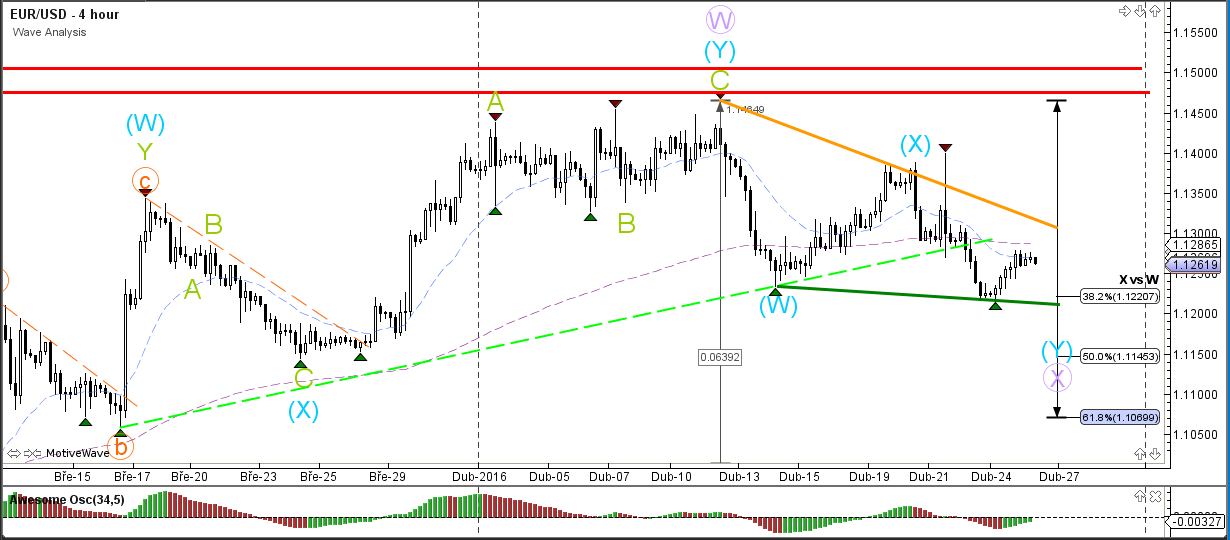
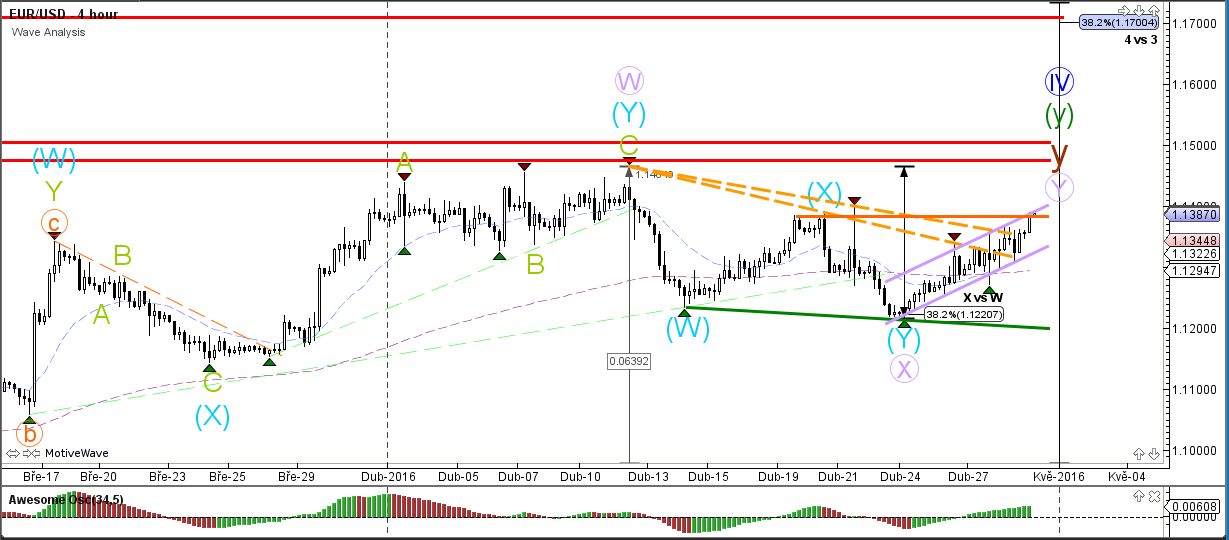
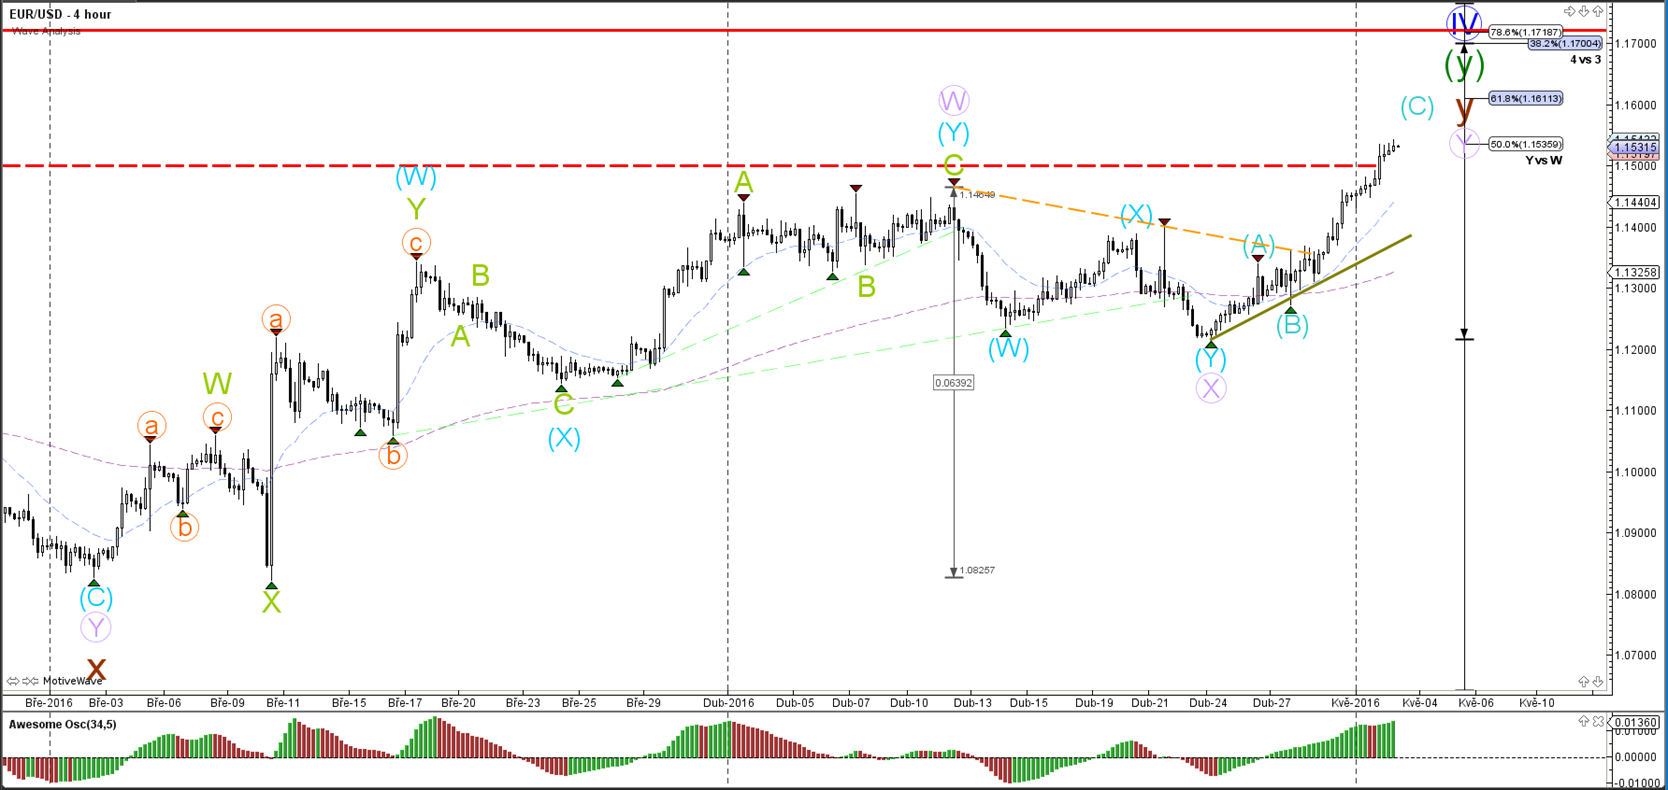
The EUR/USD is unable to break above the 1.14 resistance level. Support (green) and resistance (orange) trend lines mark the boundaries and breakout territory. A push below the 50% Fibonacci retracement level of wave X (purple) makes the current wave count less likely and a bearish variant more likely.
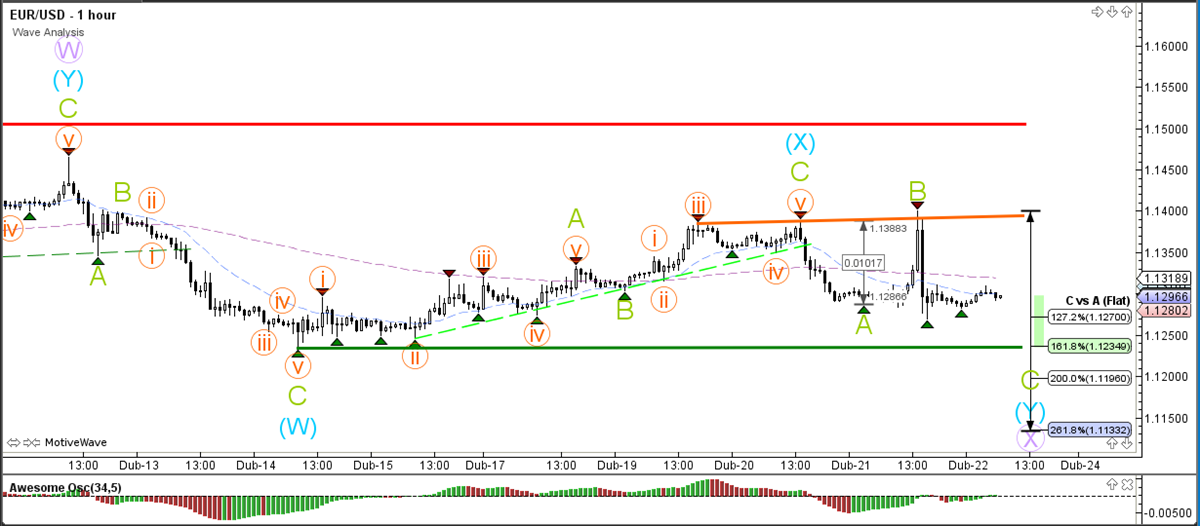
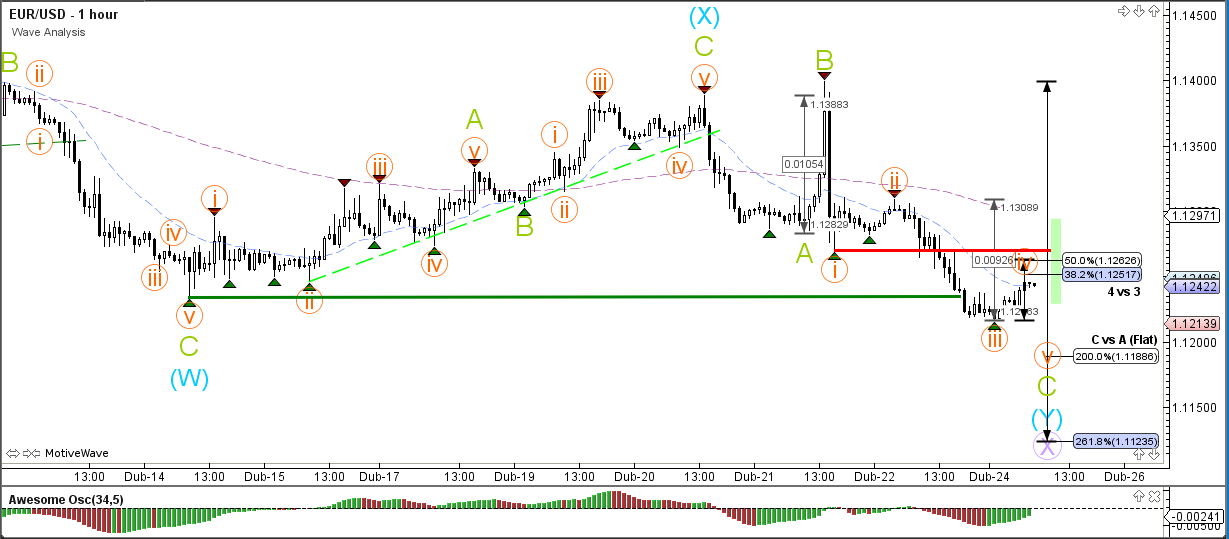
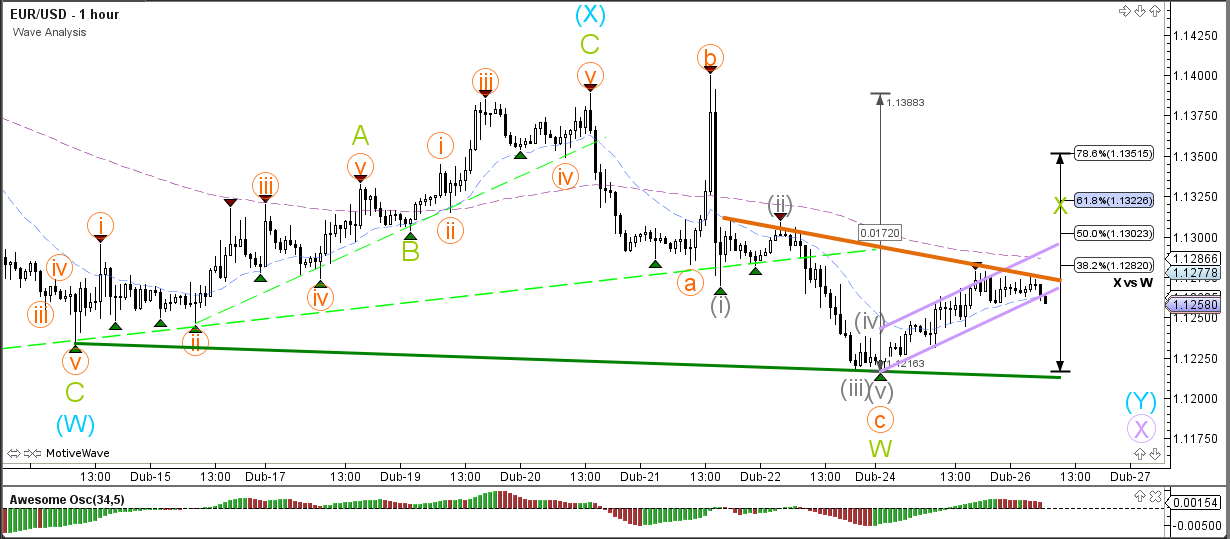
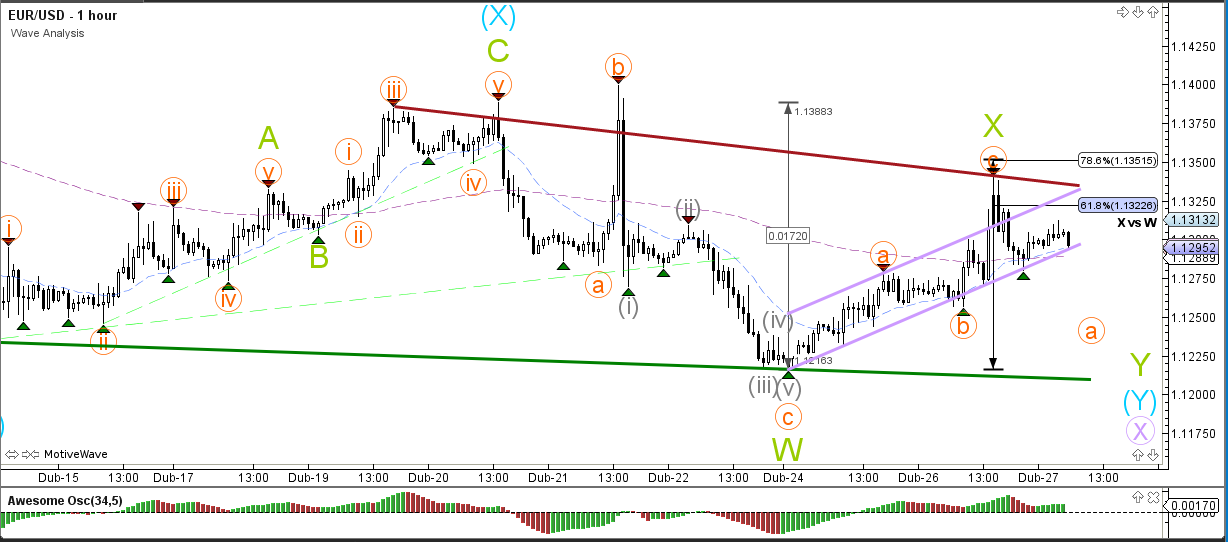
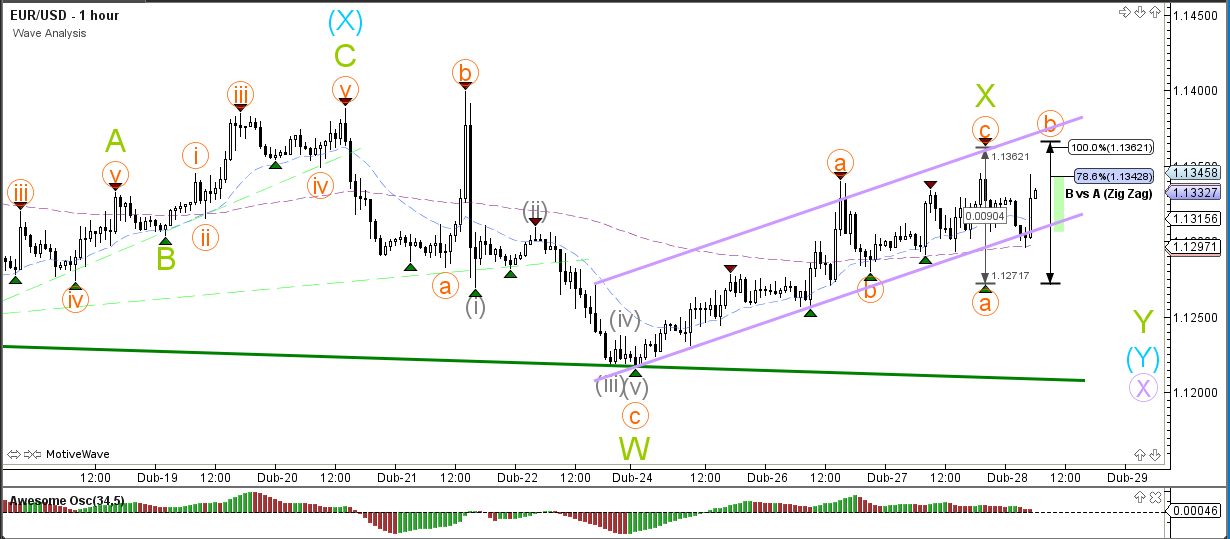
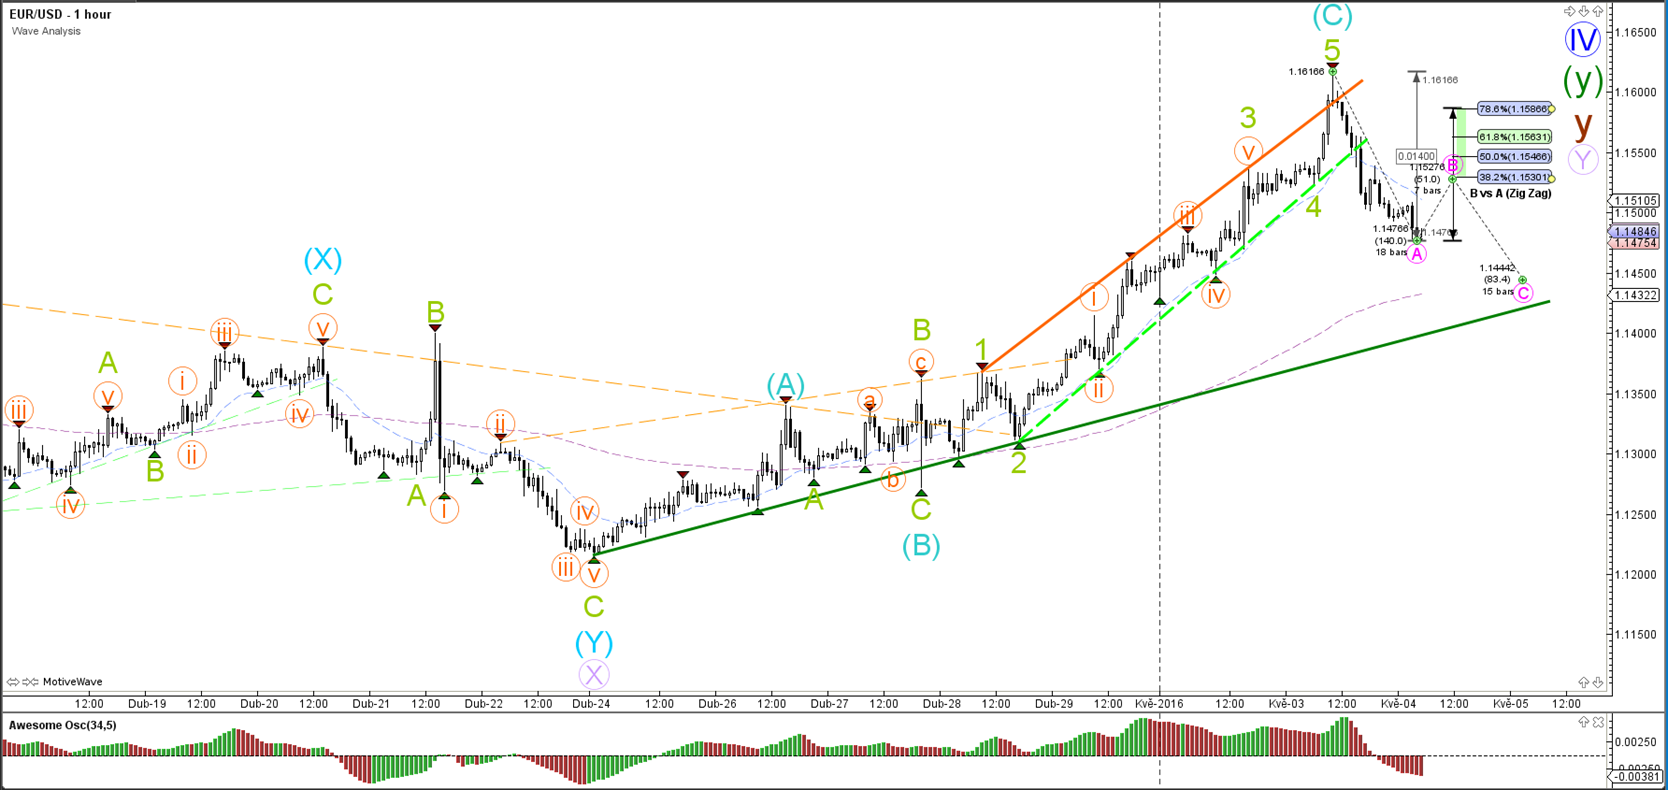
1 hour

The EUR/USD break of support (dotted green) increases the chance of a bearish ABC zigzag (green).
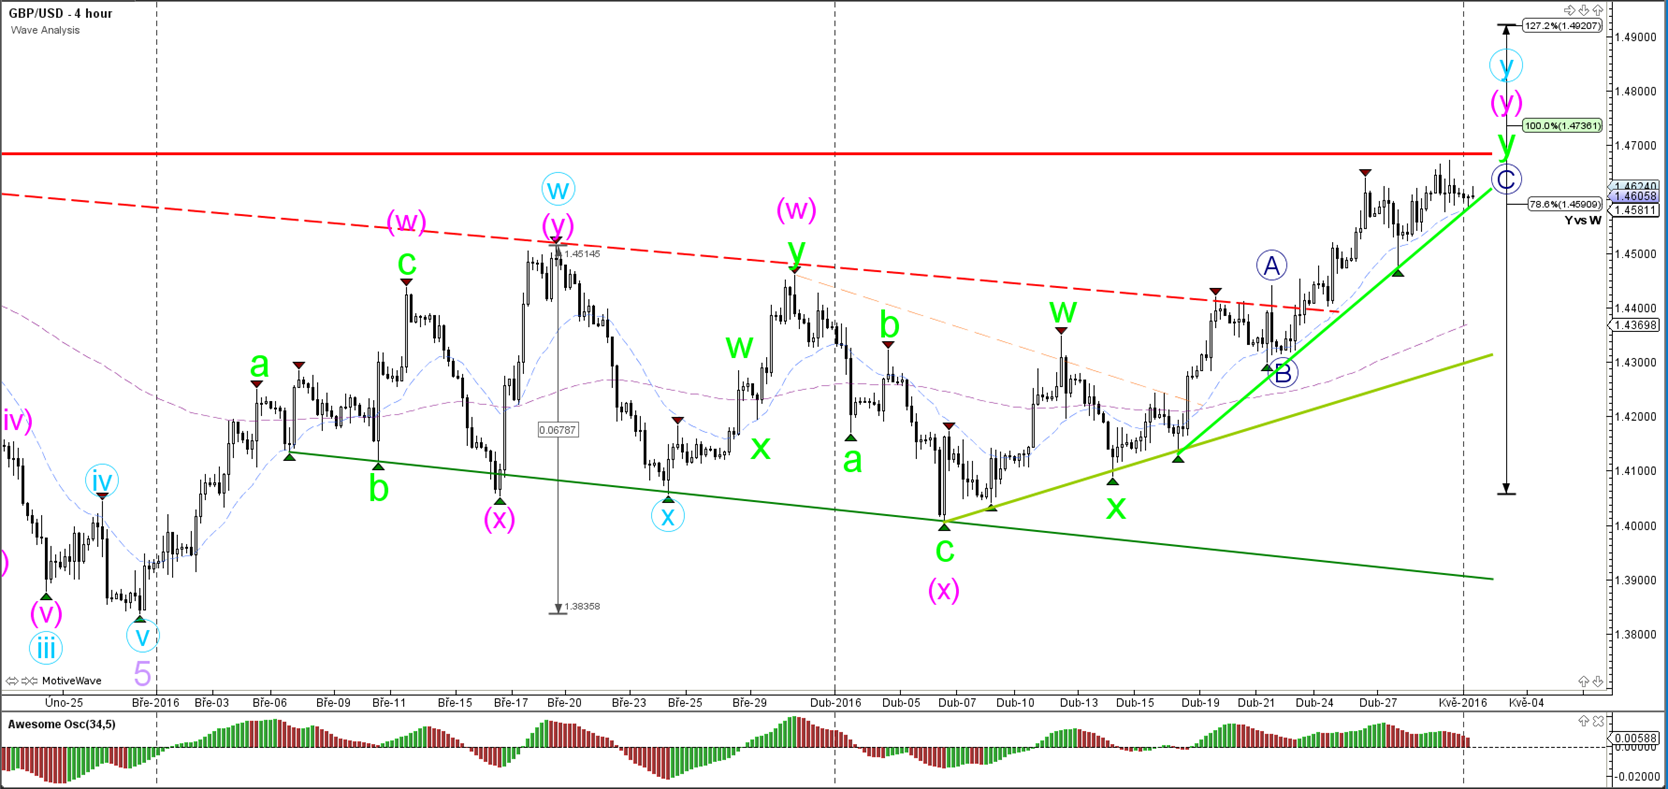
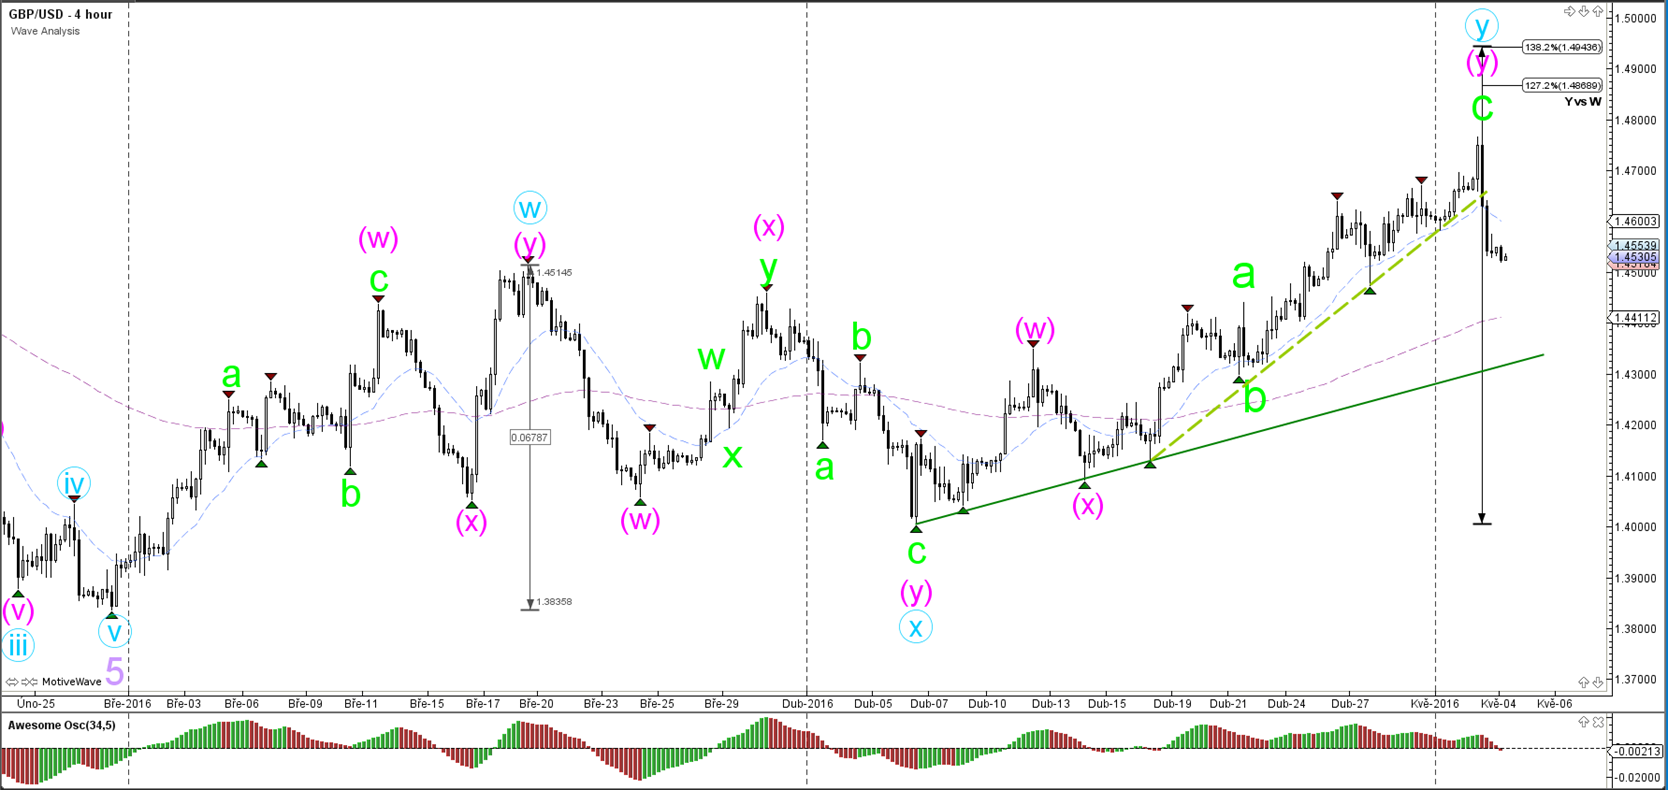
GBP/USD
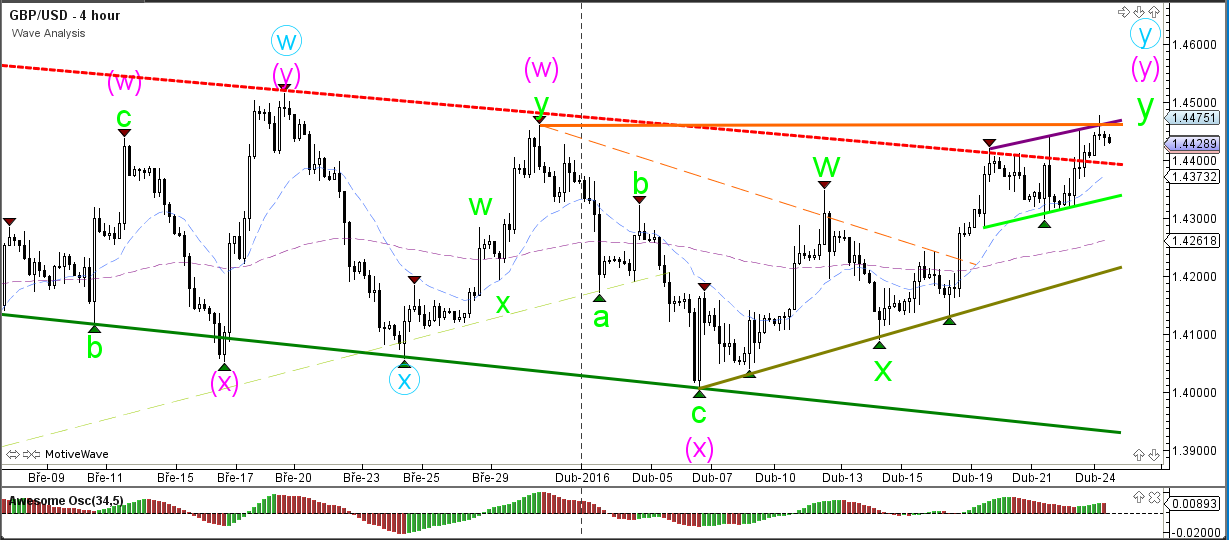
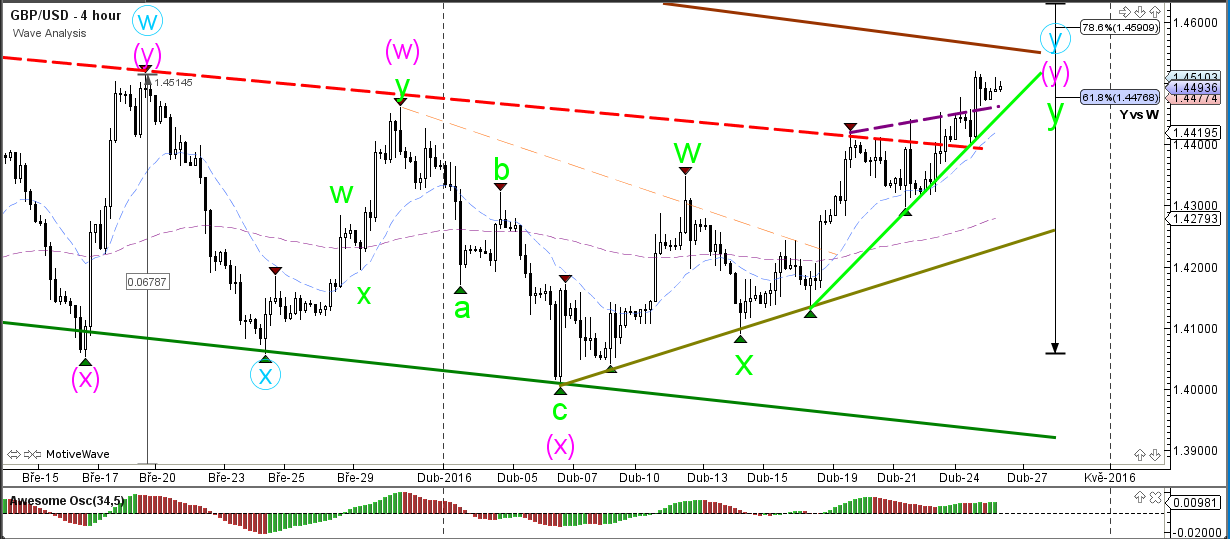
4 hour

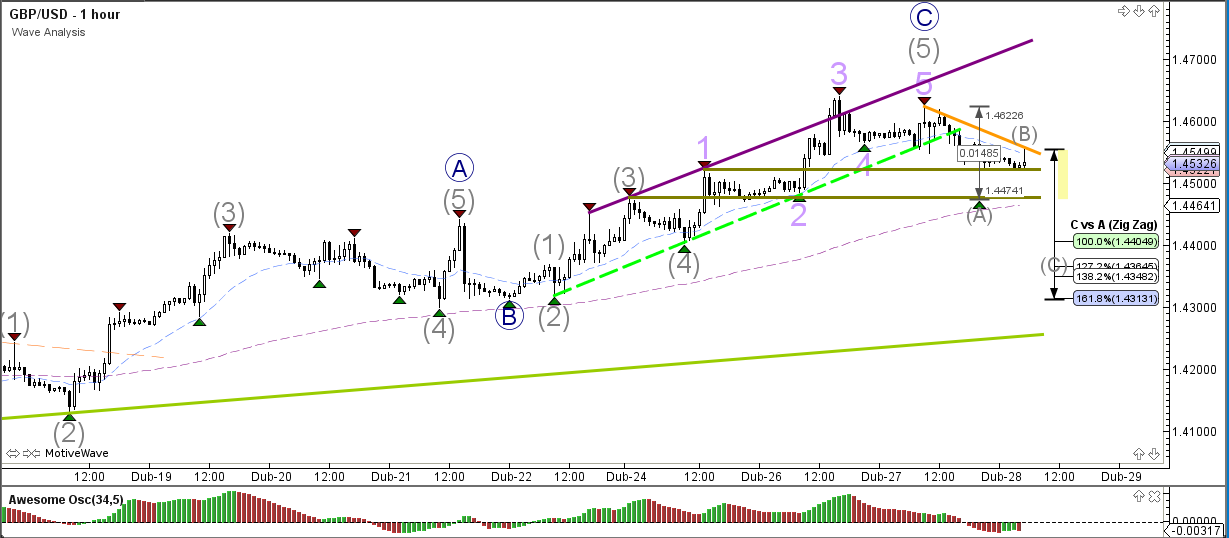
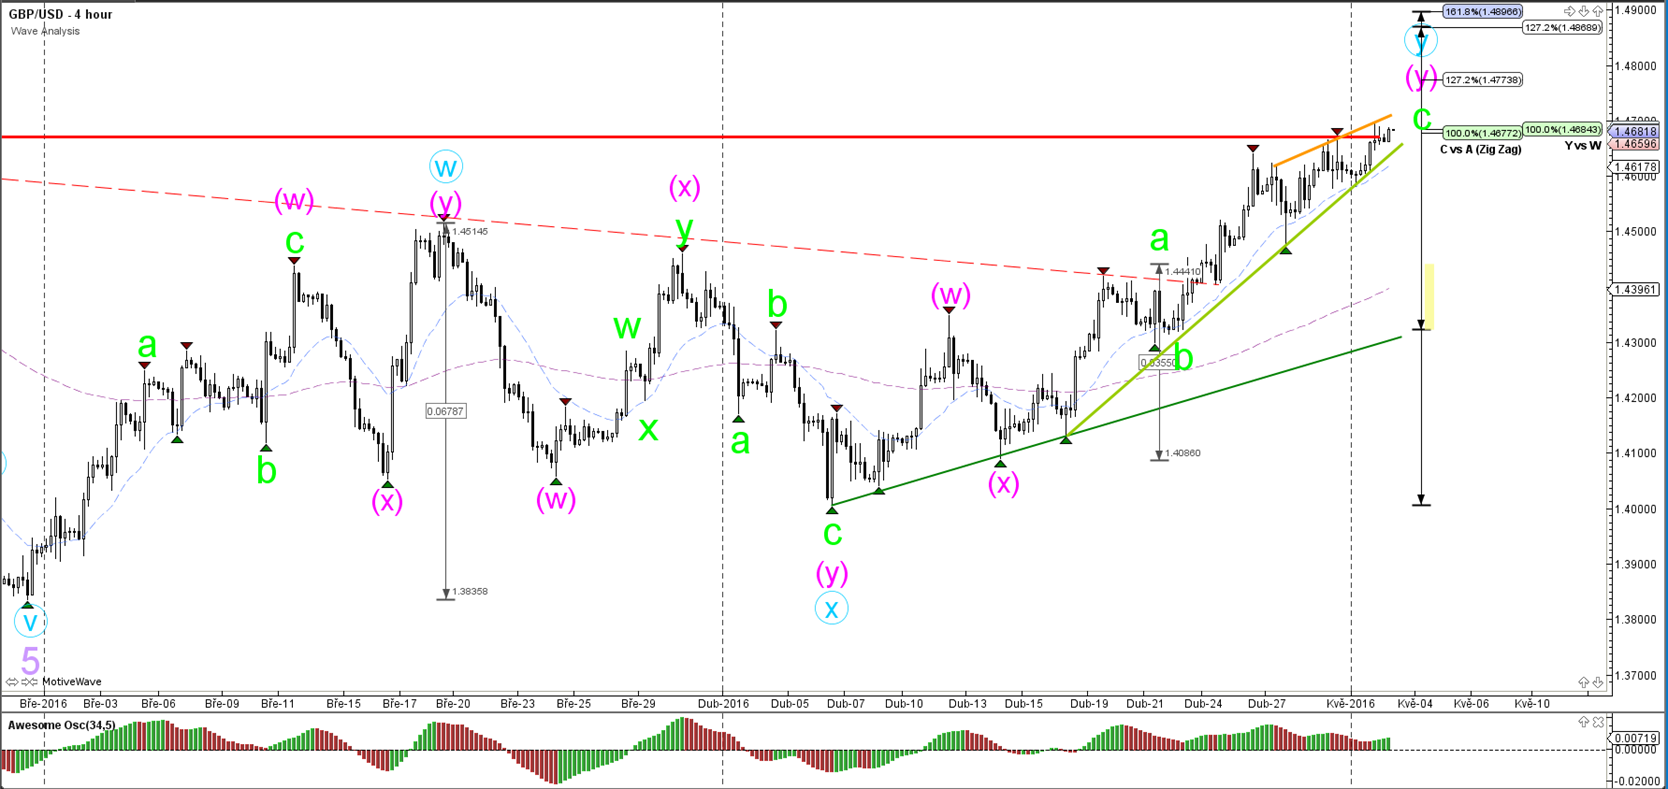
The GBP/USD is not able to break the resistance trend line (orange) and 100% Fibonacci target, which could be a bounce or break spot.
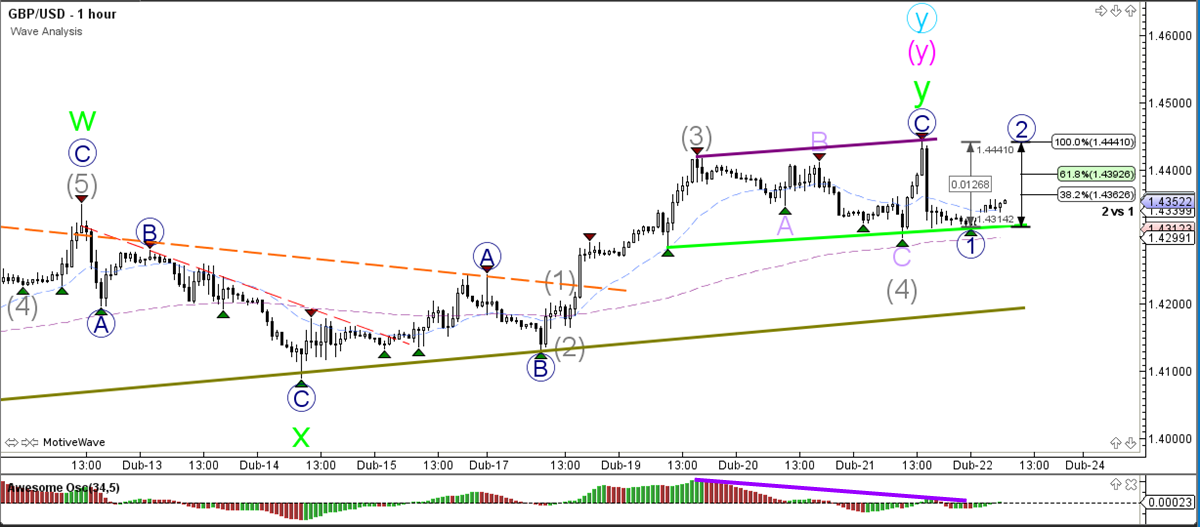
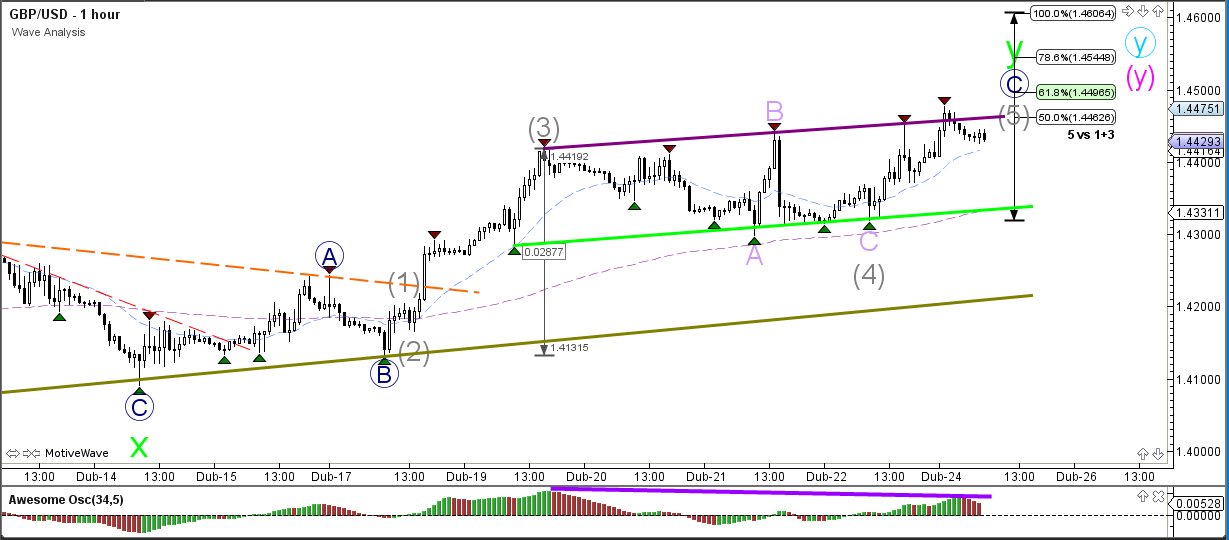
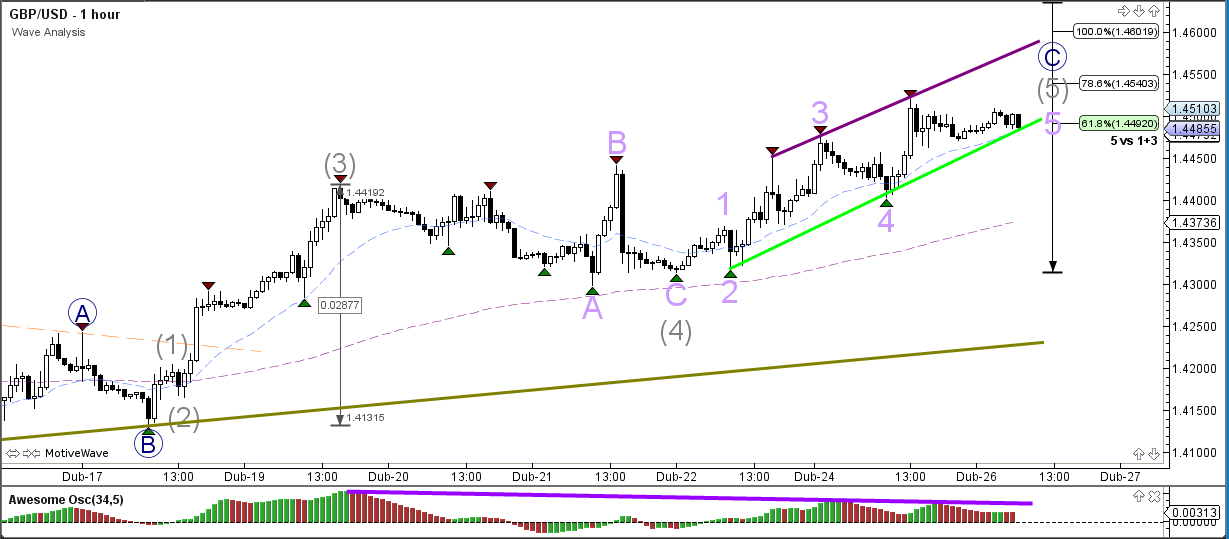
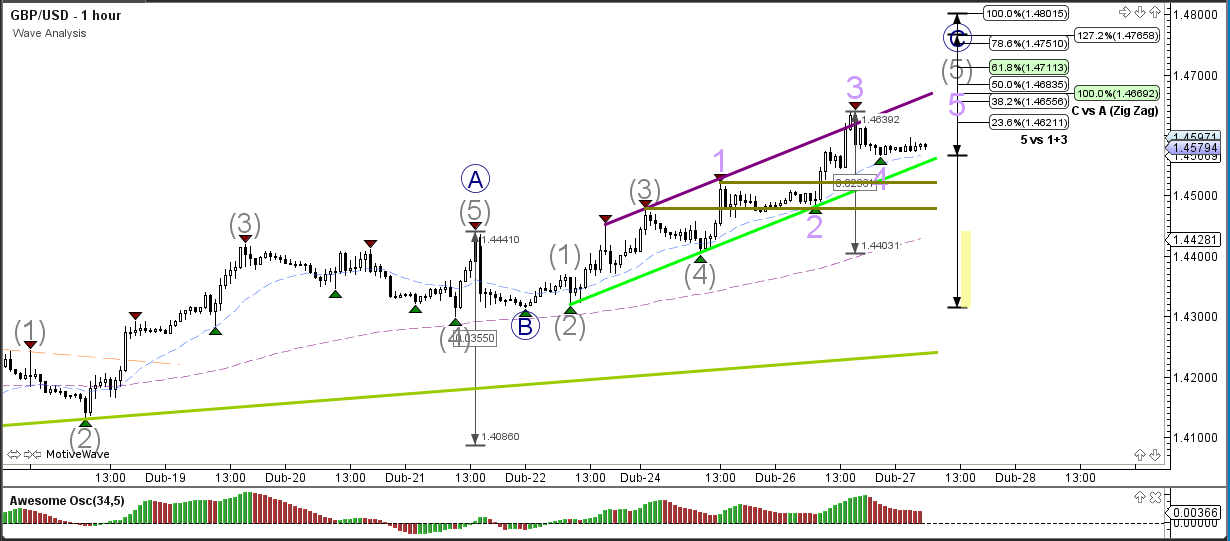
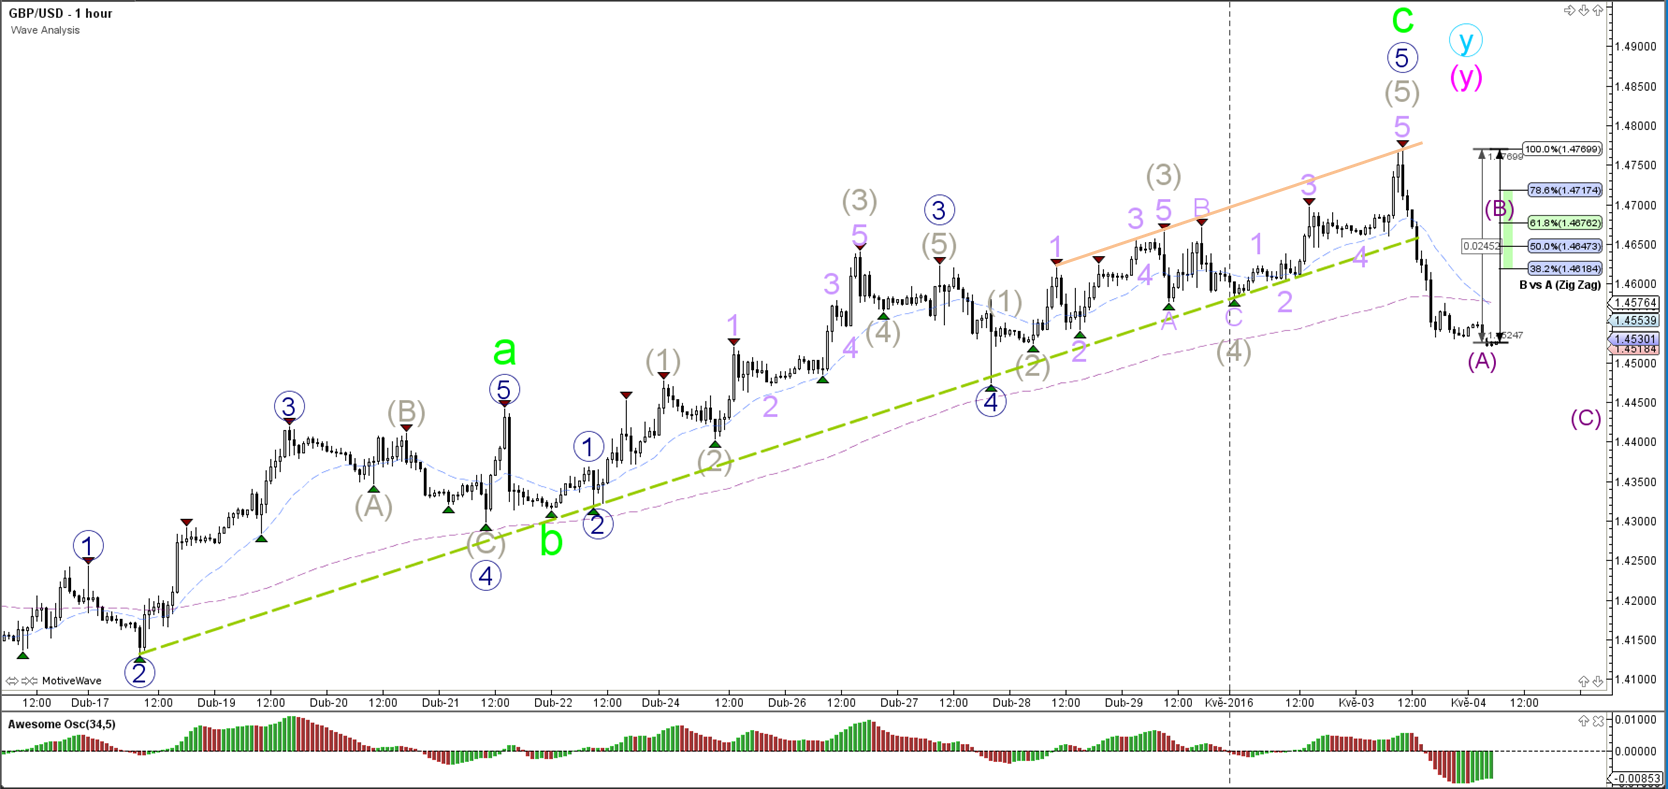
1 hour

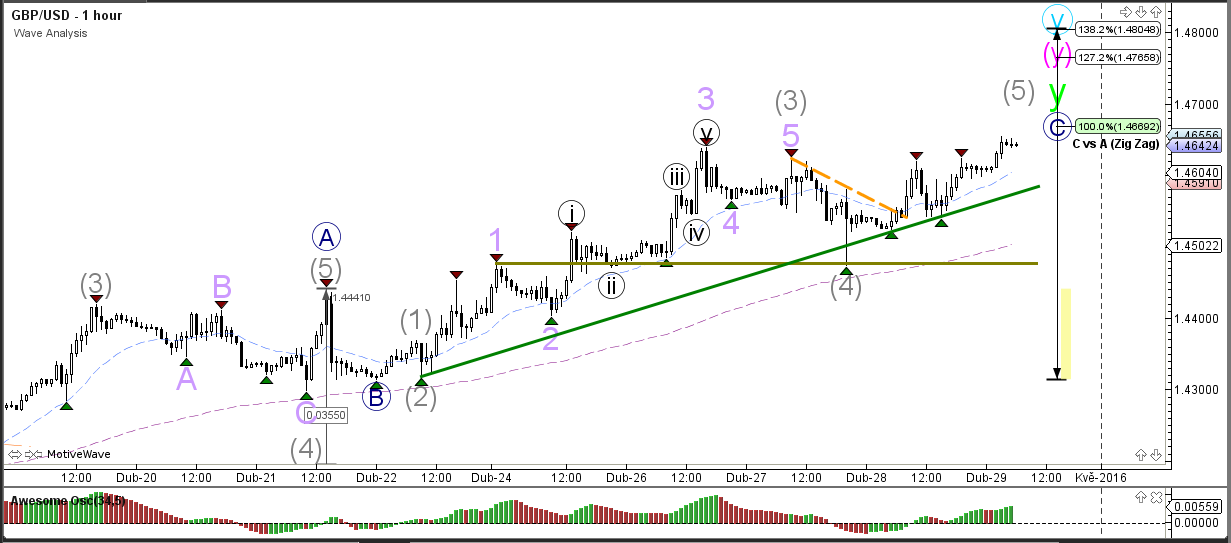
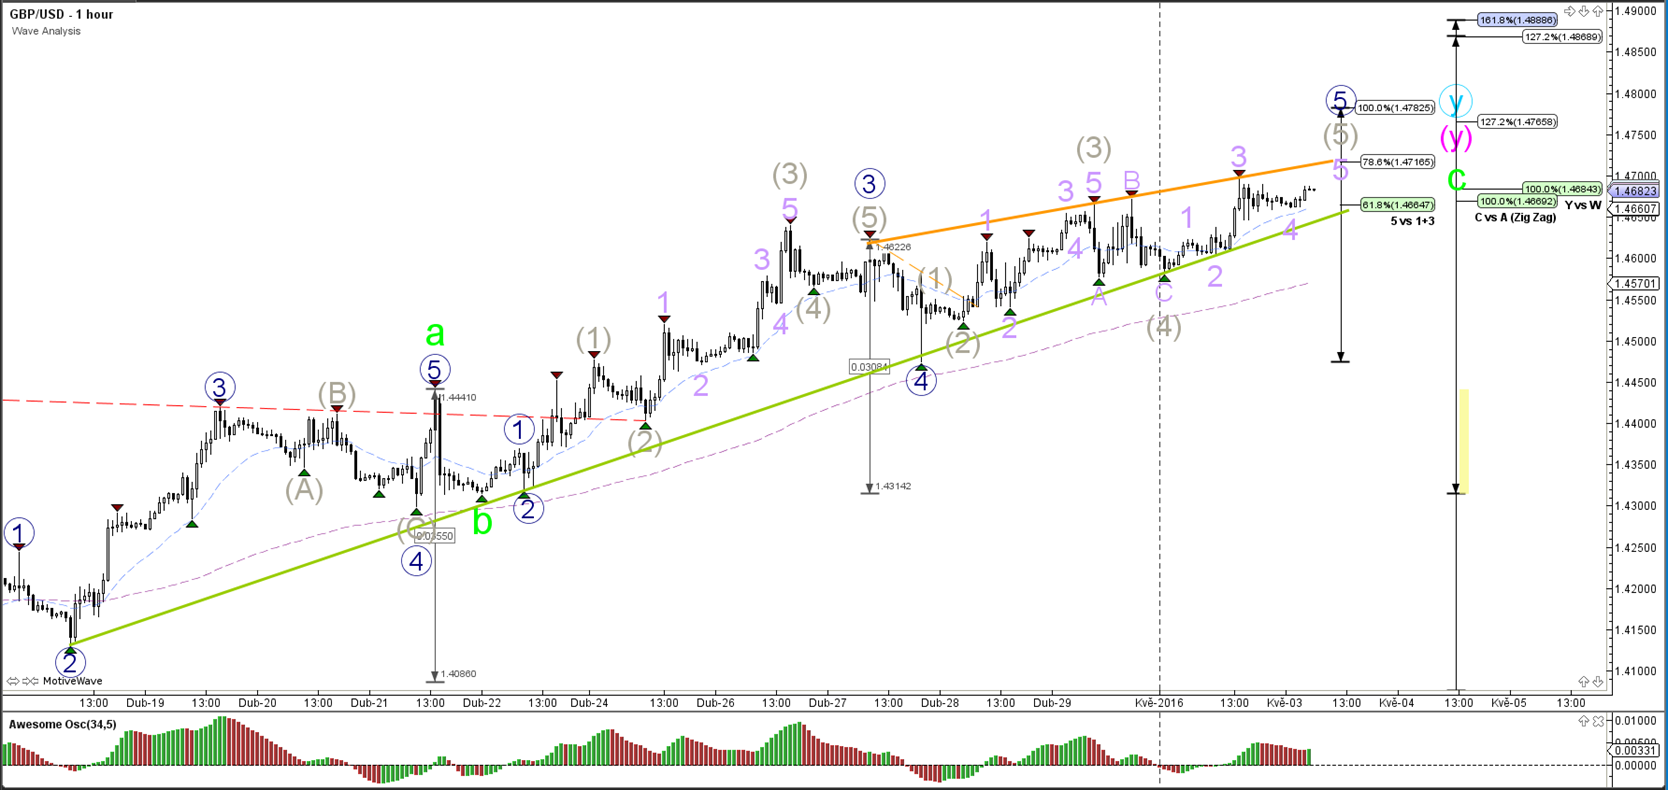
The GBP/USD could have one more bullish push remaining via a wave 5 (grey). A break below the 50% or 61.8% Fibonacci retracement level would make such a wave 4 (grey) unlikely. For the moment price is respecting the 38.2% Fibonacci level.
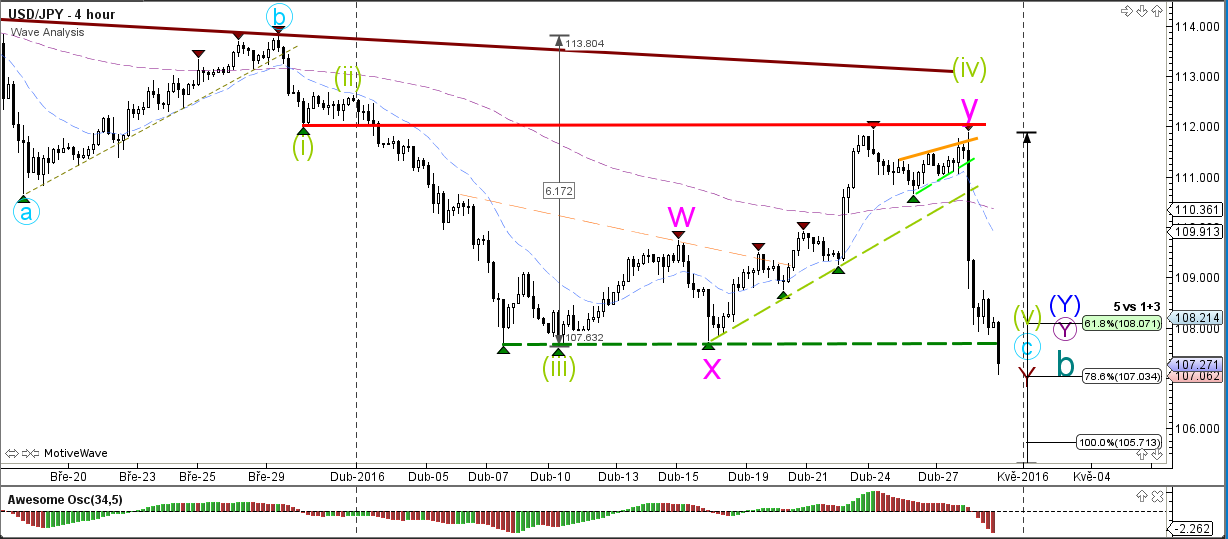
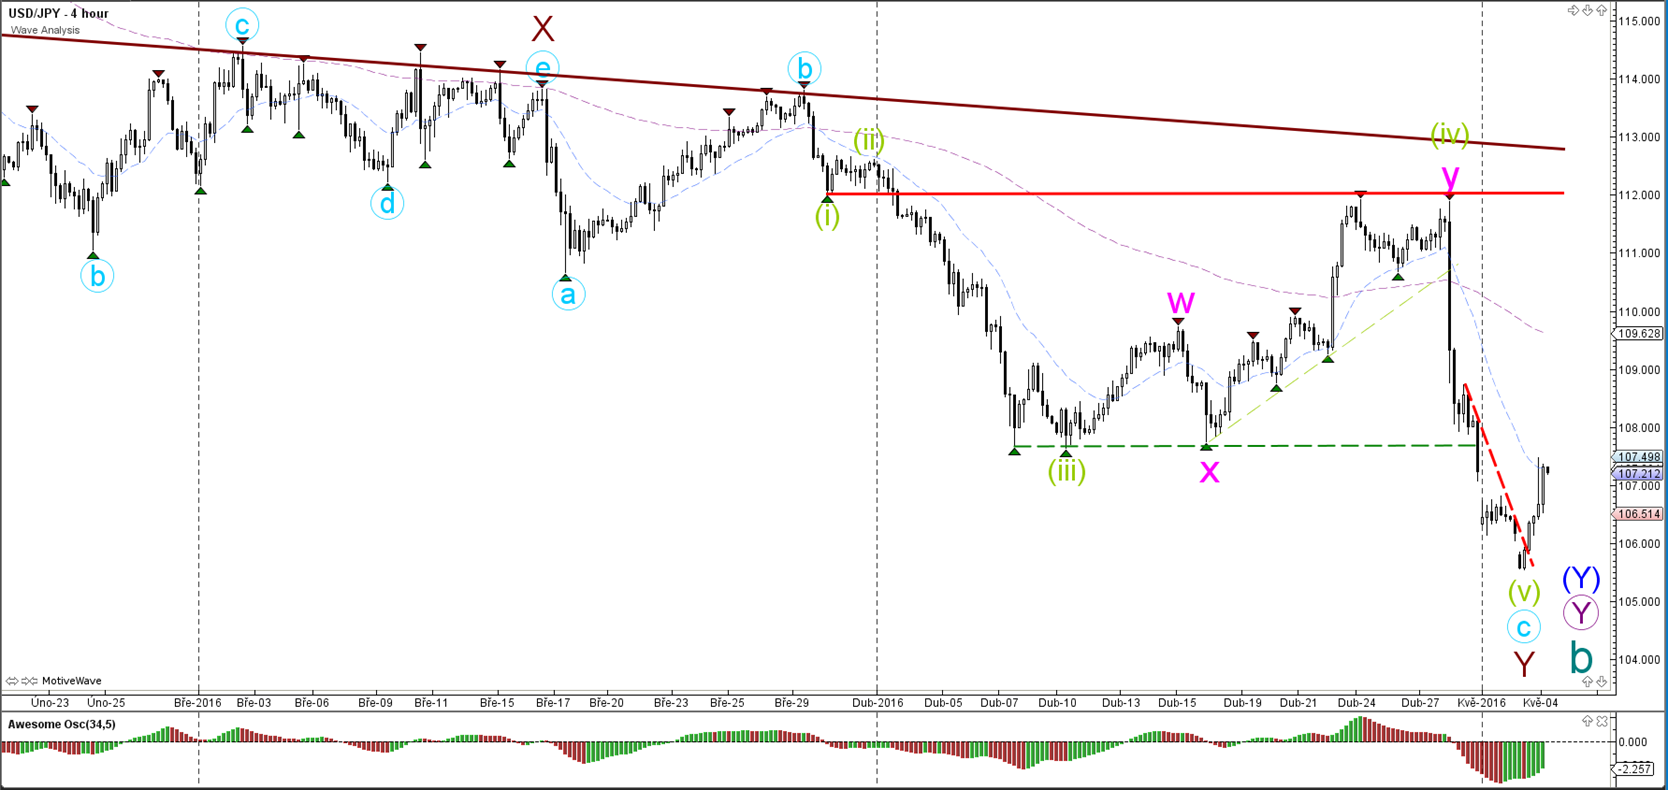
USD/JPY
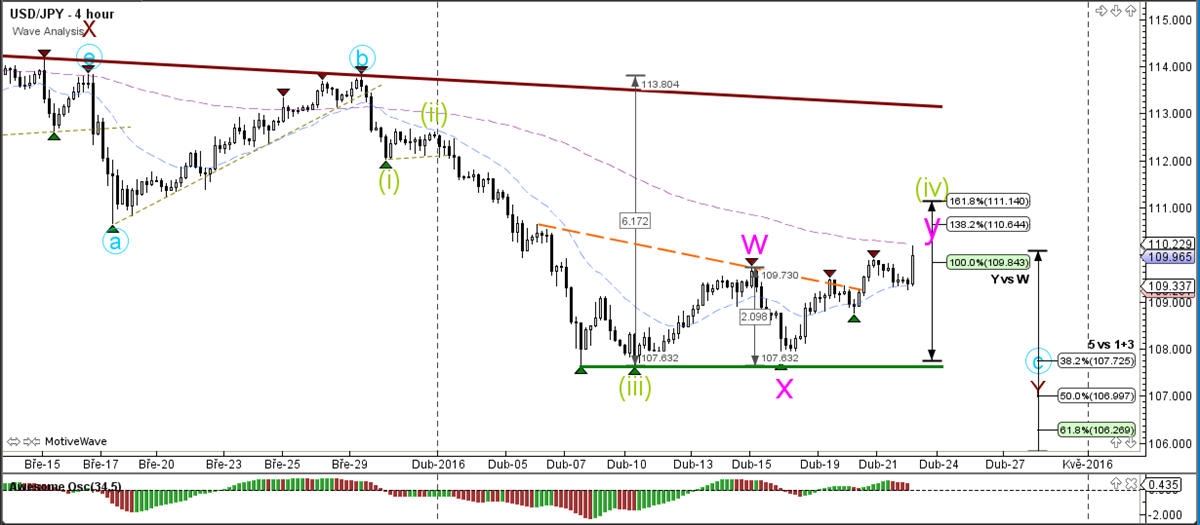
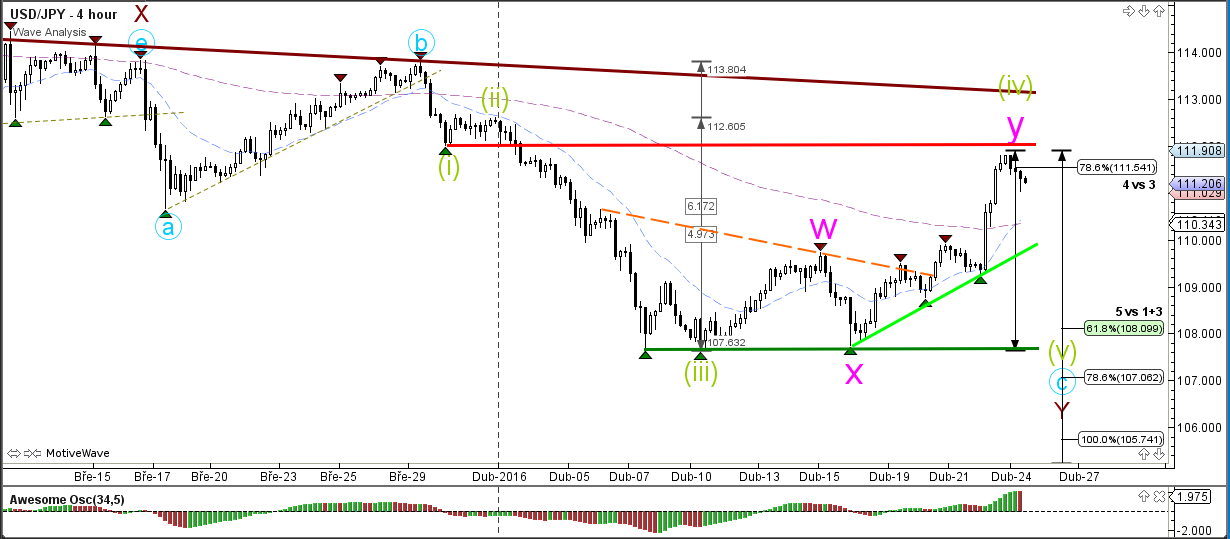
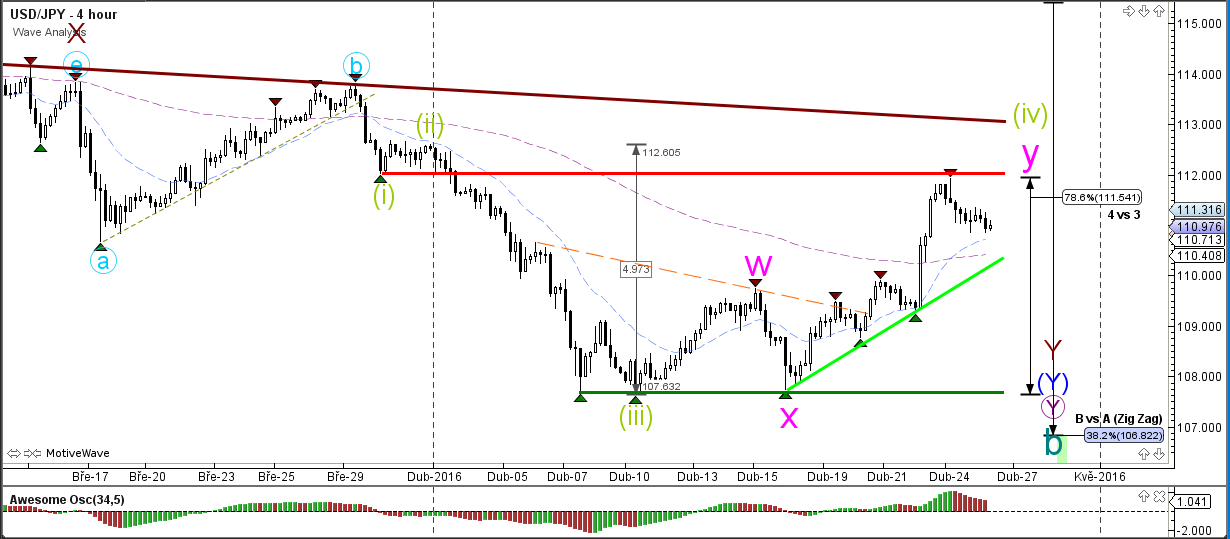
4 hour

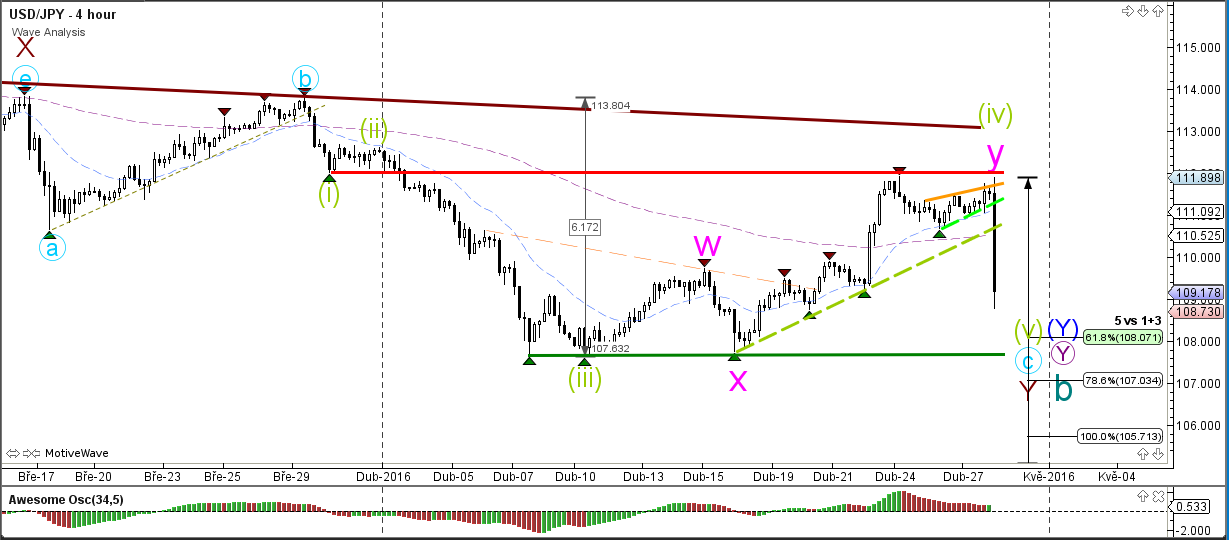
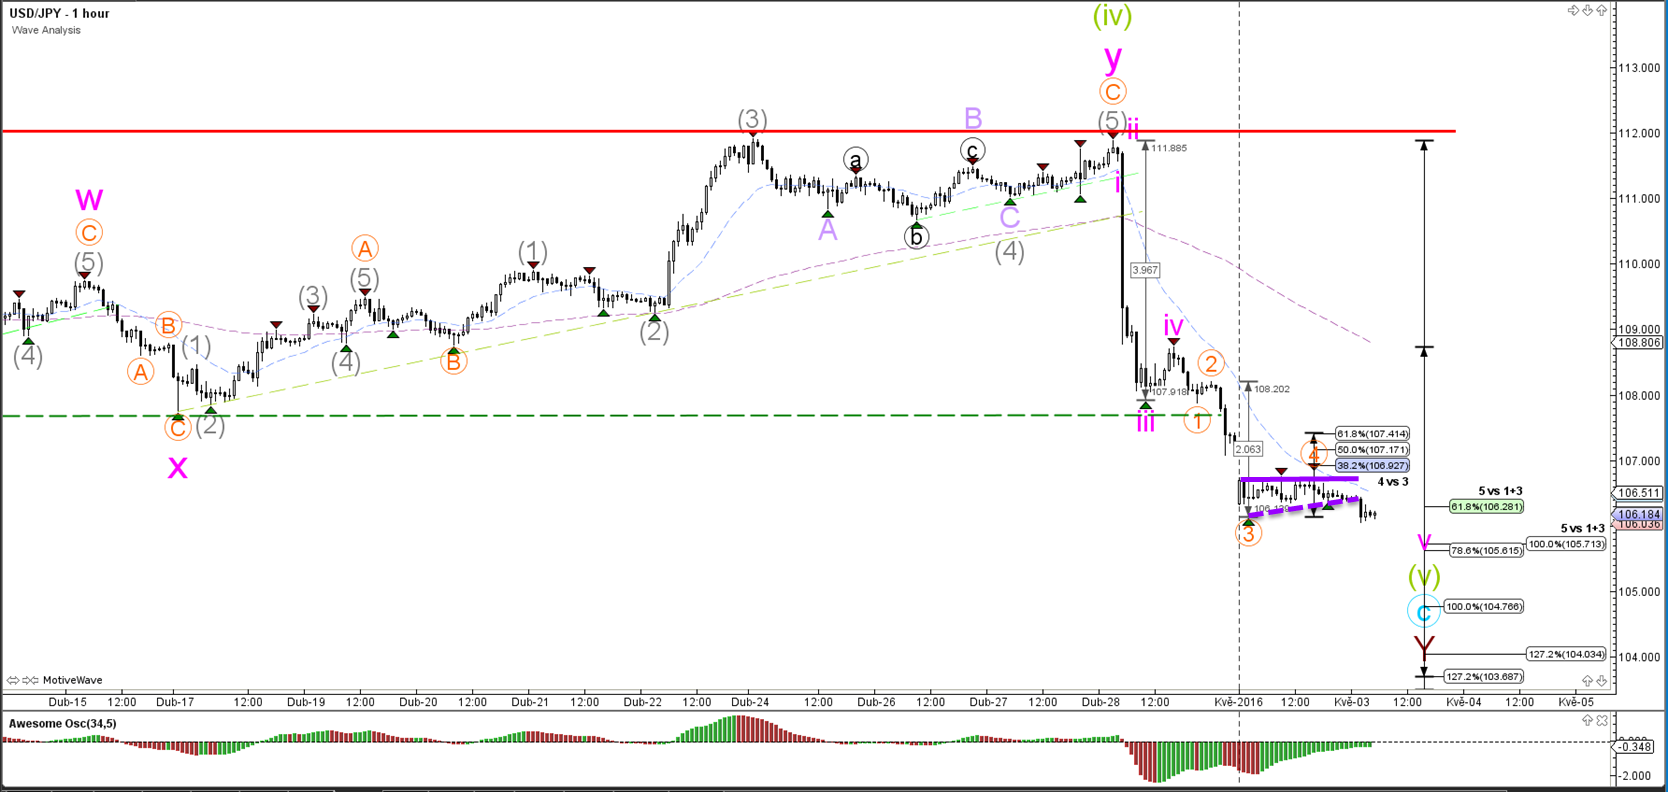
The USD/JPY has broken the resistance trend line (red) and is now heading towards the Fibonacci targets of the wave 4 (green) correction.
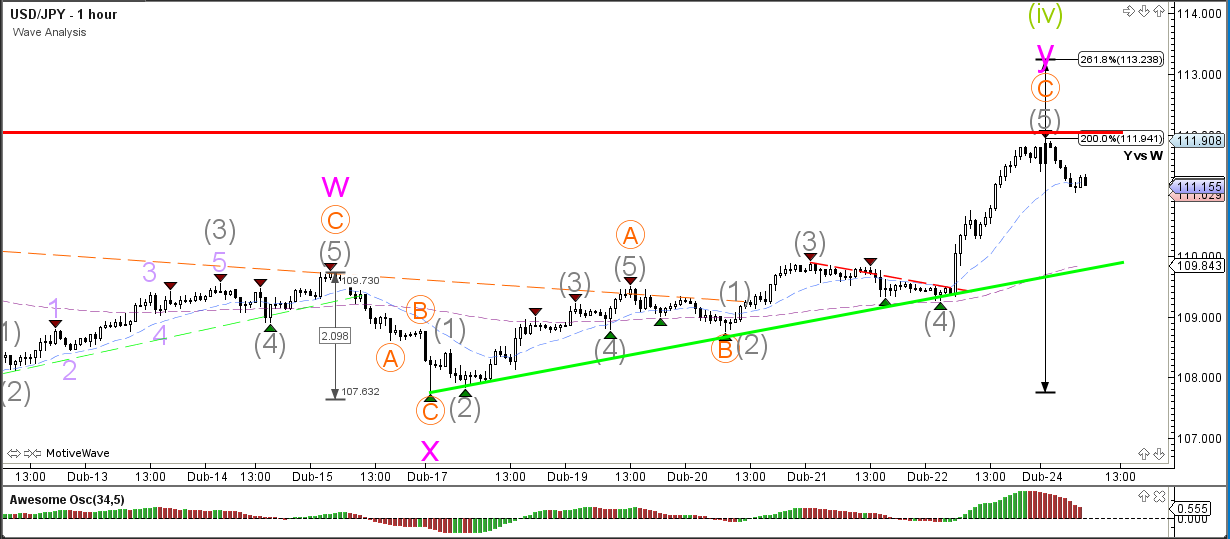
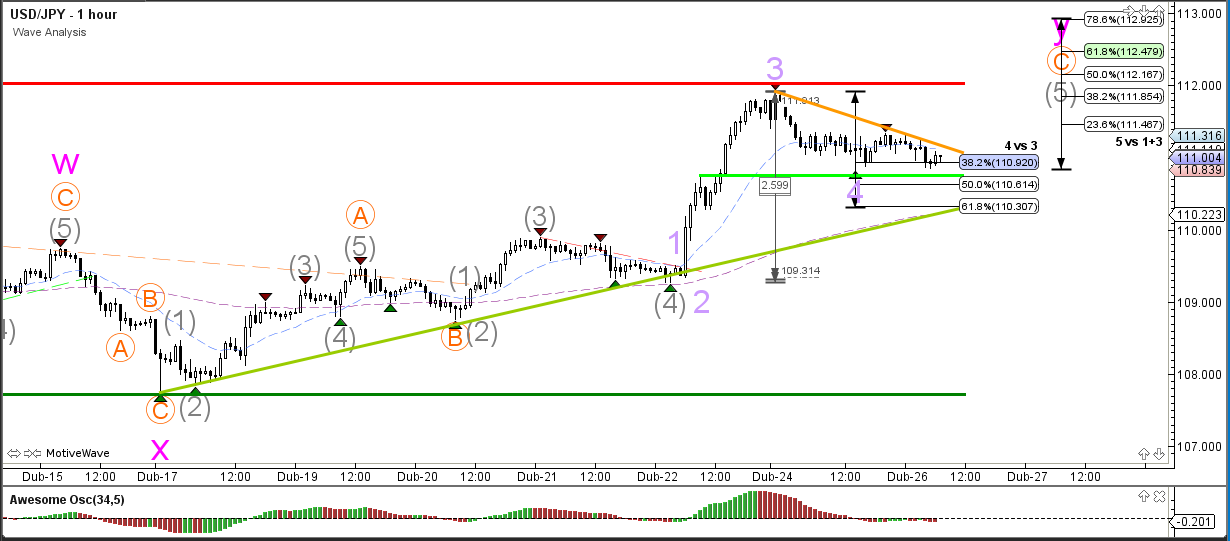
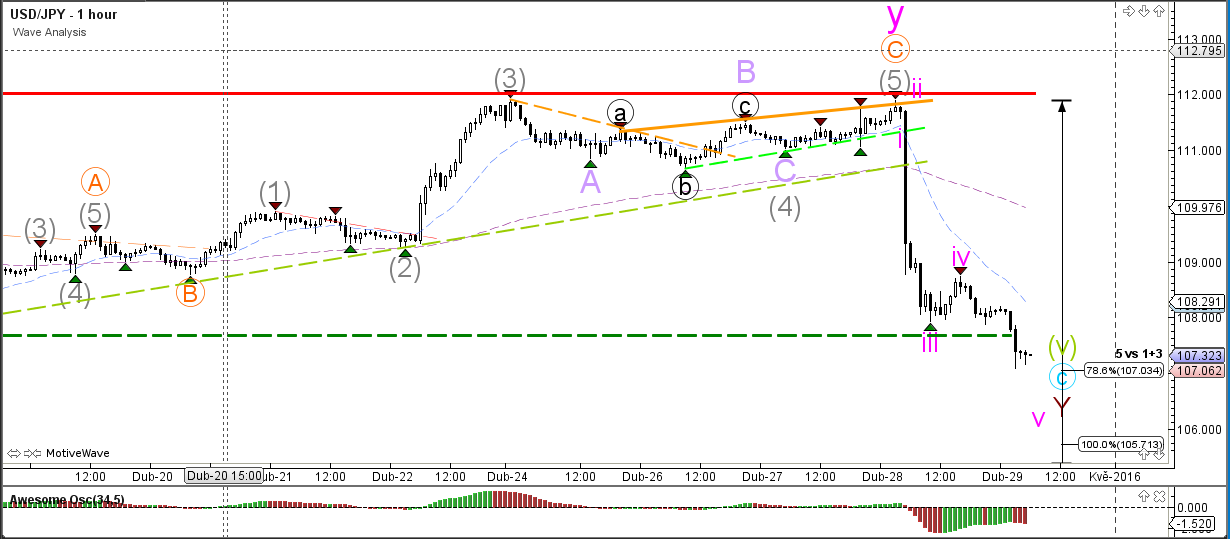
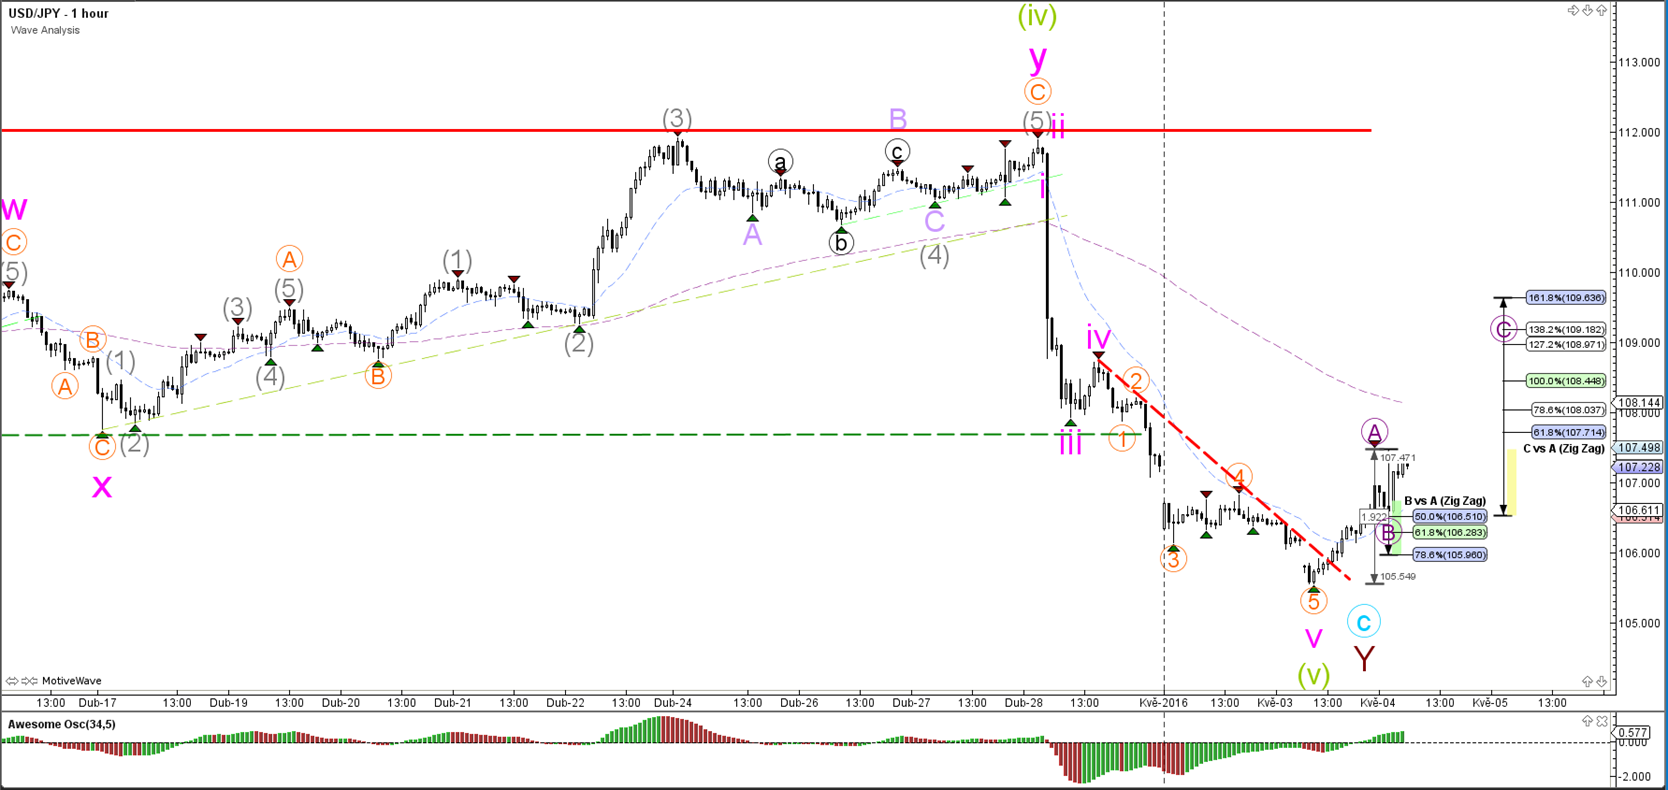
1 hour

The USD/JPY bullish break indicates a continuation of the bullish ABC (orange) zigzag.
“Original analysis is provided by Admiral Markets”
EUR/USD
4 hour
The EUR/USD is unable to break above the 1.14 resistance level. Support (green) and resistance (orange) trend lines mark the boundaries and breakout territory. A push below the 50% Fibonacci retracement level of wave X (purple) makes the current wave count less likely and a bearish variant more likely.
1 hour

The EUR/USD break of support (dotted green) increases the chance of a bearish ABC zigzag (green).
GBP/USD
4 hour

The GBP/USD is not able to break the resistance trend line (orange) and 100% Fibonacci target, which could be a bounce or break spot.
1 hour

The GBP/USD could have one more bullish push remaining via a wave 5 (grey). A break below the 50% or 61.8% Fibonacci retracement level would make such a wave 4 (grey) unlikely. For the moment price is respecting the 38.2% Fibonacci level.
USD/JPY
4 hour

The USD/JPY has broken the resistance trend line (red) and is now heading towards the Fibonacci targets of the wave 4 (green) correction.
1 hour

The USD/JPY bullish break indicates a continuation of the bullish ABC (orange) zigzag.
“Original analysis is provided by Admiral Markets”