Admiral Markets
AdmiralMarkets.com Representative
- Messages
- 95
EUR/USD & GBP/USD at Invalidation Levels for Waves 2 & B
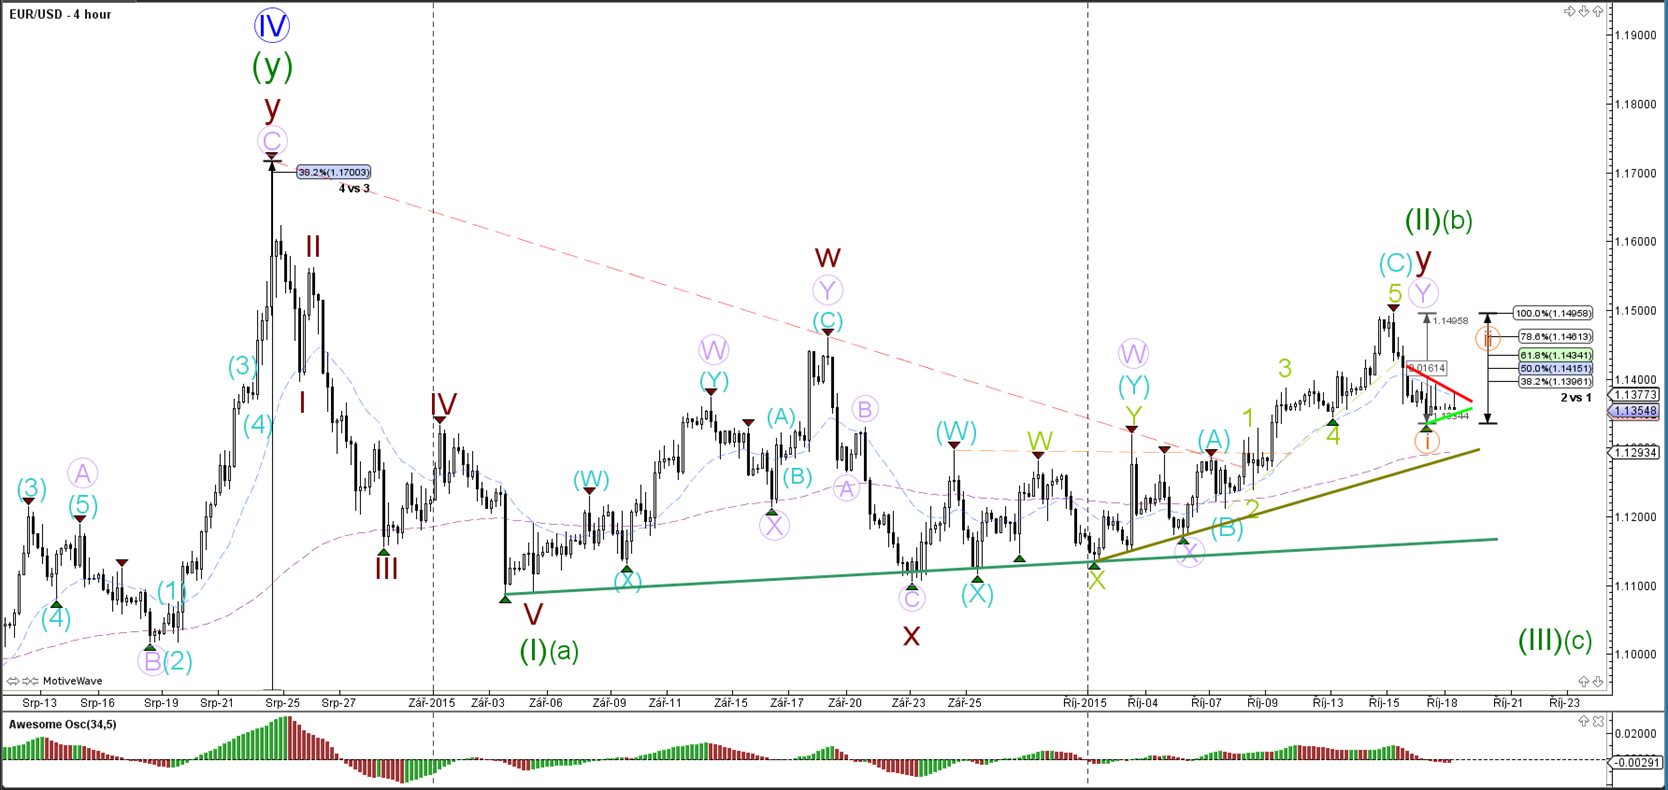
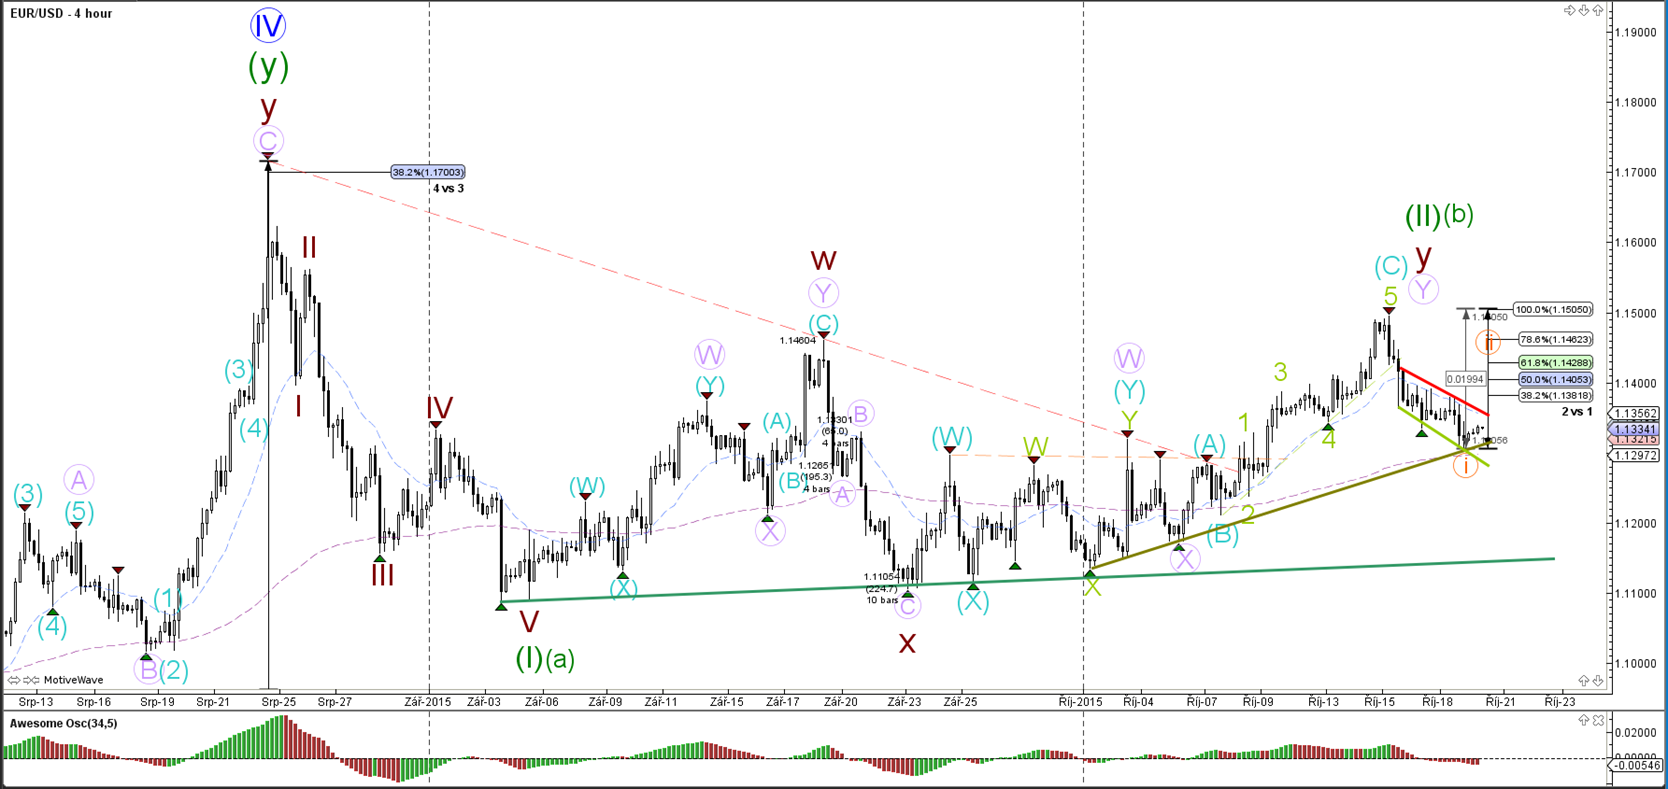
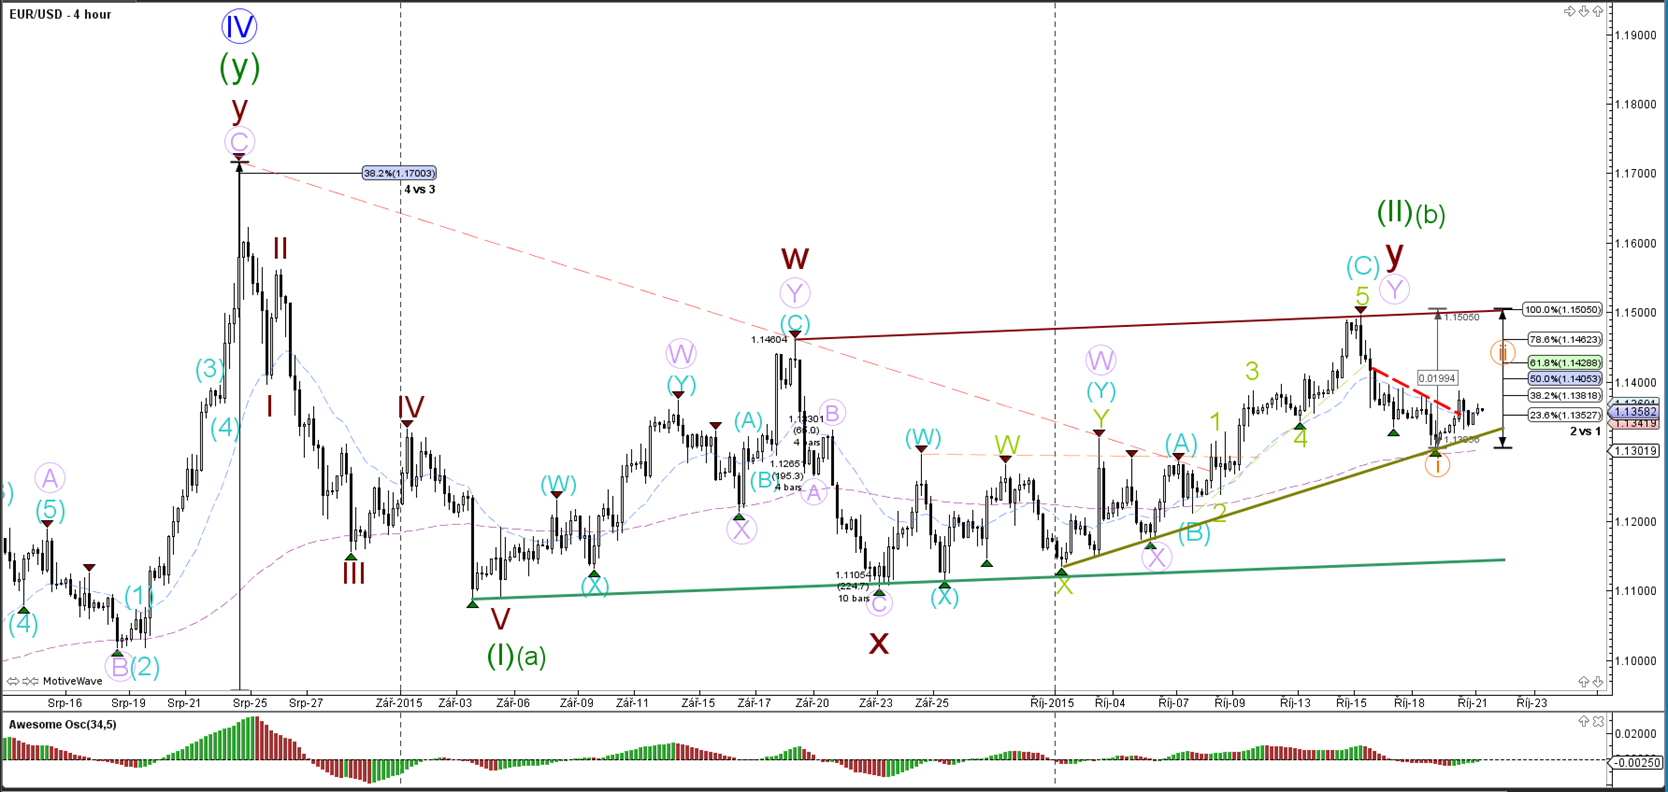
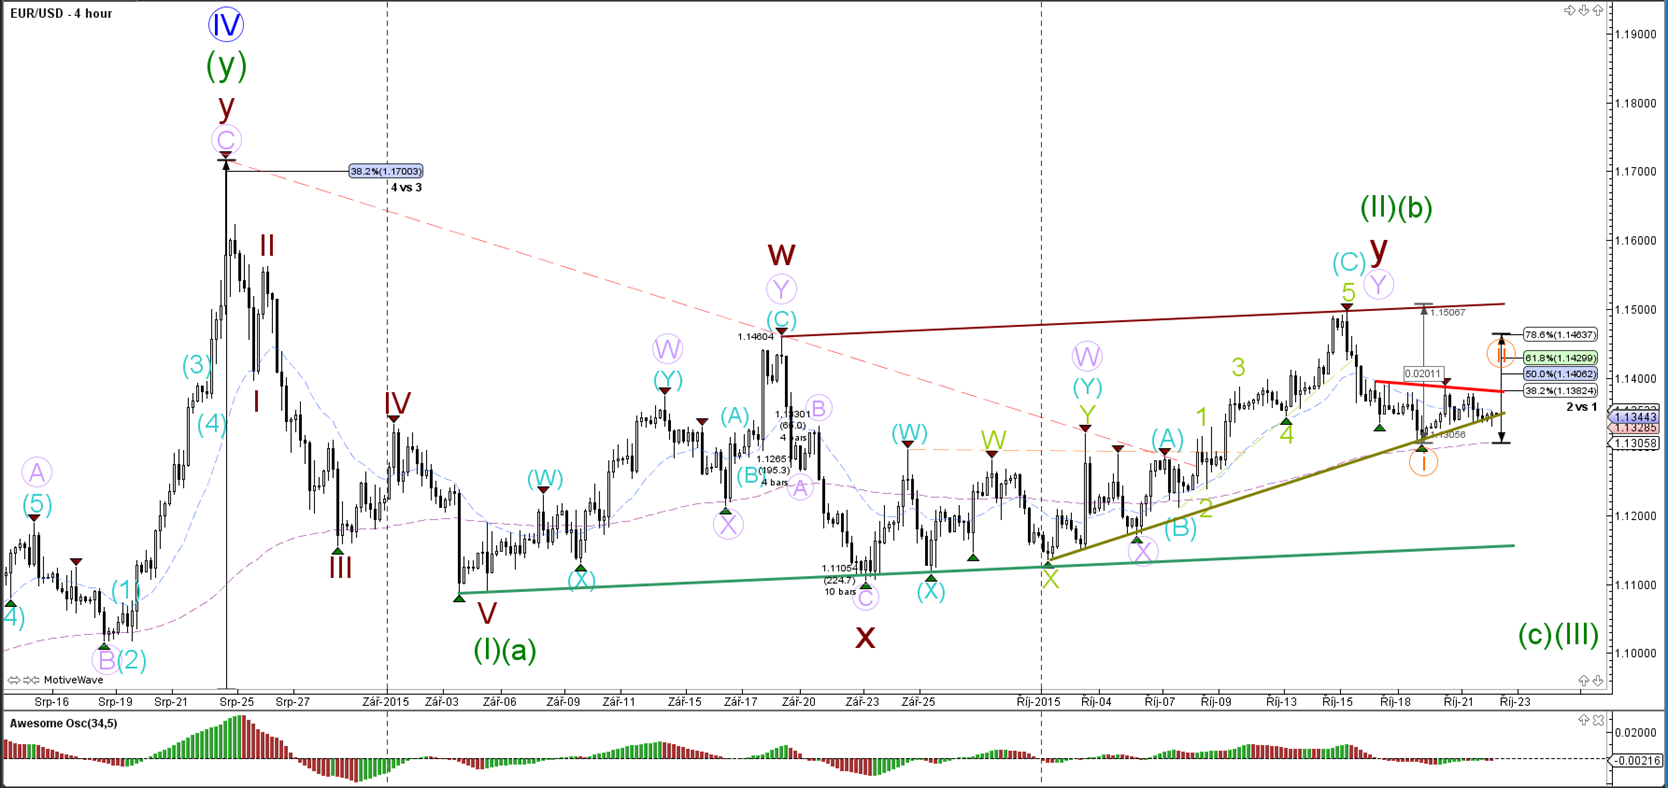
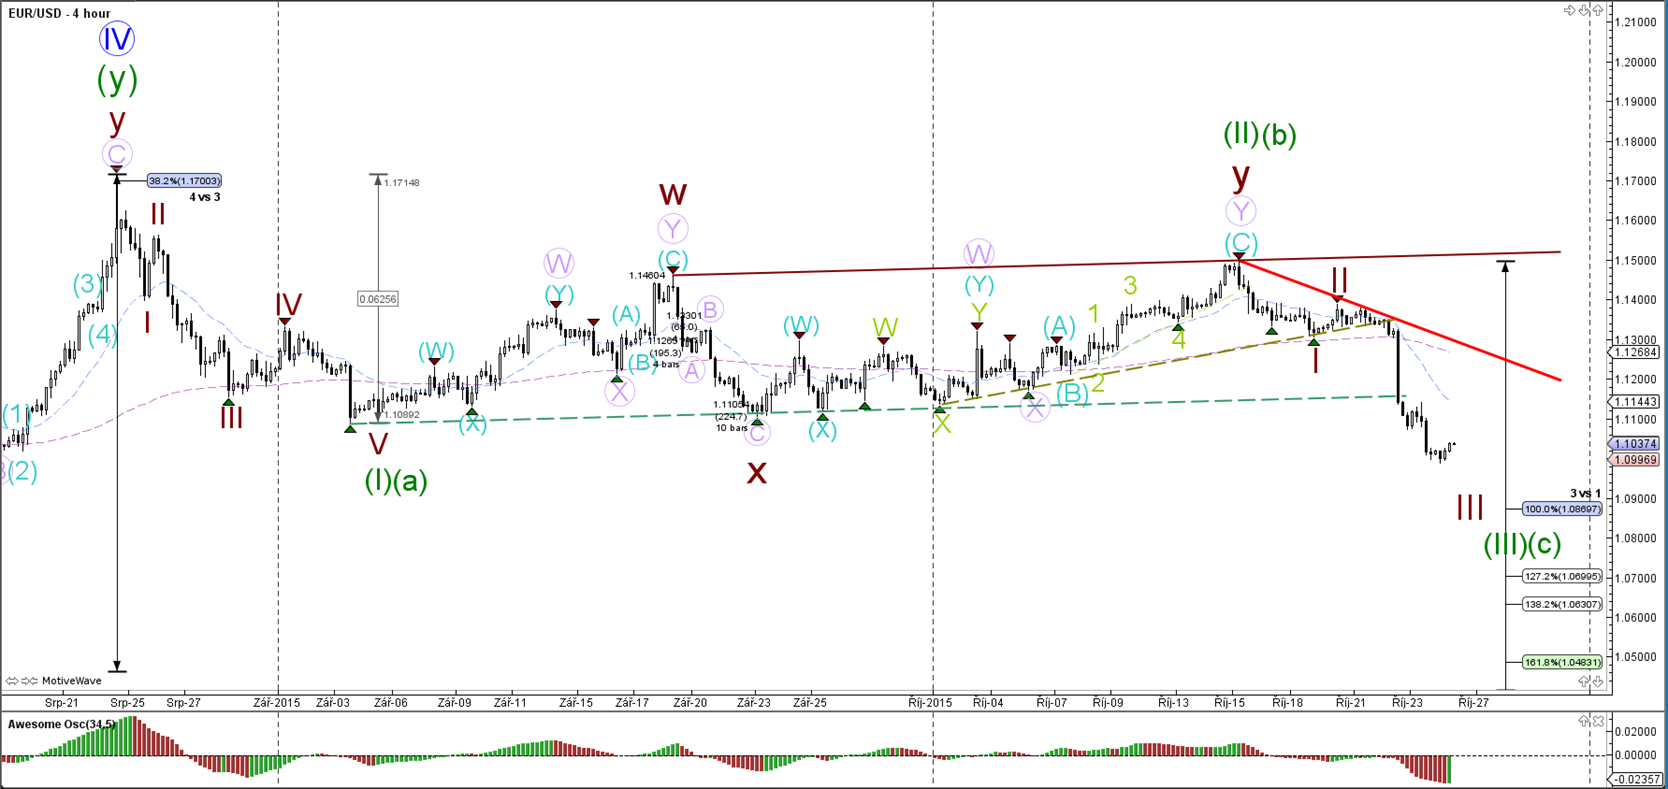
EUR/USD
4 hour
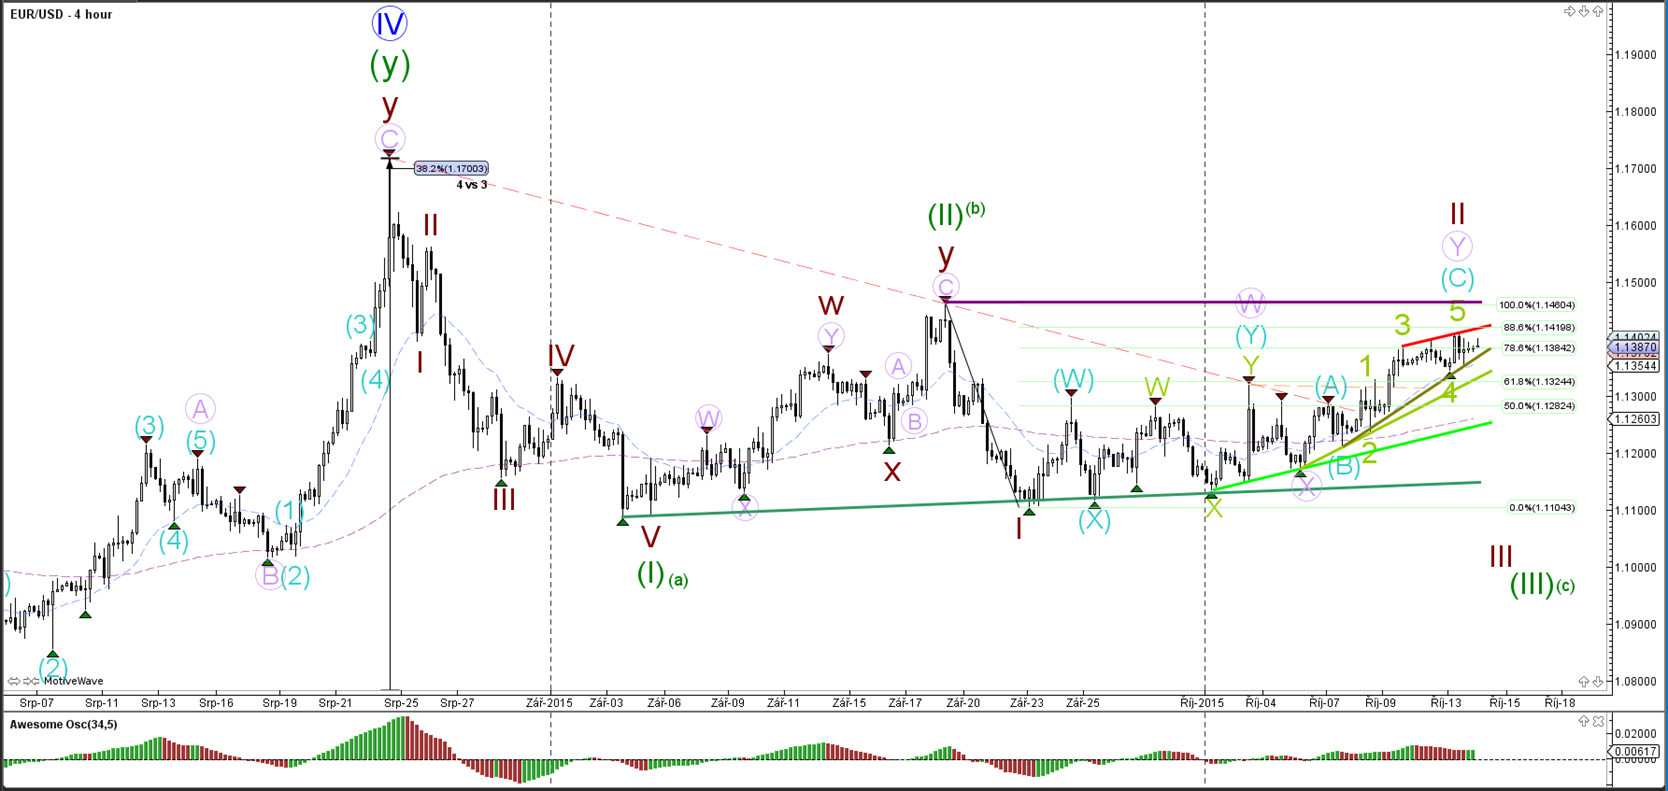
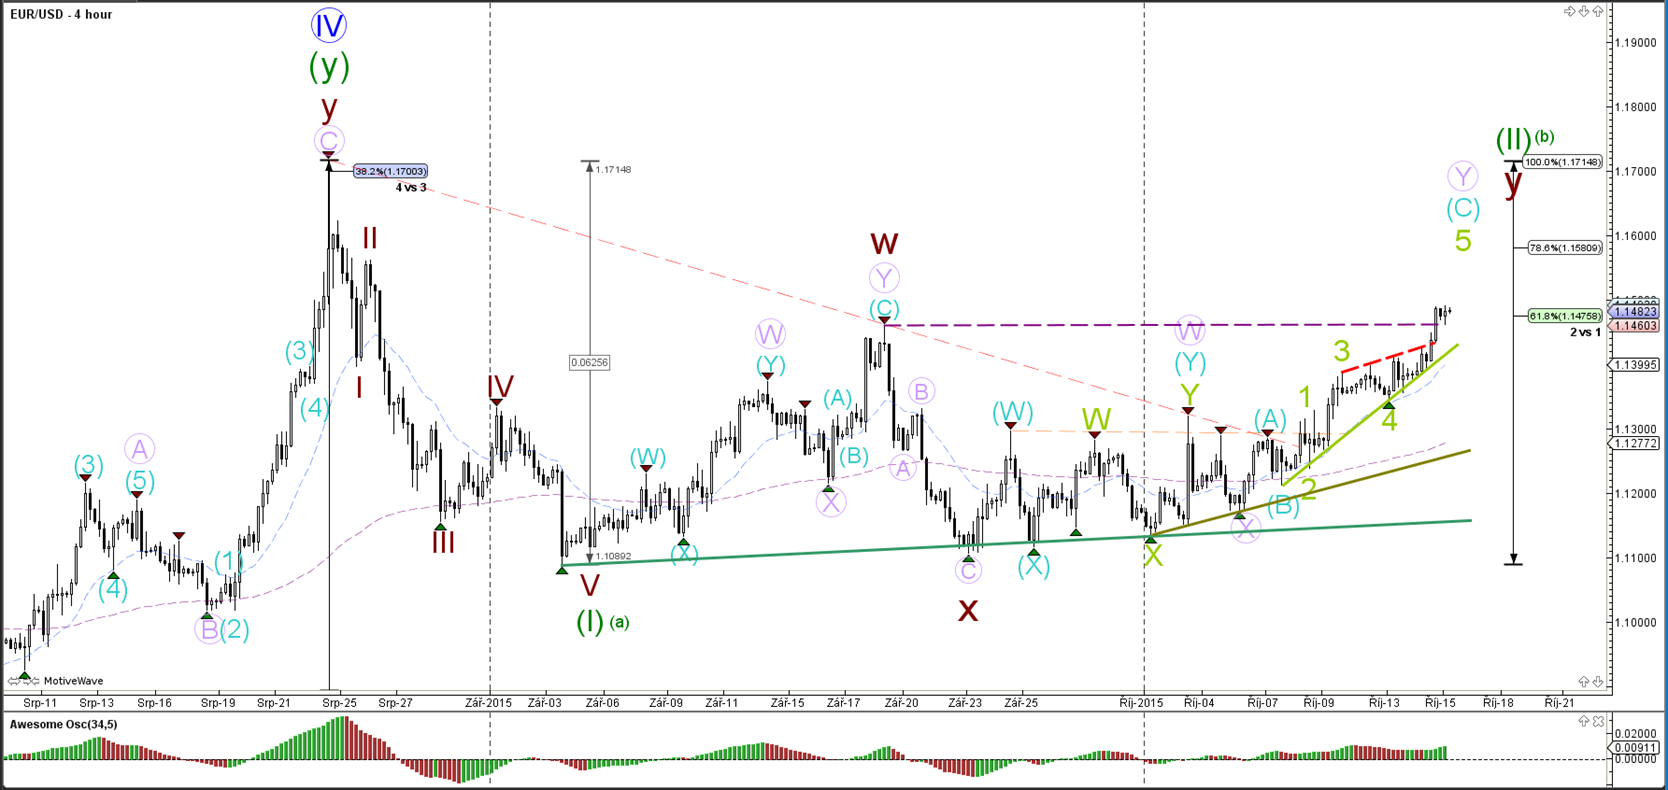
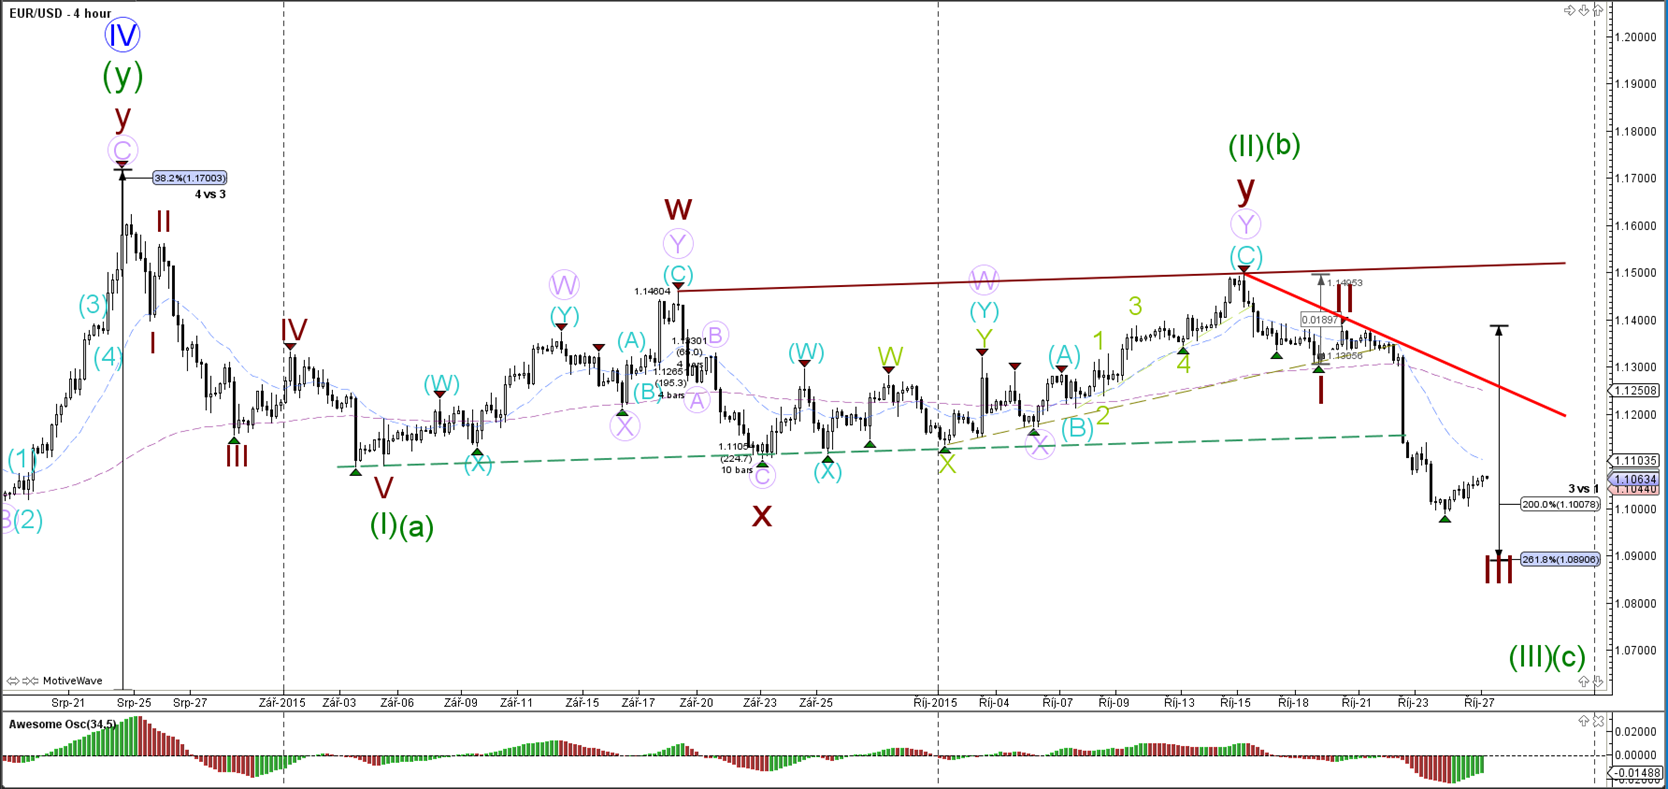
The EUR/USD has shown a deep pullback within the potential wave 2 (brown) up to the 88.6% Fibonacci retracement level. A break above the purple line invalidates the current wave 1-2 (brown) structure.
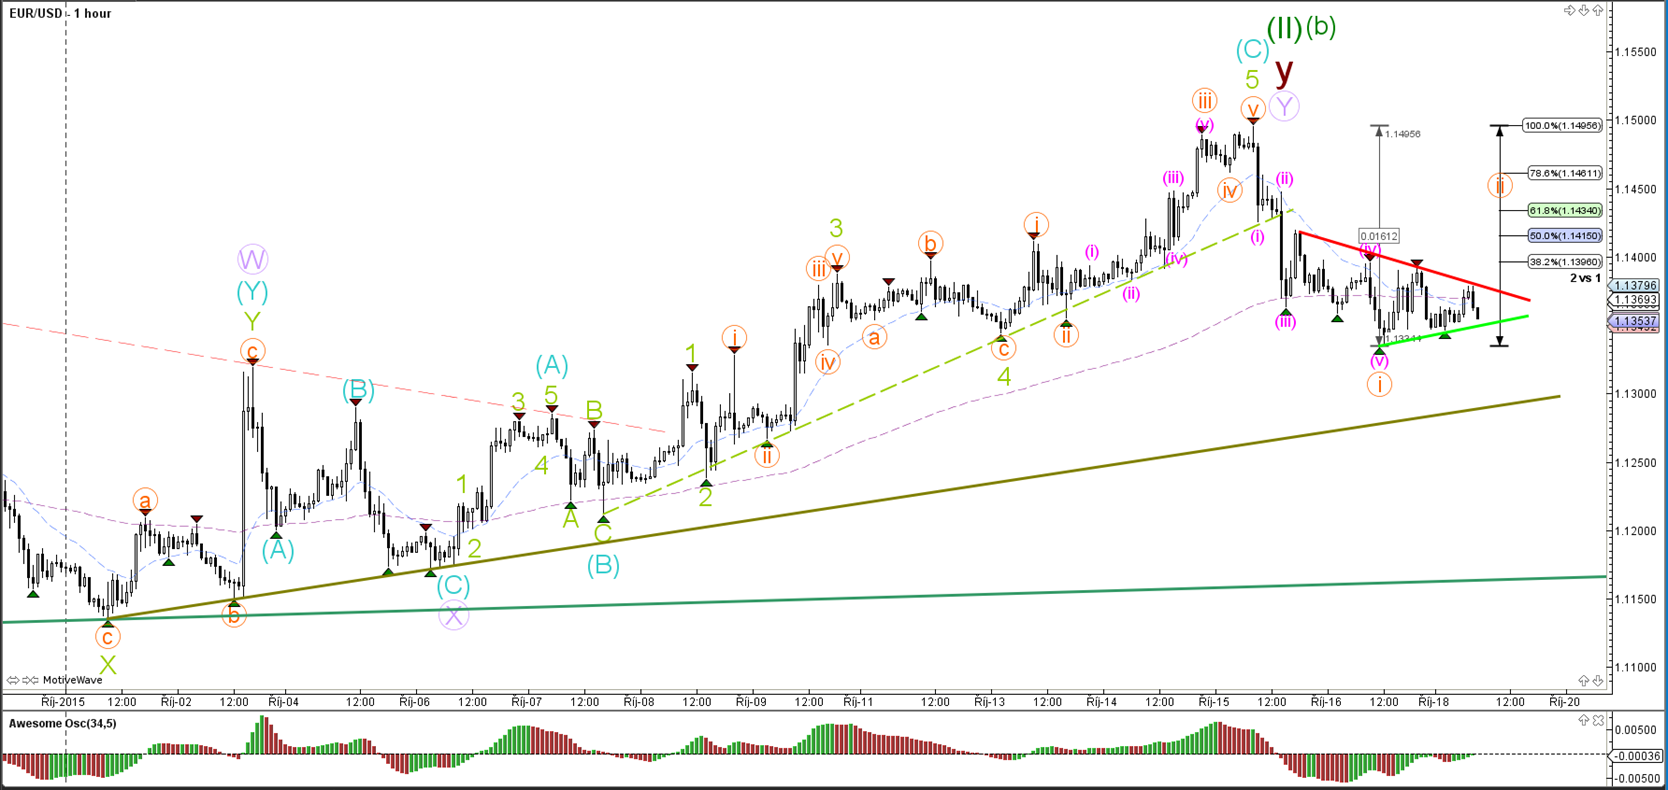
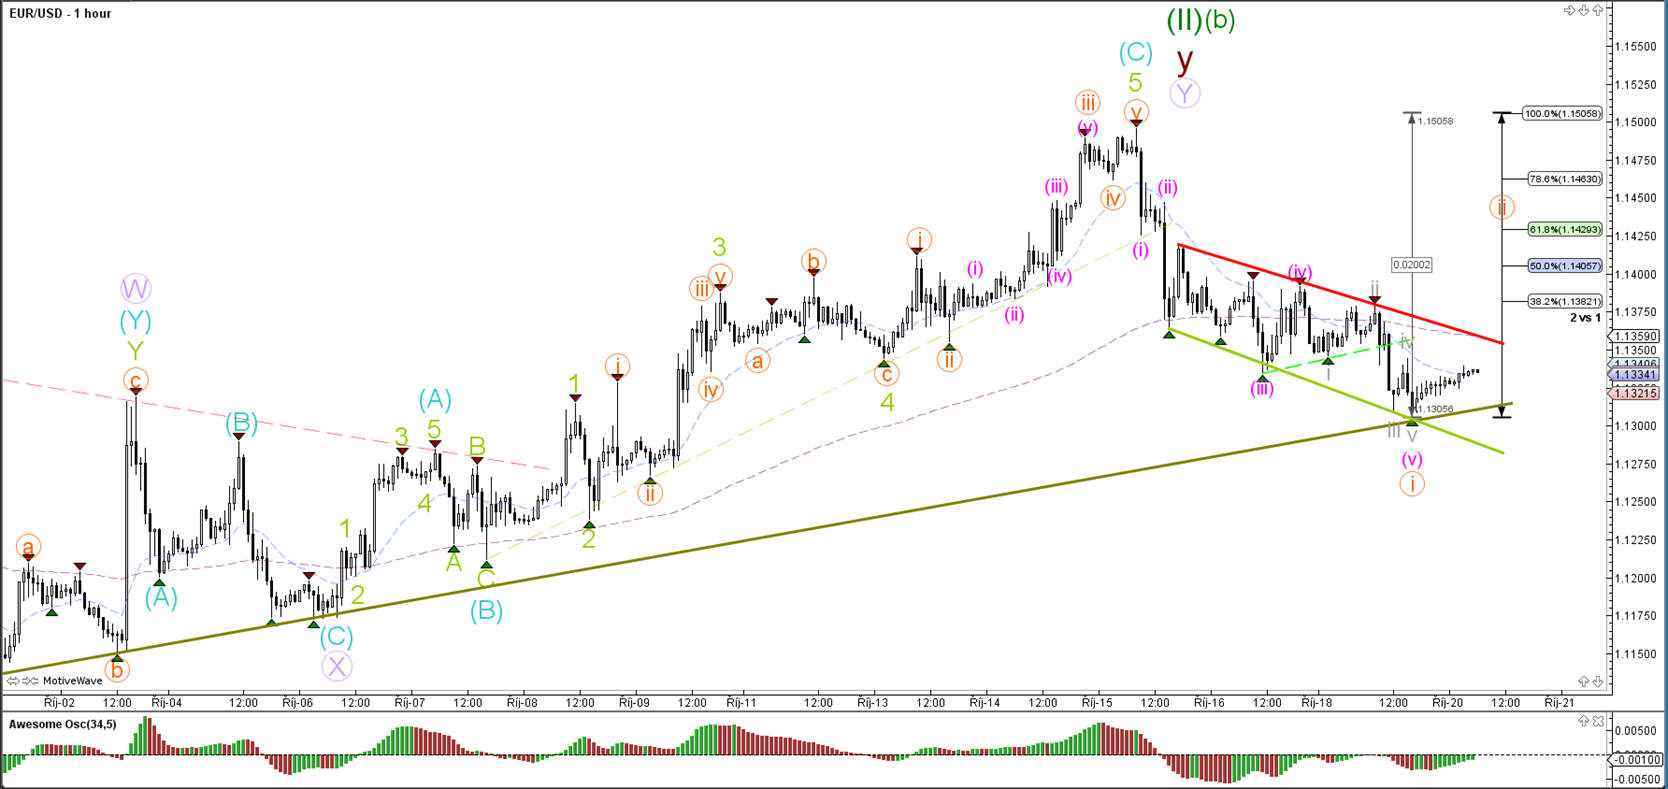
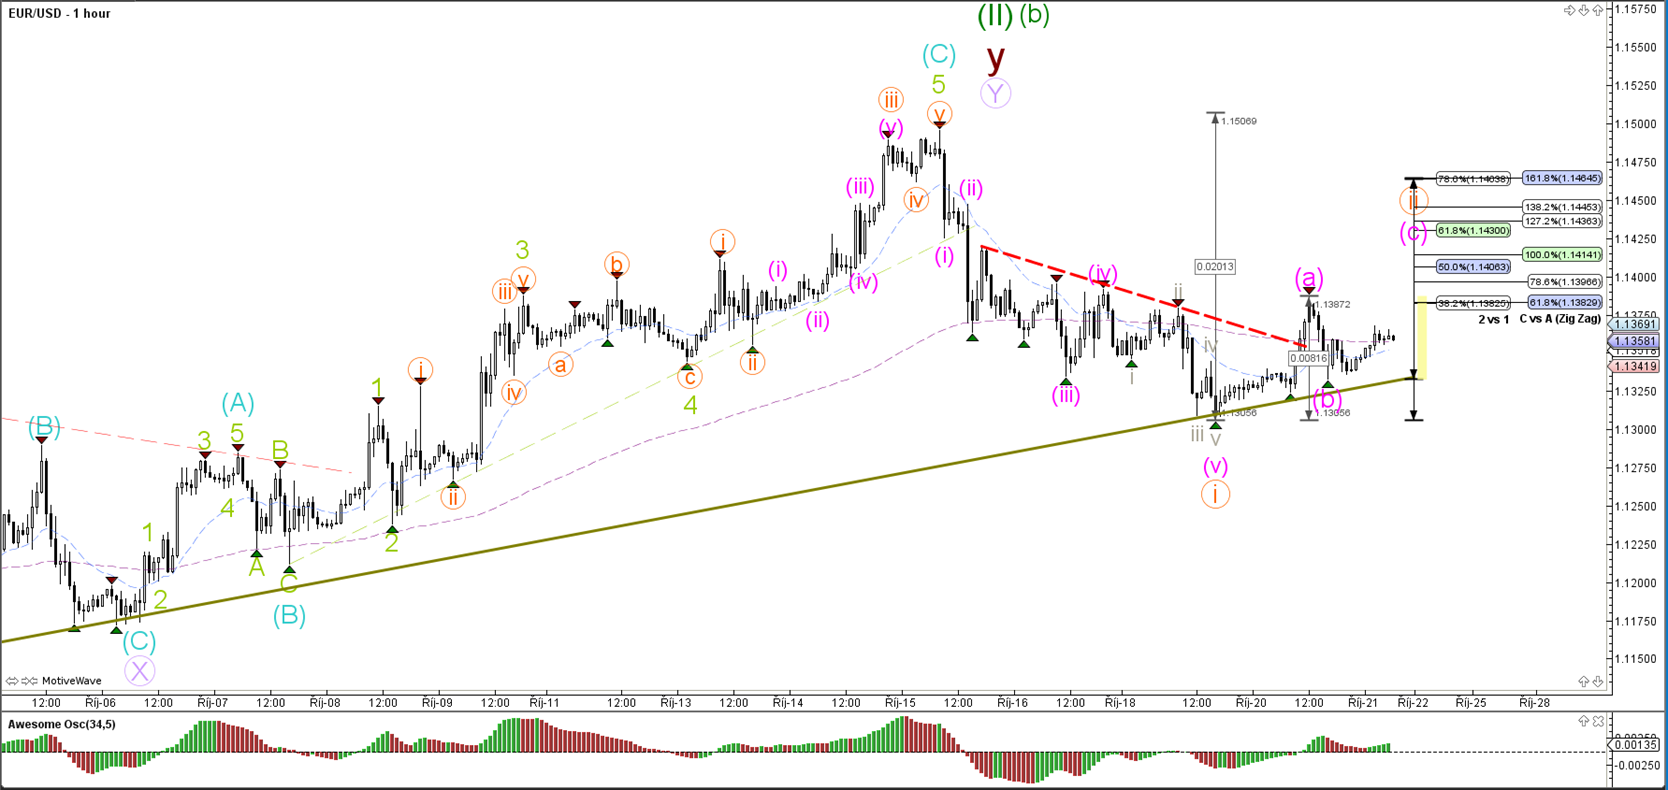
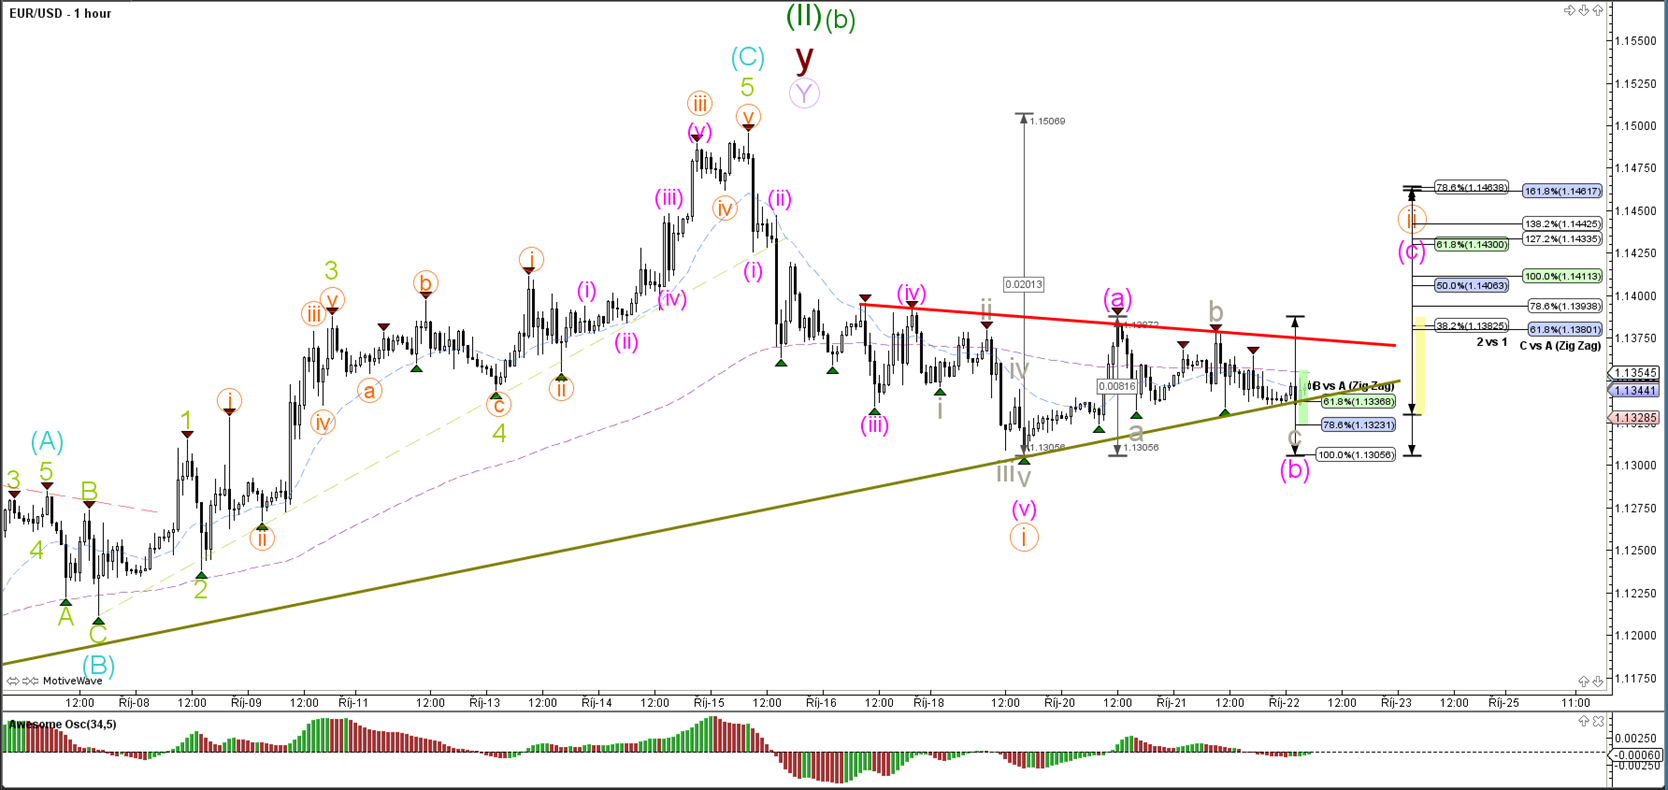
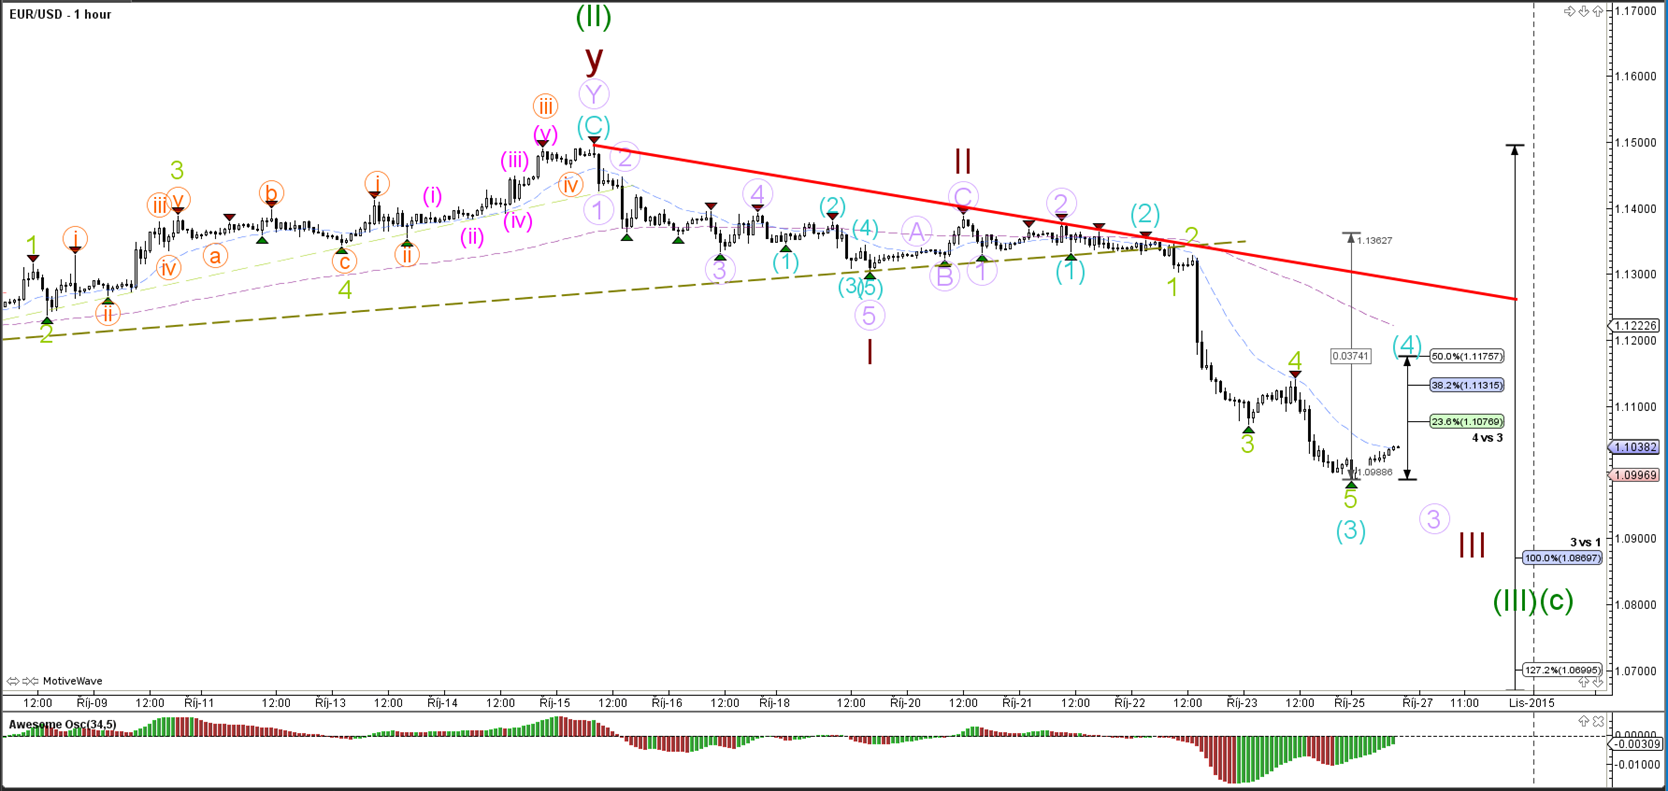
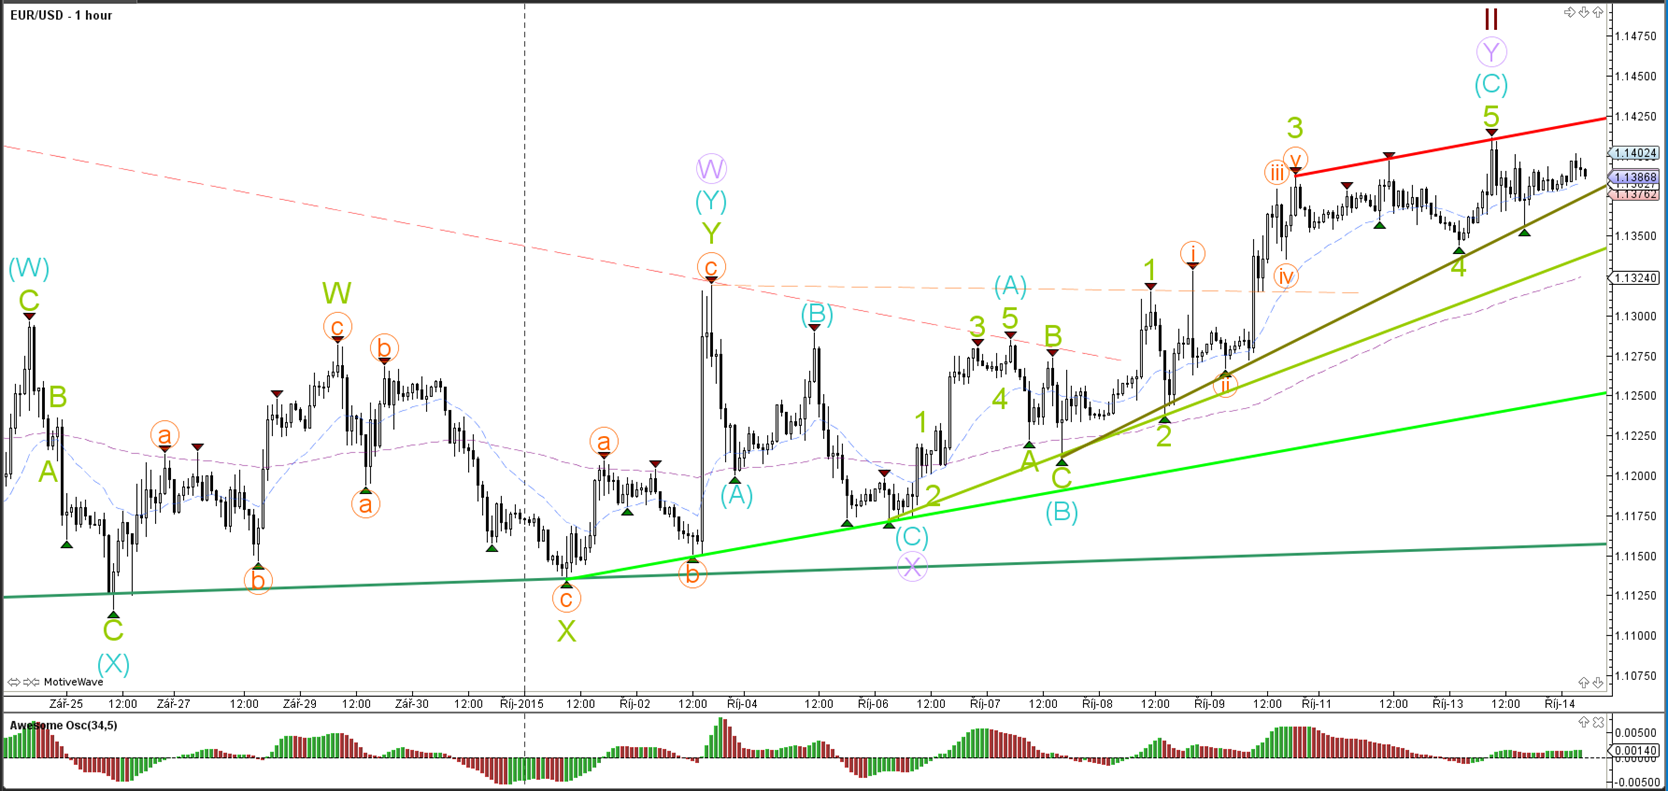
1 hour

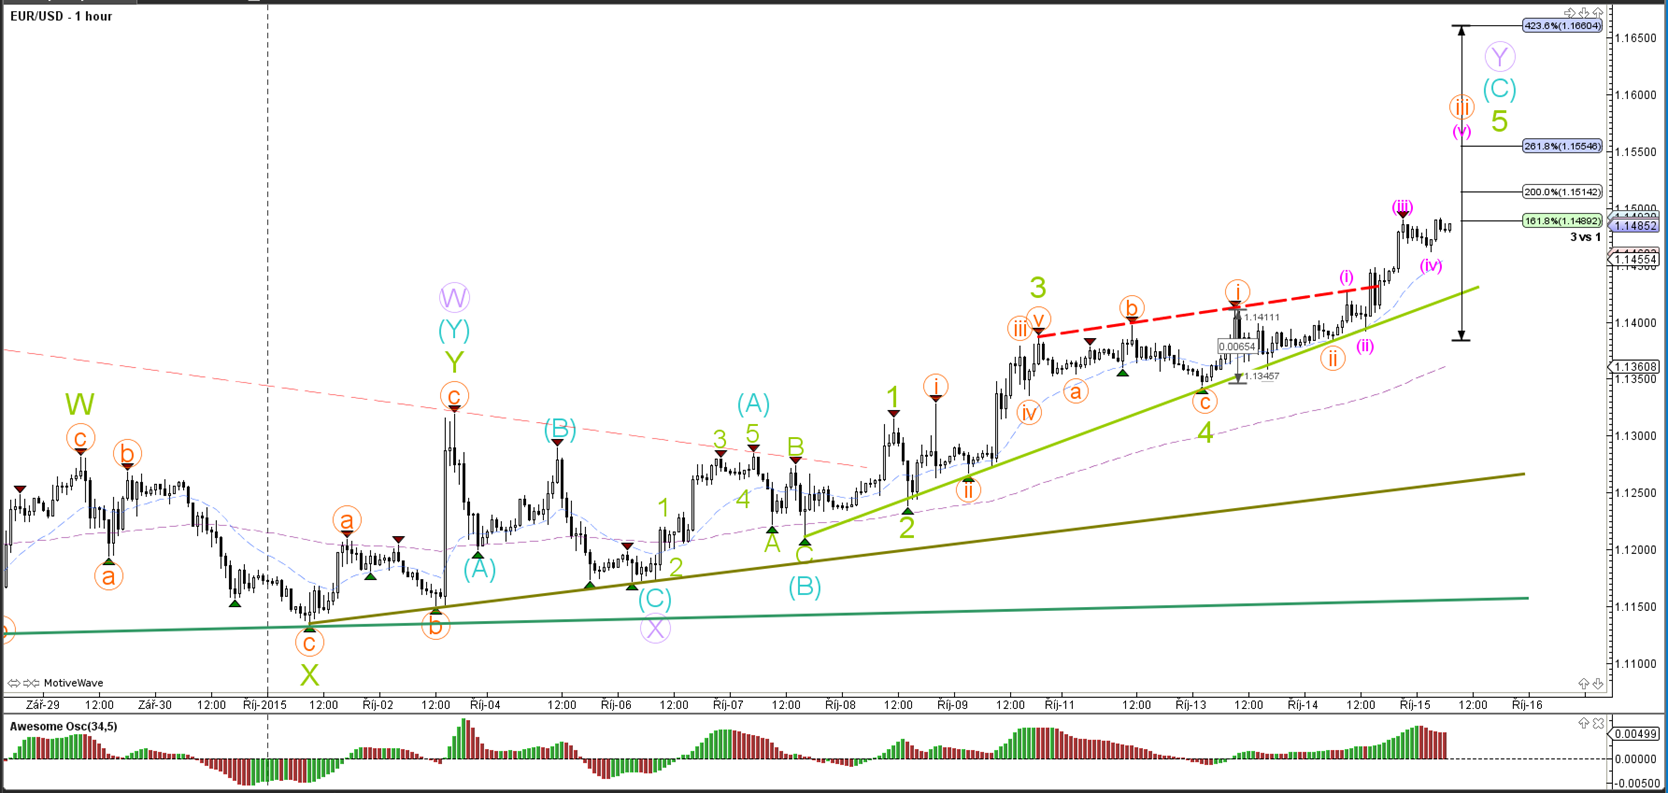
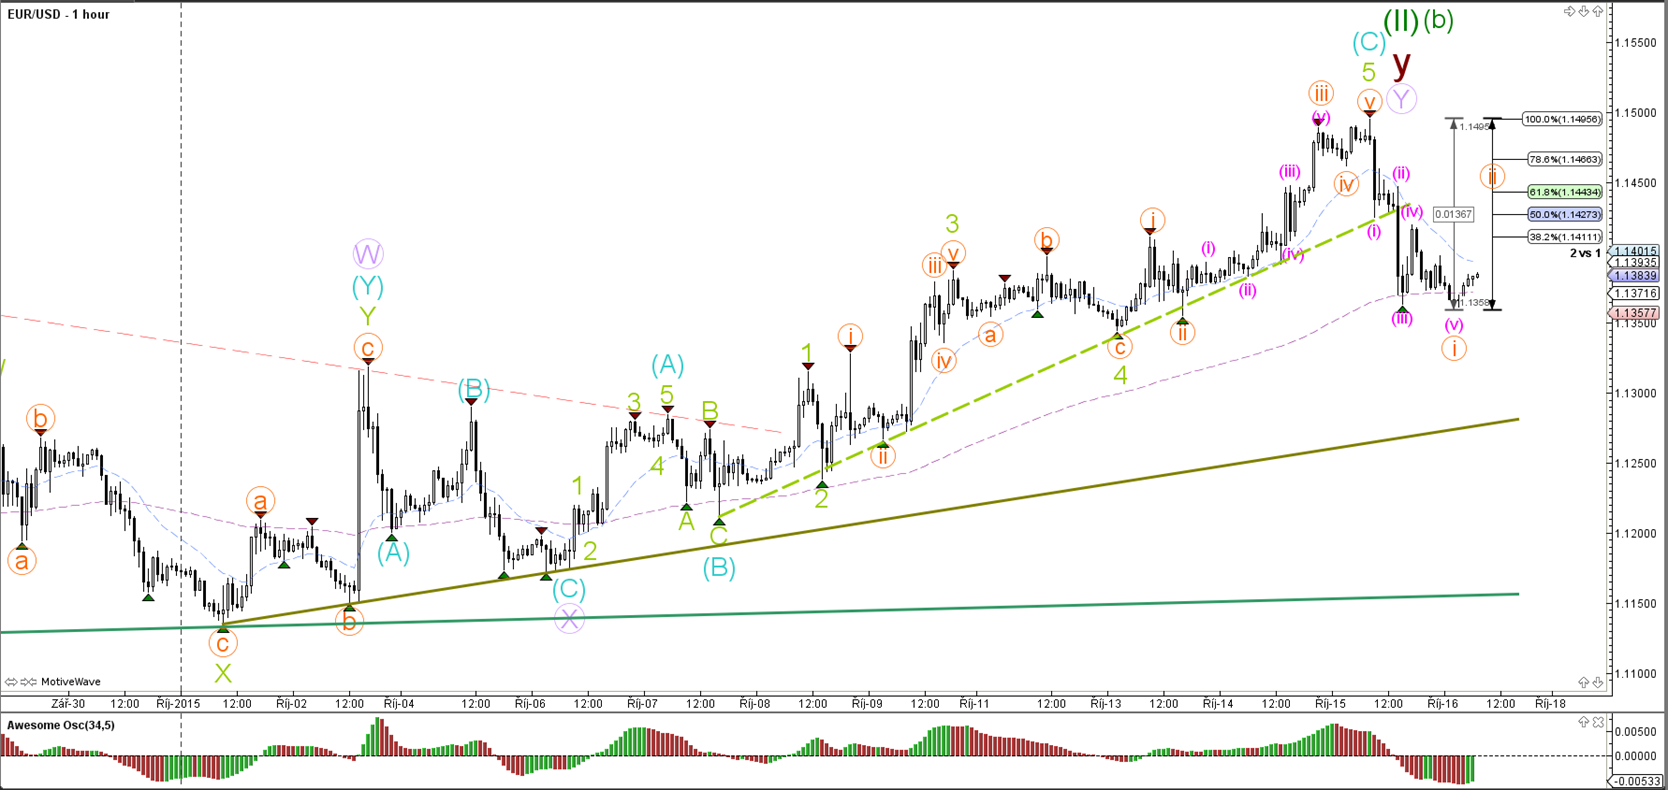
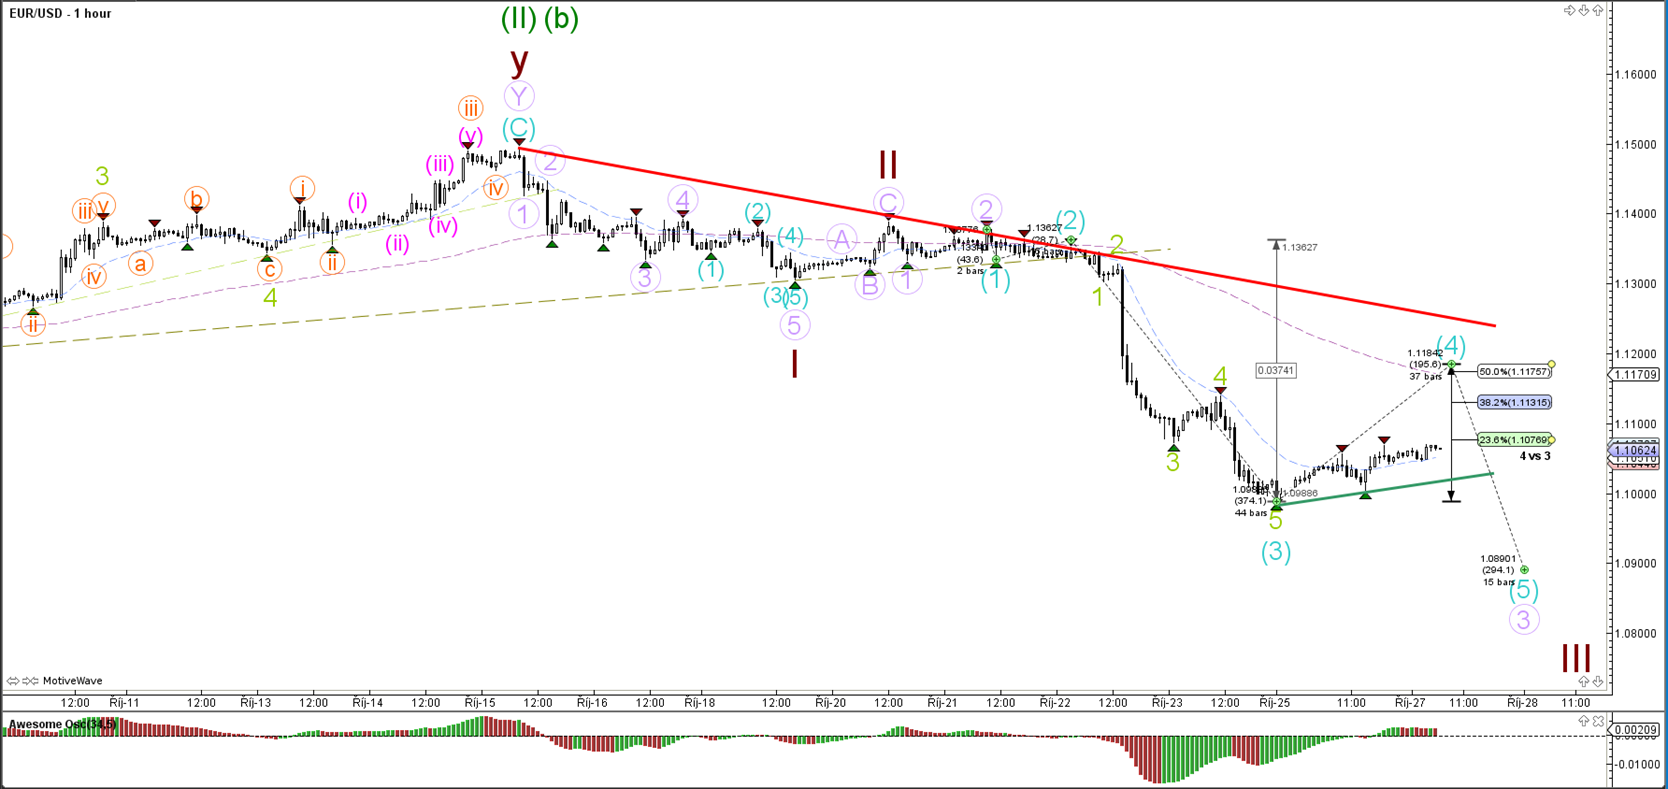
The EUR/USD made one more bullish push yesterday which could be explained by a wave 4 and 5 (green). Currently there is a rising wedge (red/green lines) chart pattern taking place on the 1 hour chart, which is most often a reversal signal. A break of the various support levels confirms the bearish potential, whereas a break above resistance invalidates the wave 2 (brown).
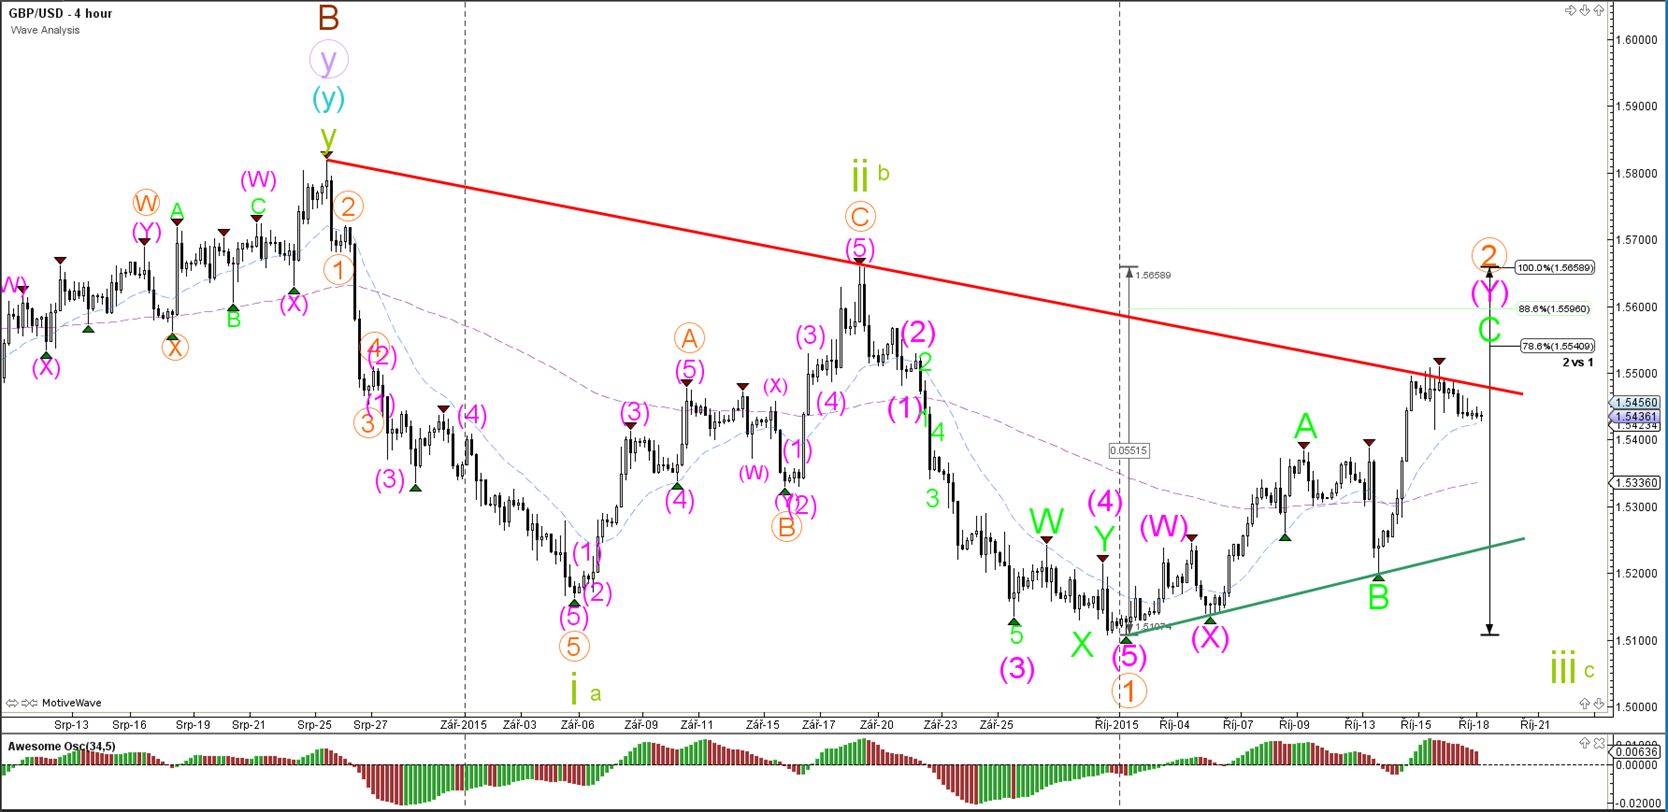
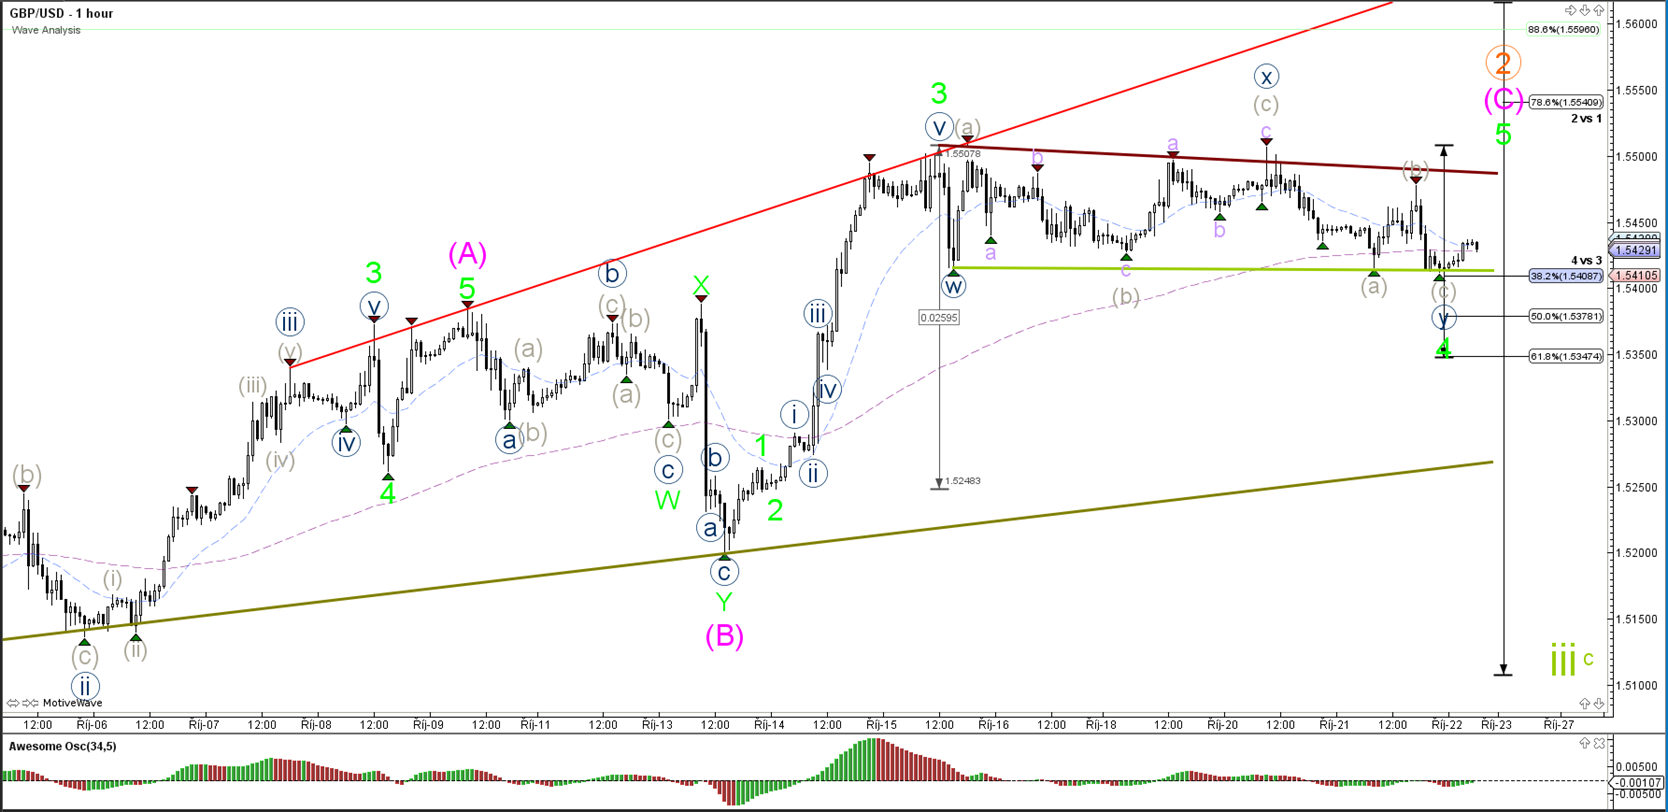
GBP/USD
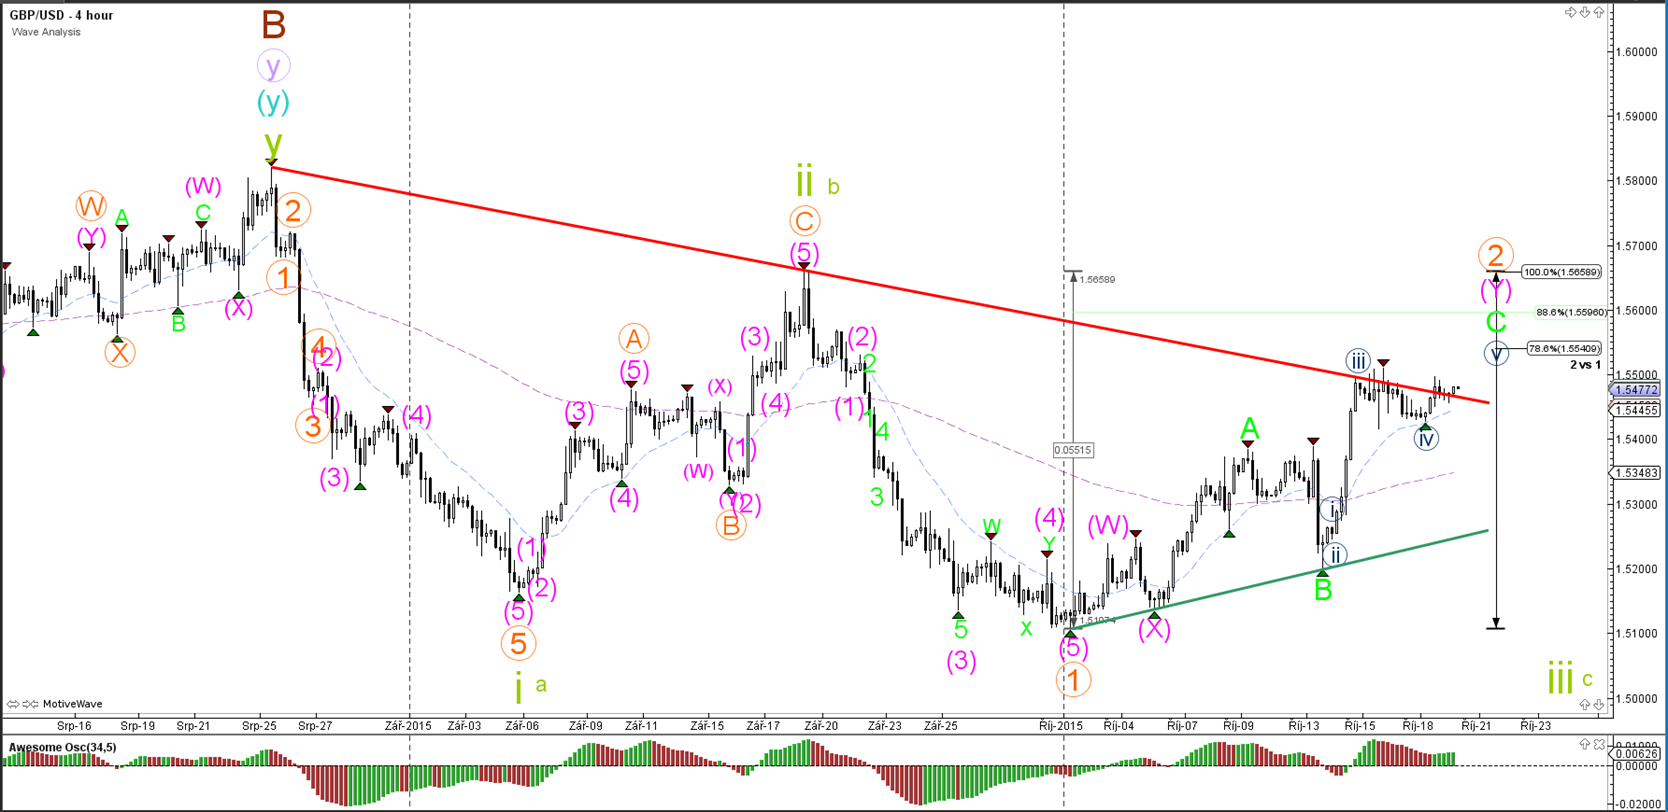
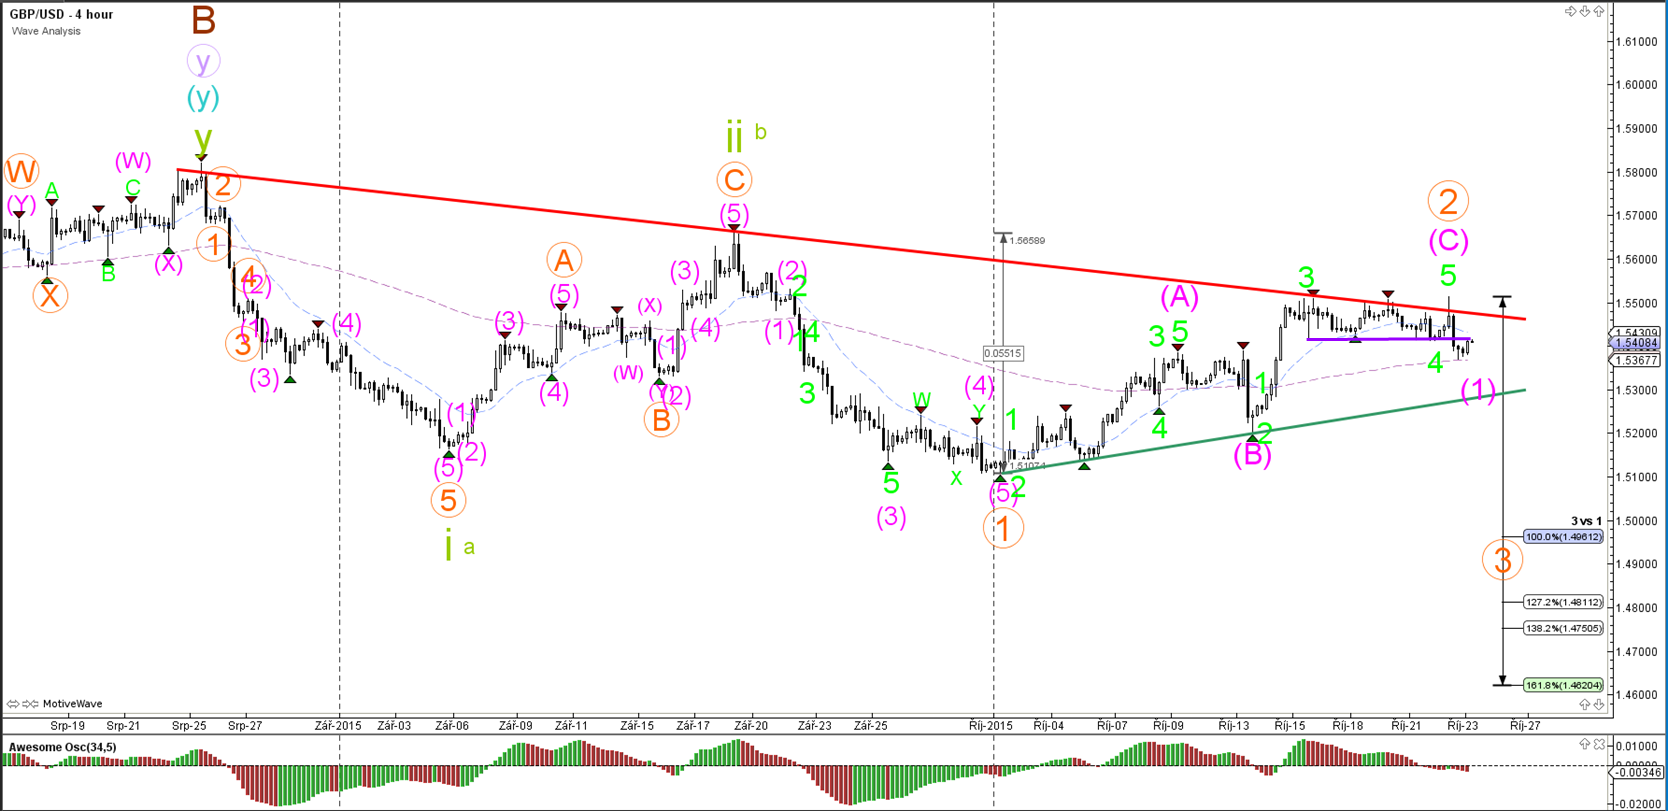
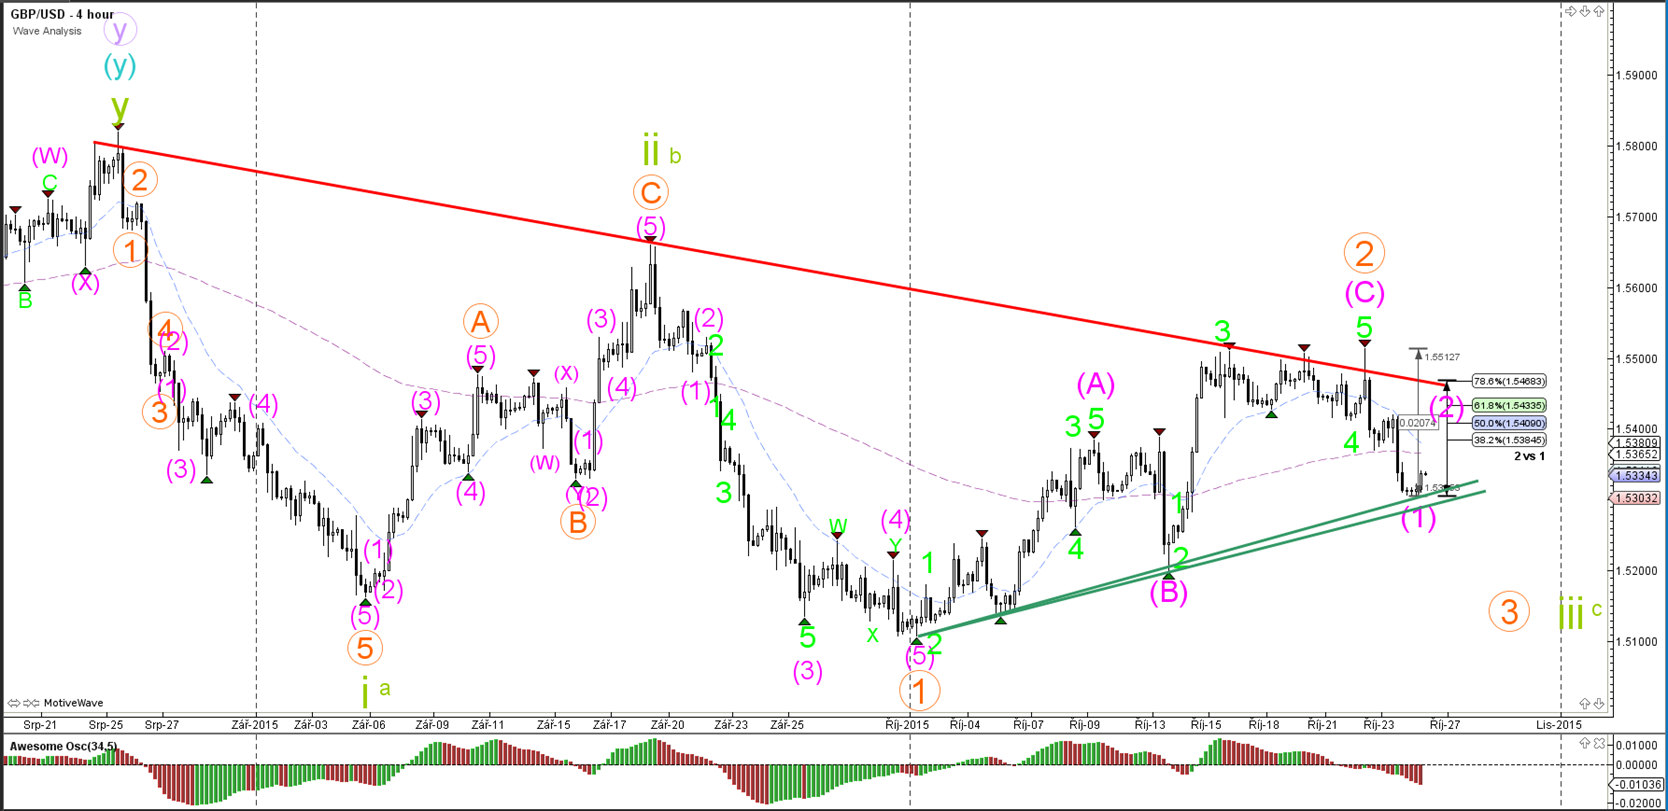
4 hour
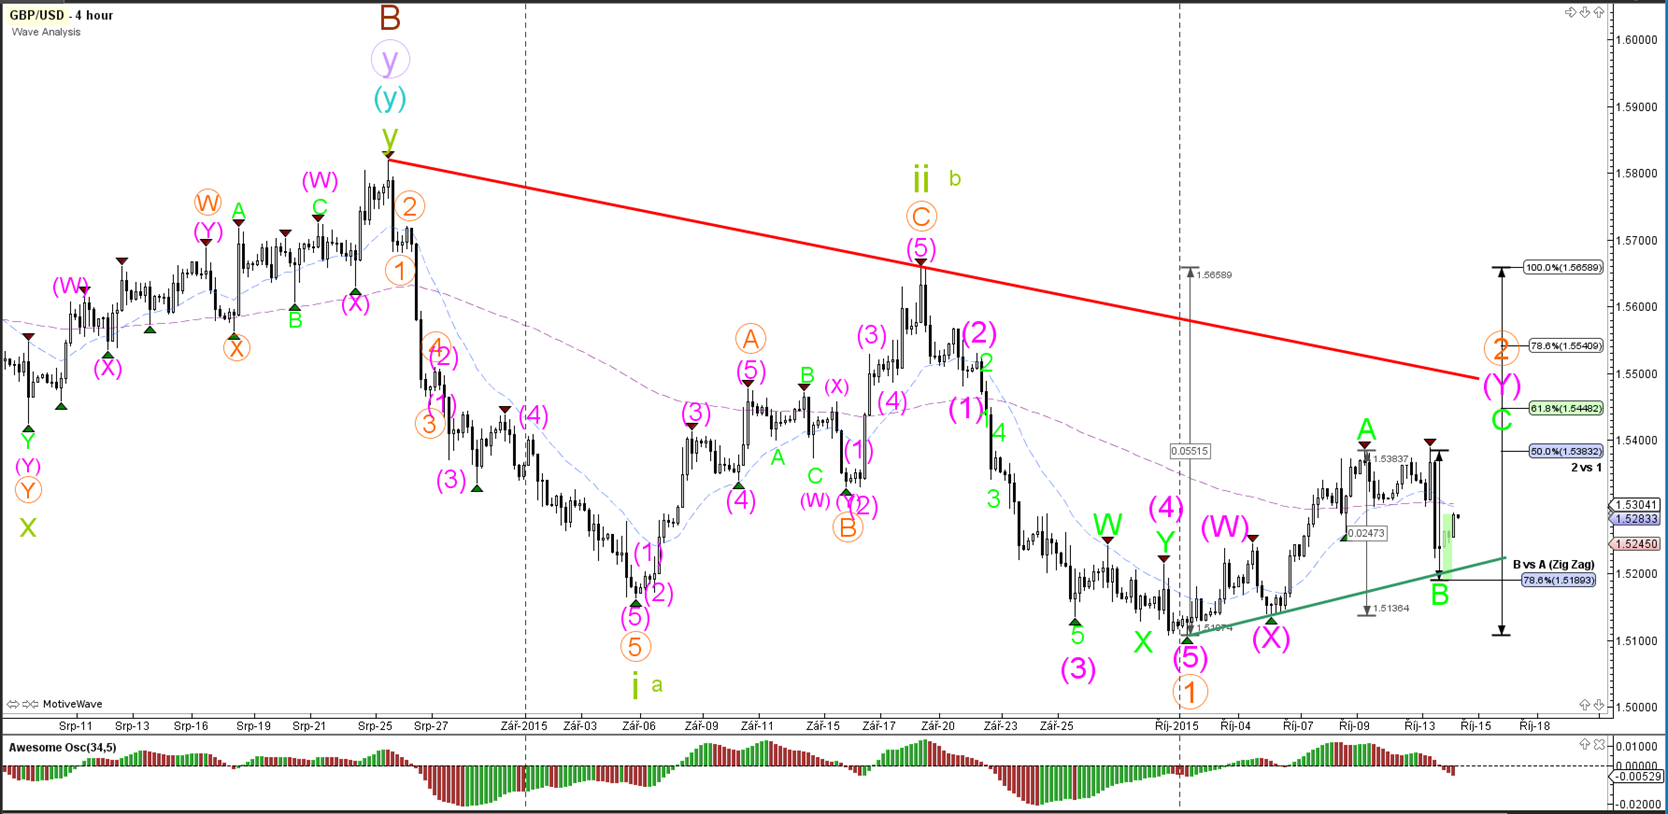
The GBP/USD posted a deep bearish retracement yesterday down to the 78.6% Fibonacci retracement level. A break below the support trend line (green) invalidates the wave B (green) and indicates that wave 2 (orange) has been most likely completed at the recent top (where wave A is now).
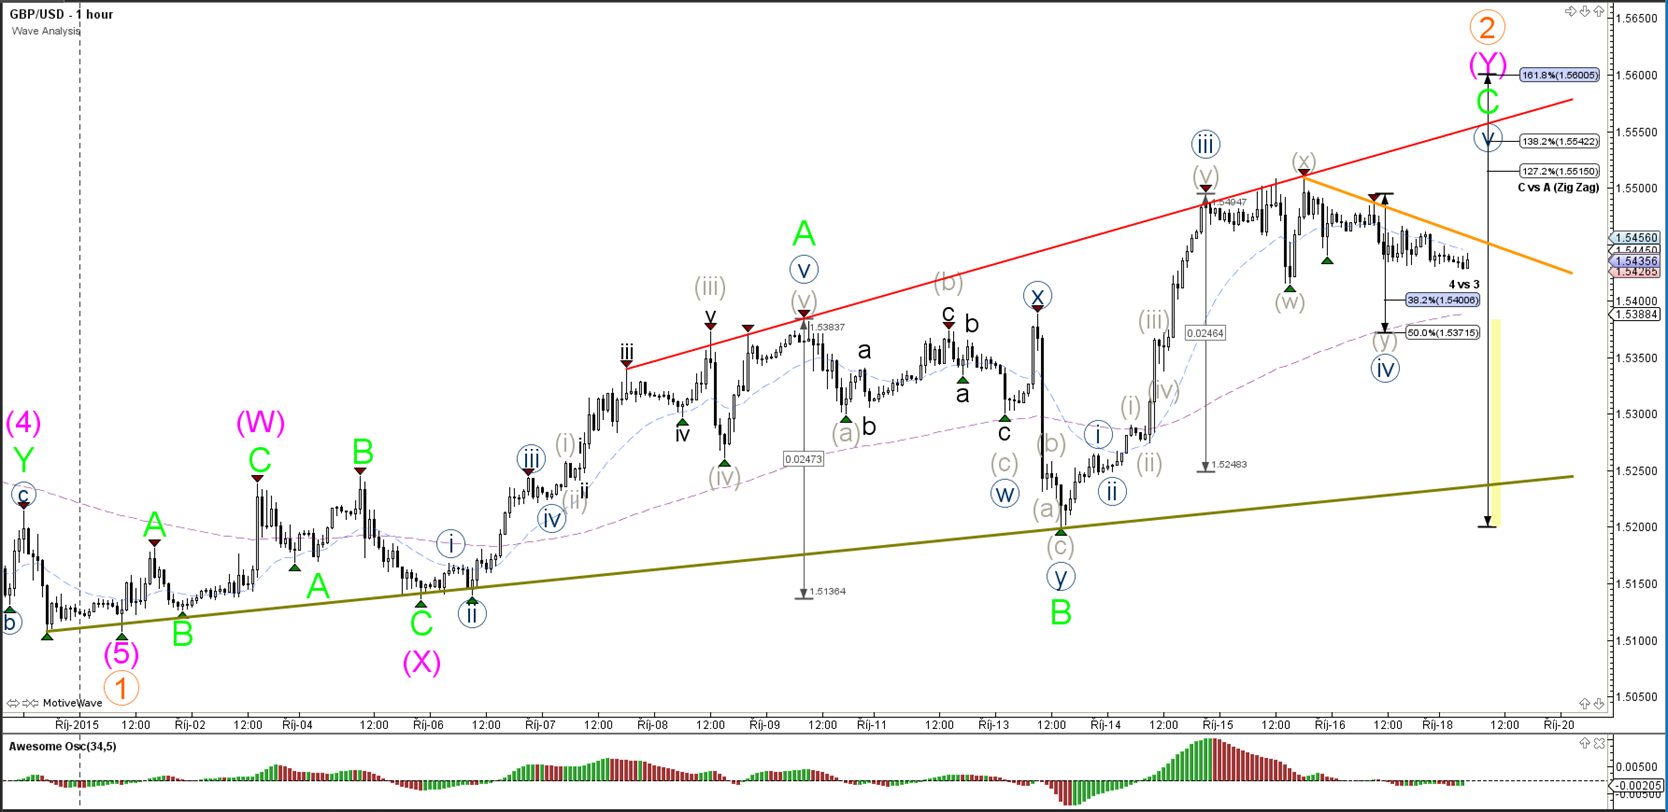
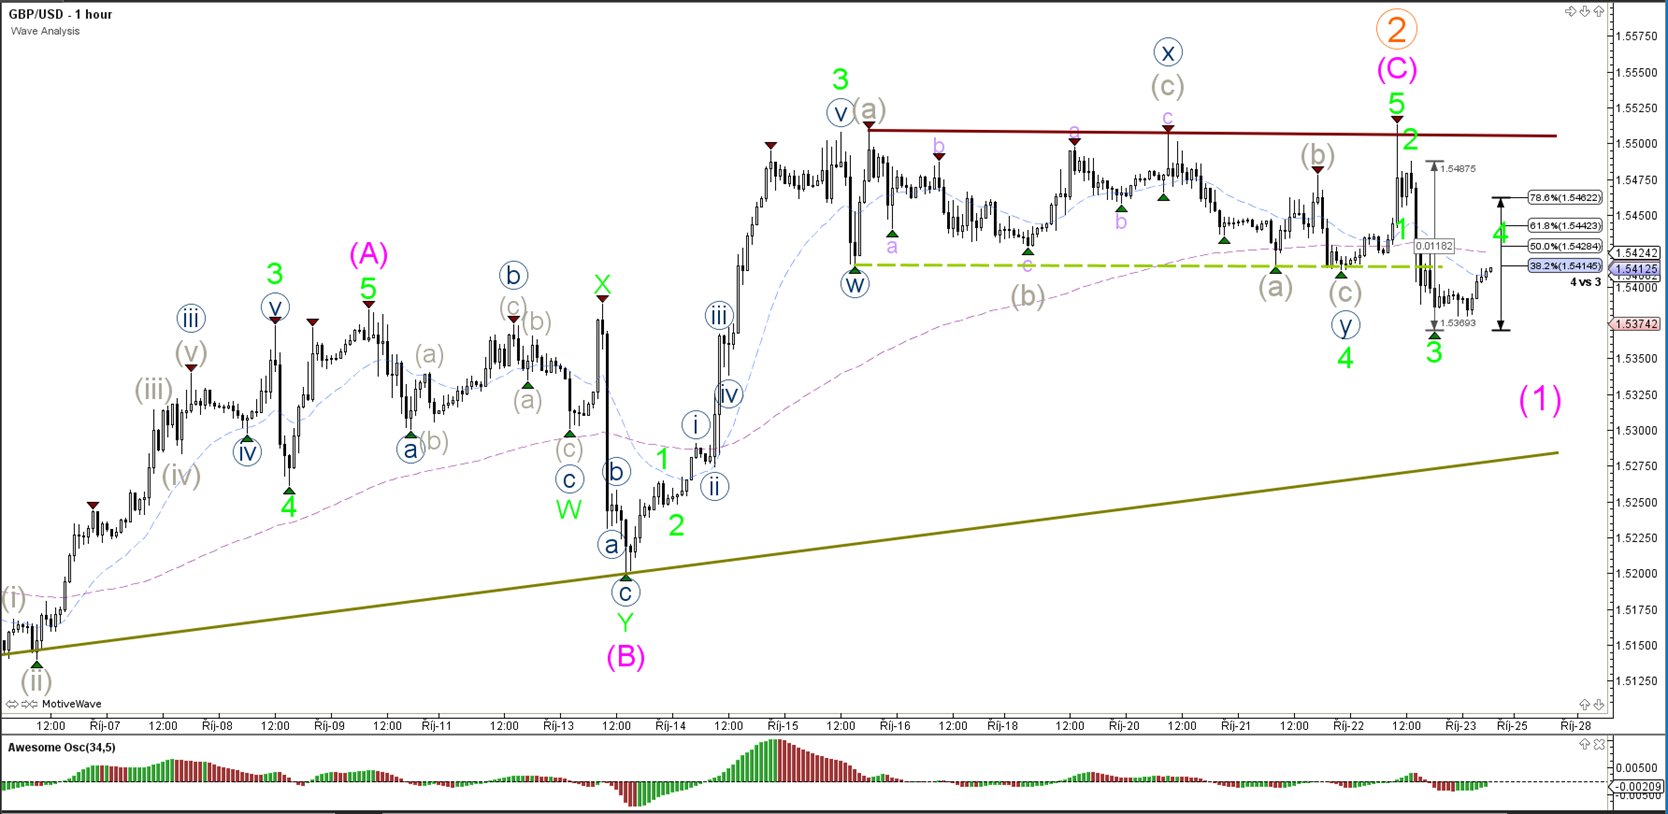
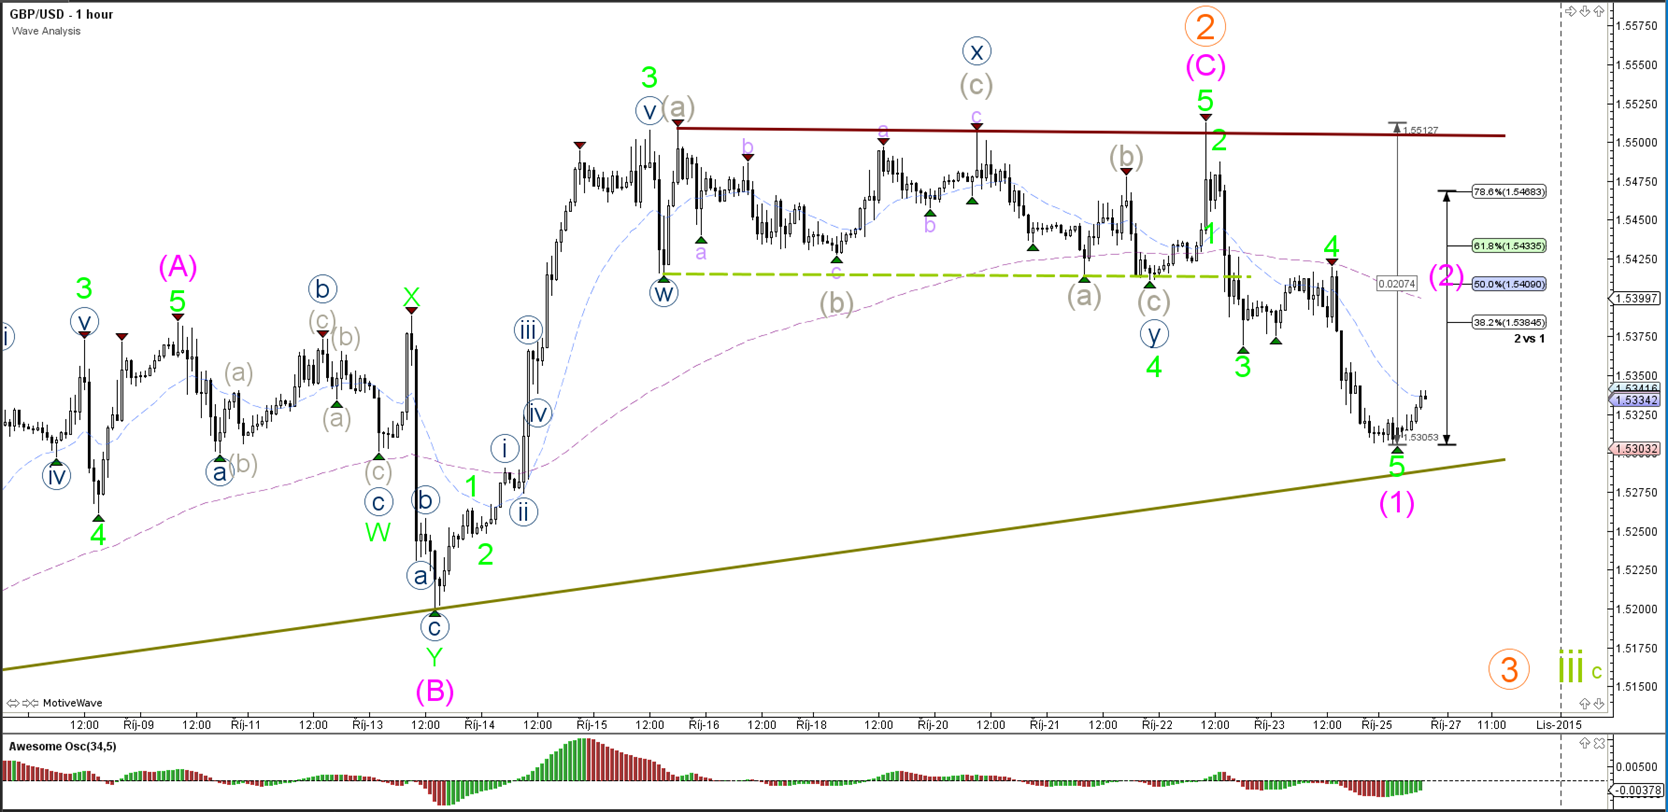
1 hour
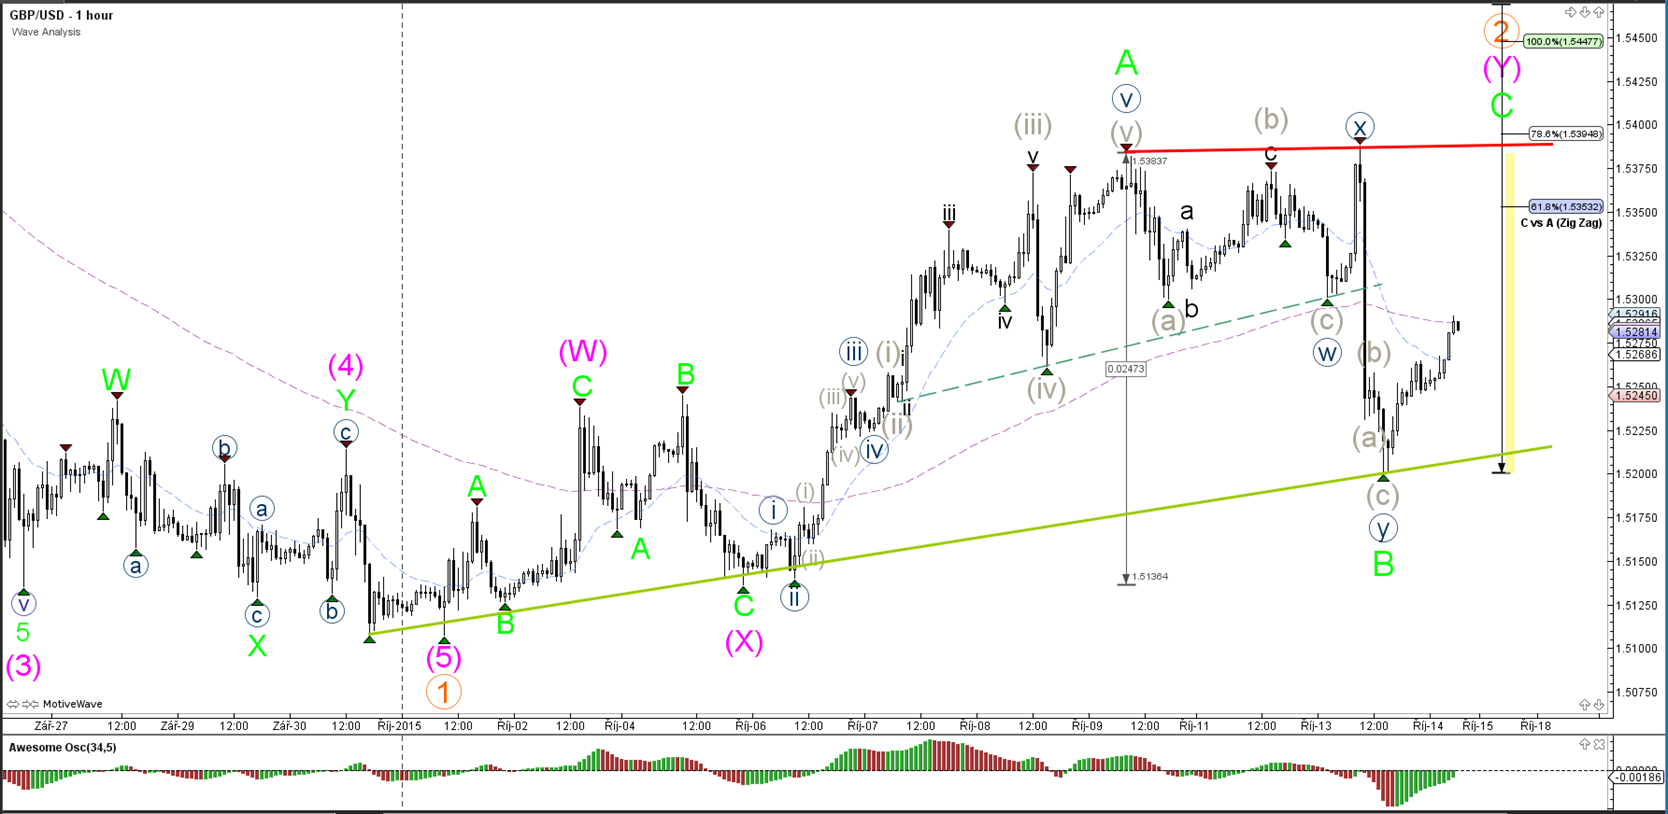
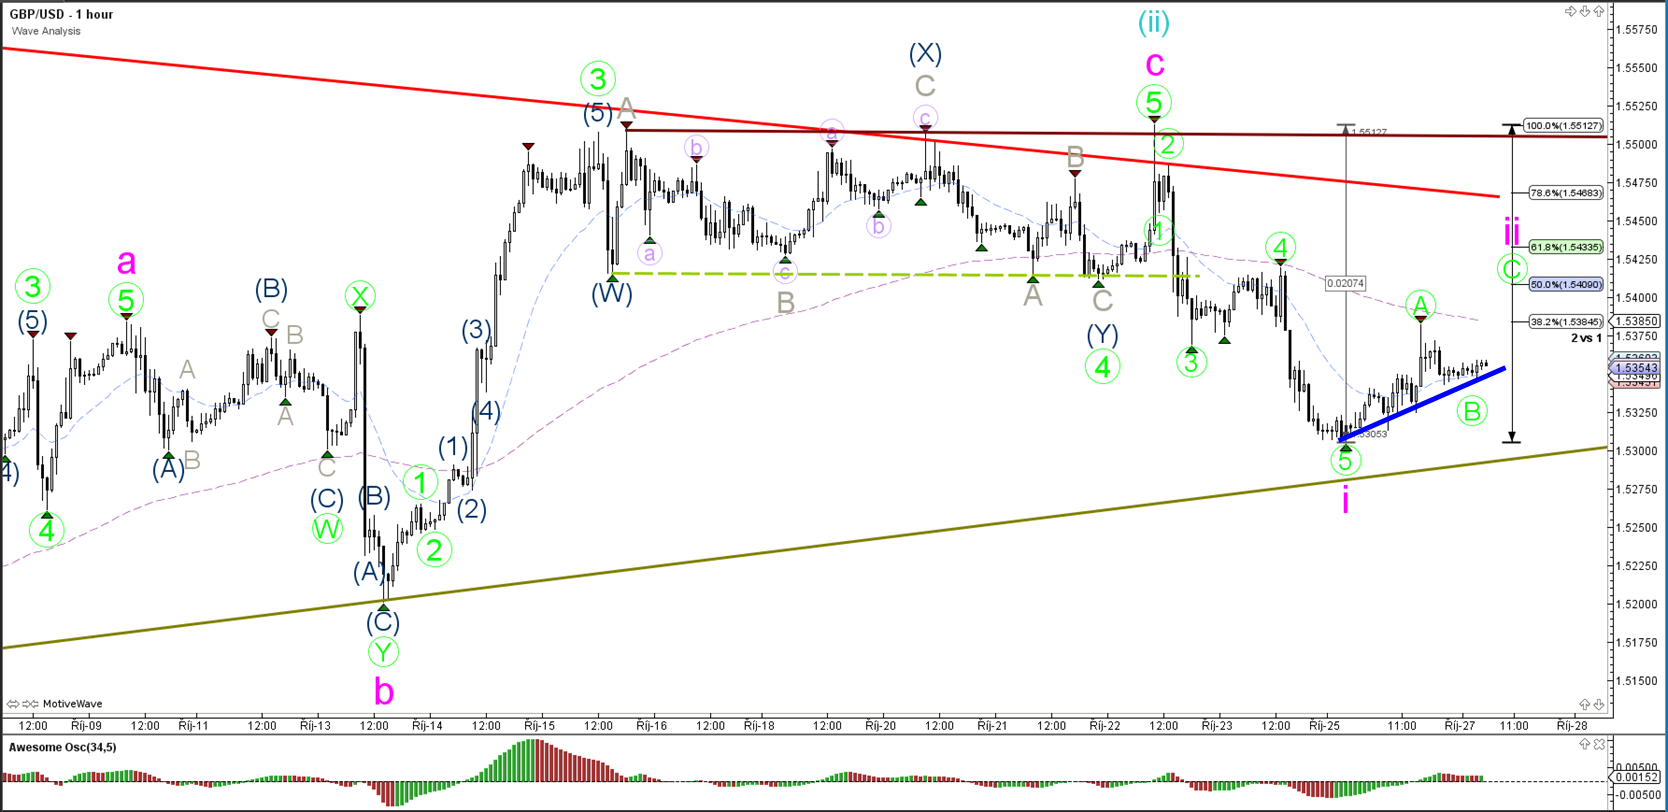
The GBP/USD bounced at support (green) and price could have space up to the 100% Fibonacci target if price manages to break above the 61.8% Fibonacci target and then top (red).
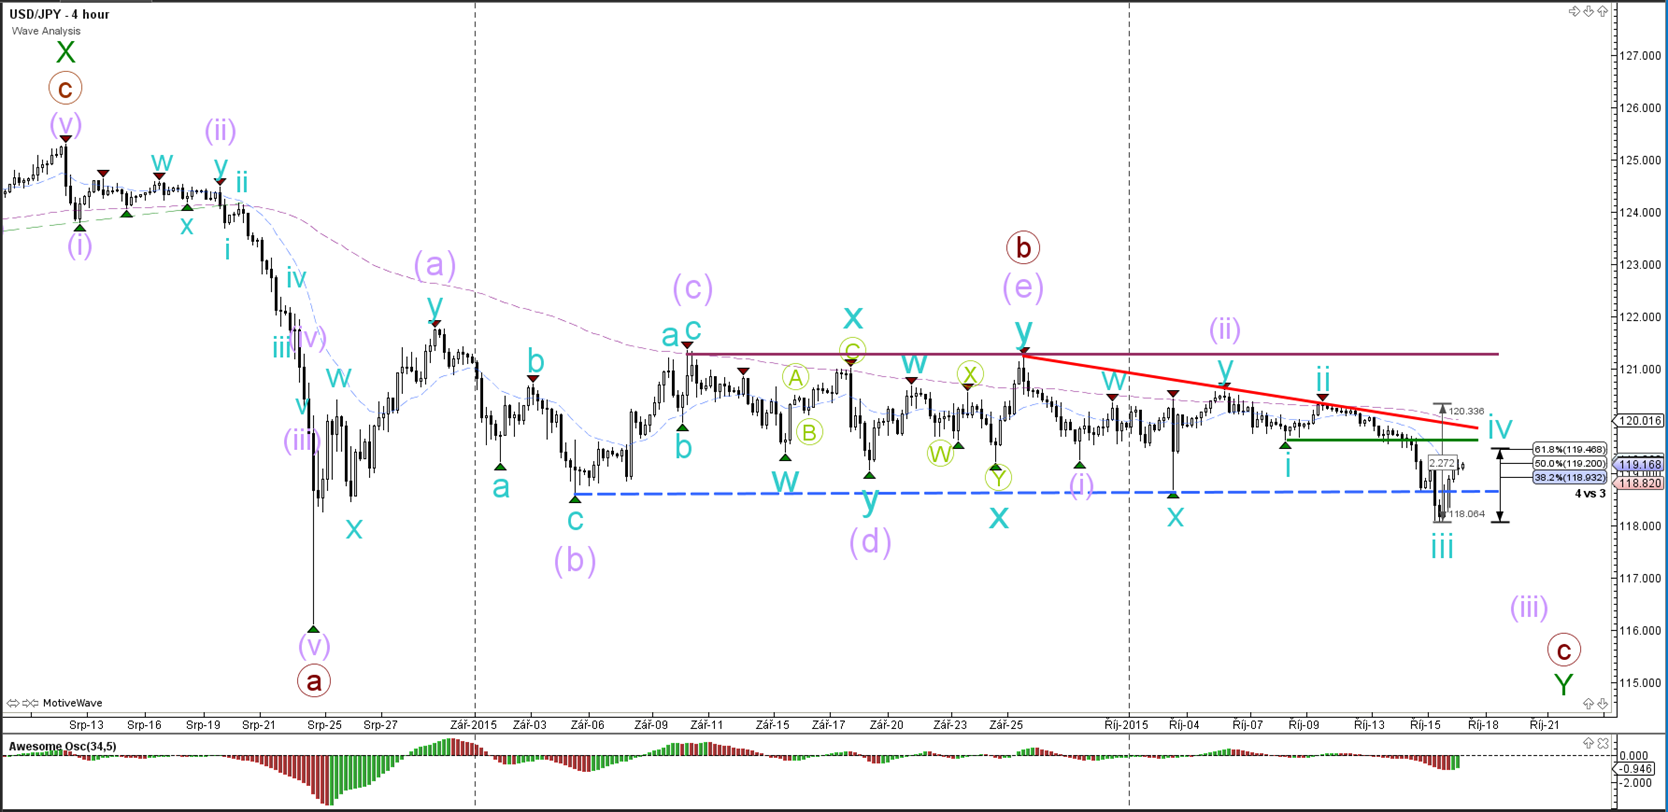
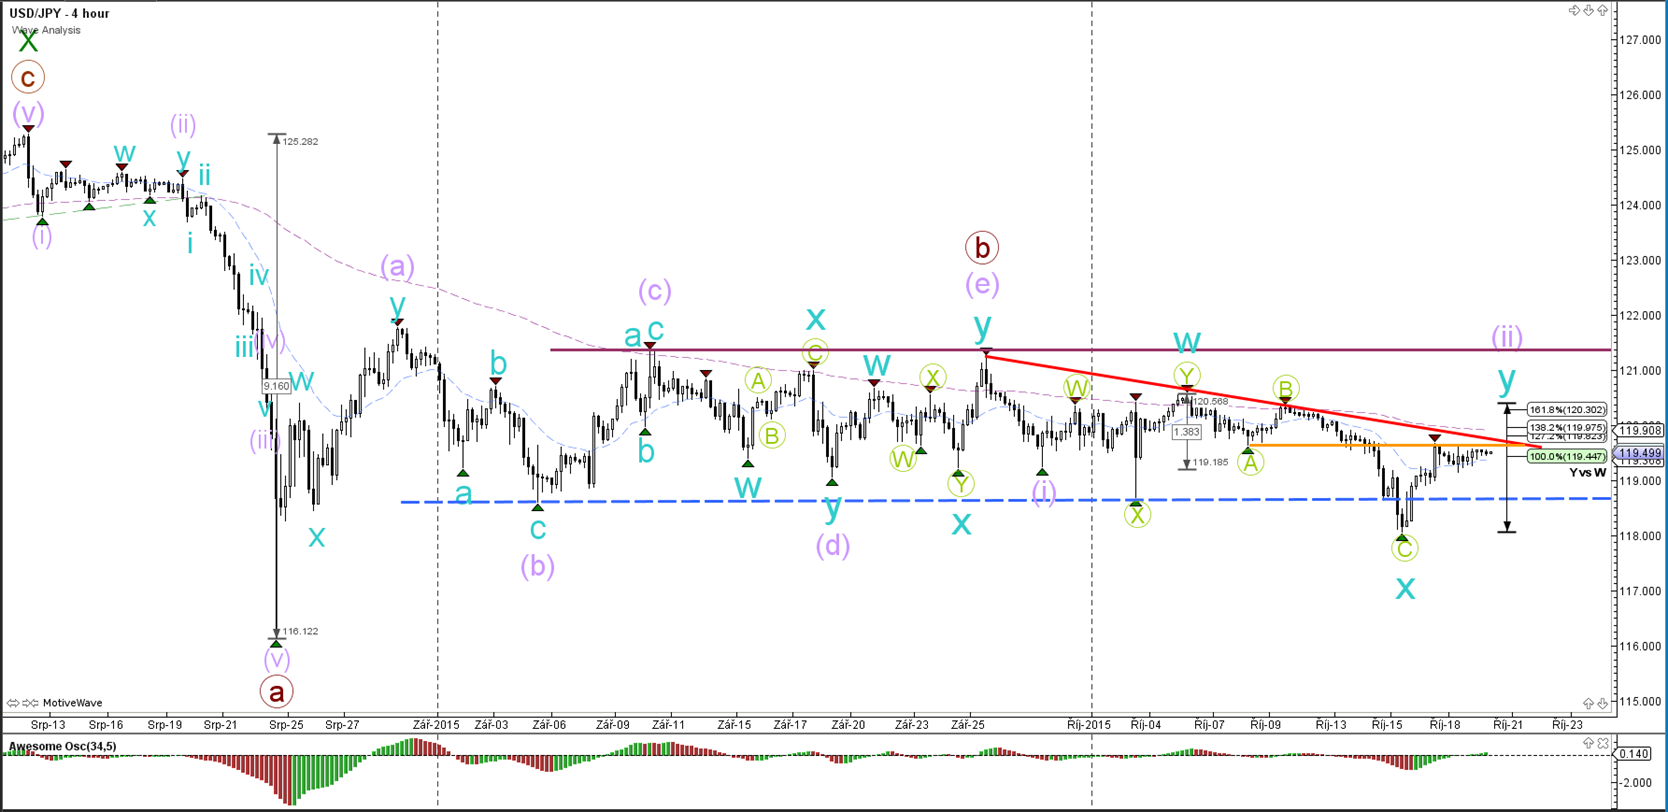
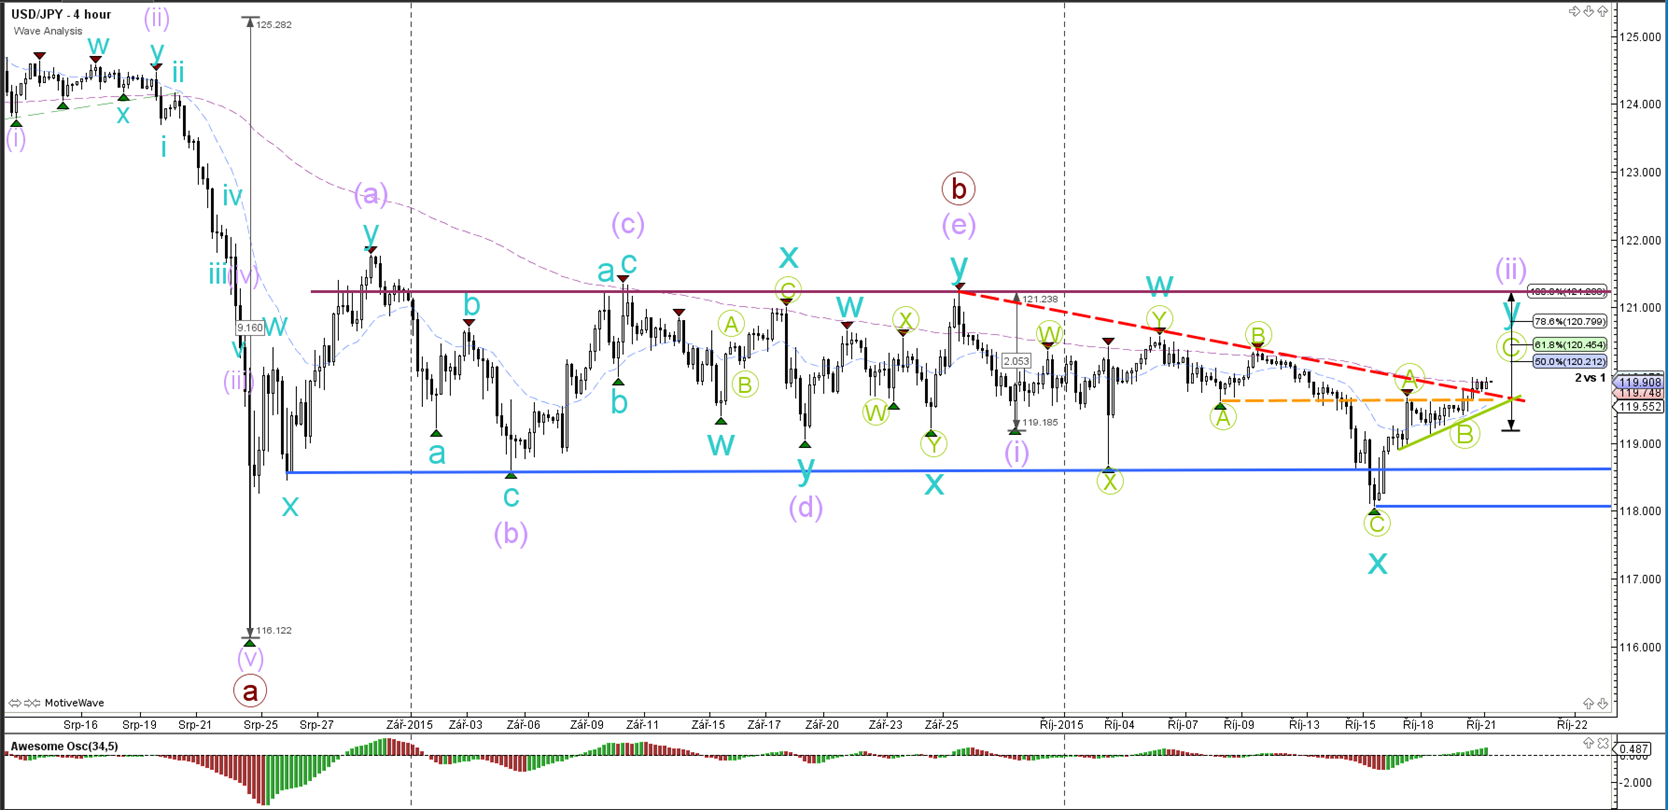
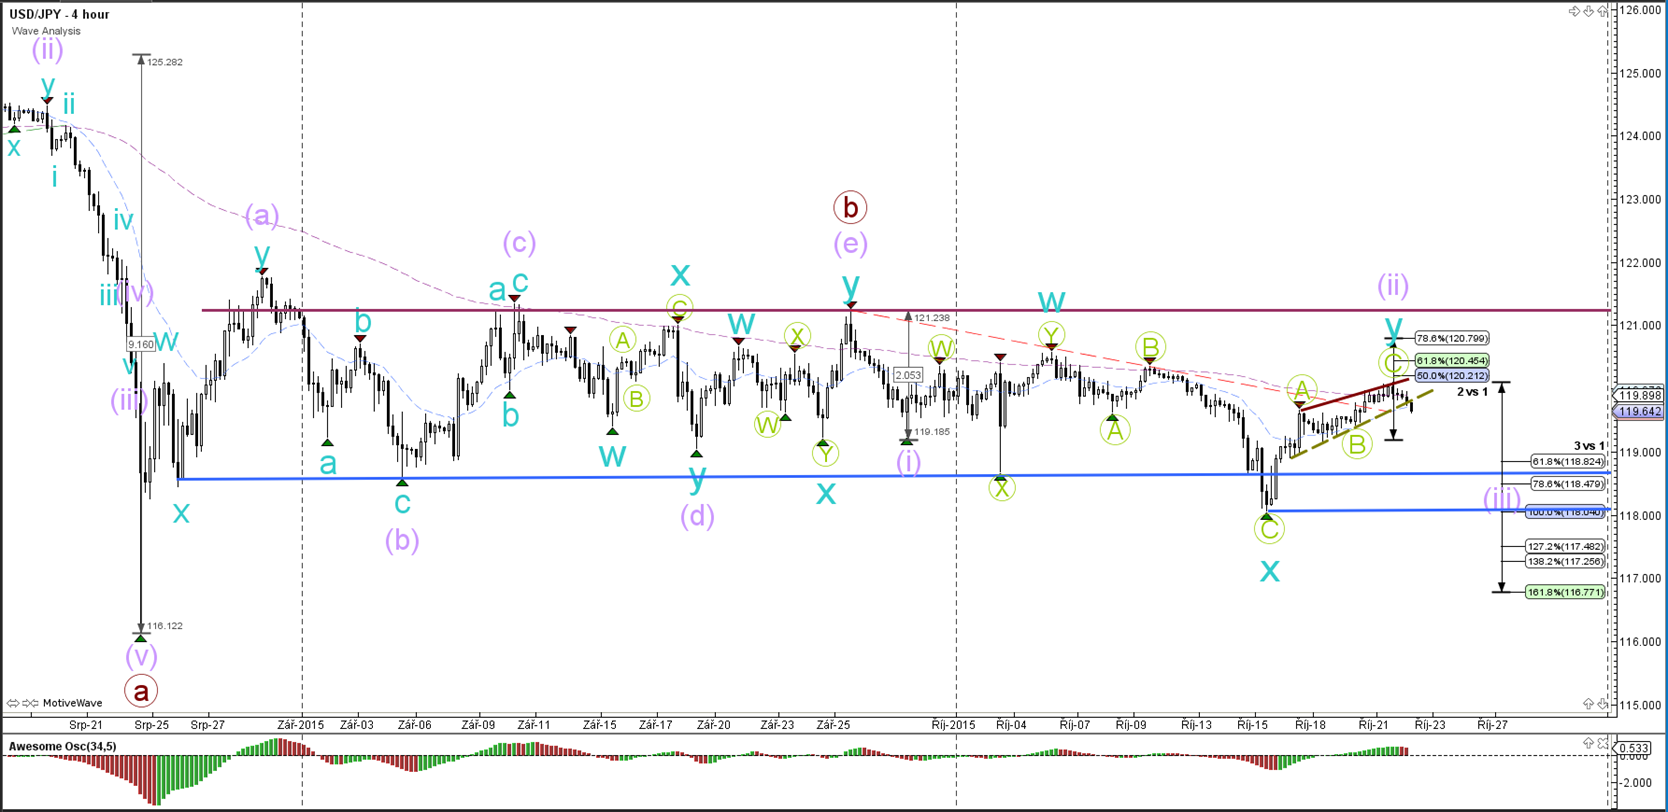
USD/JPY
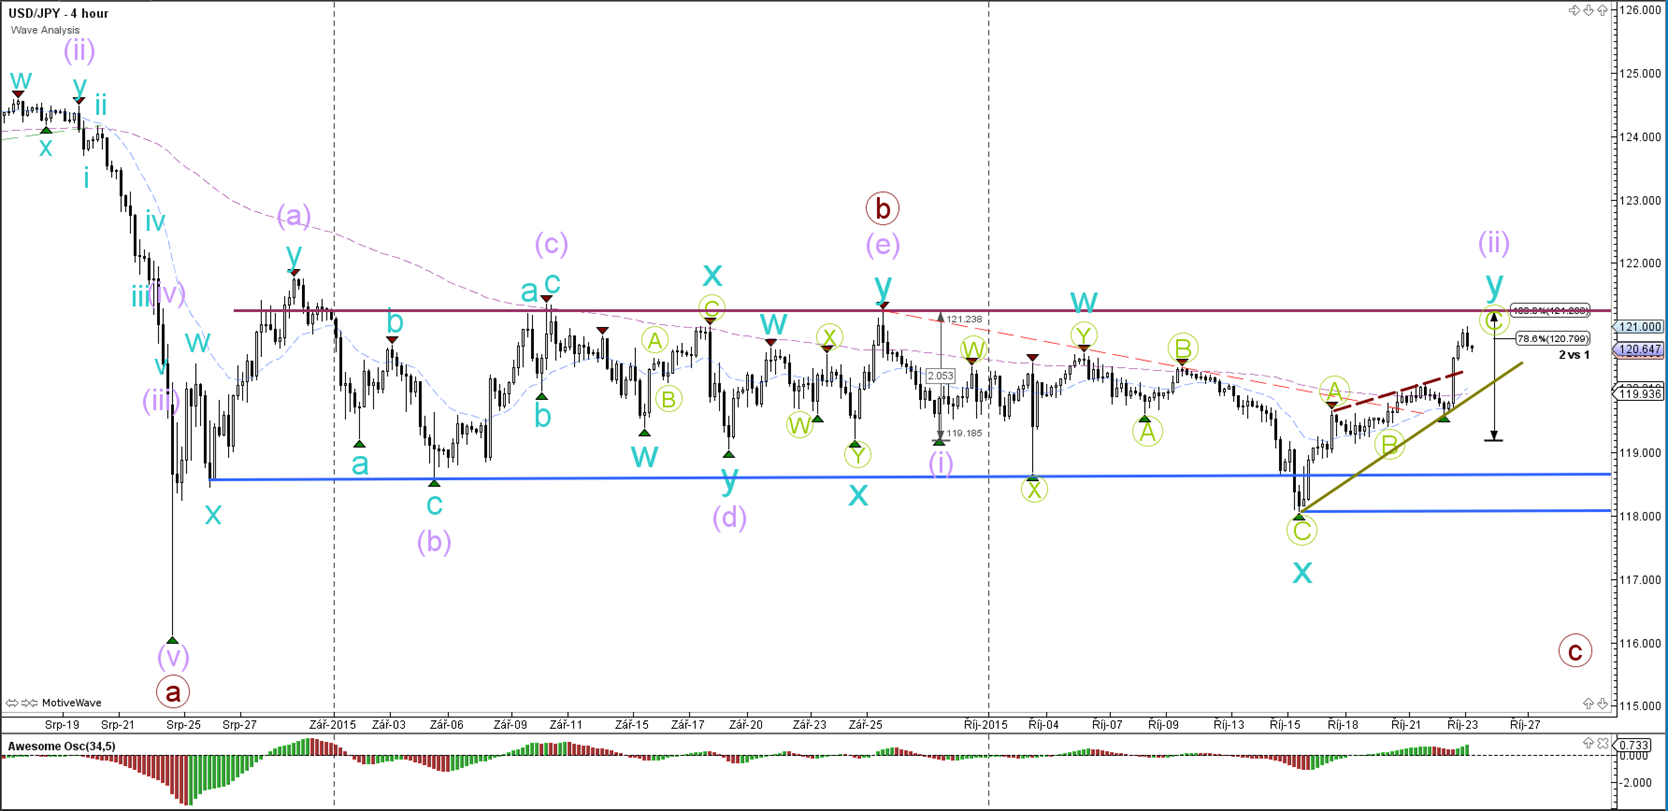
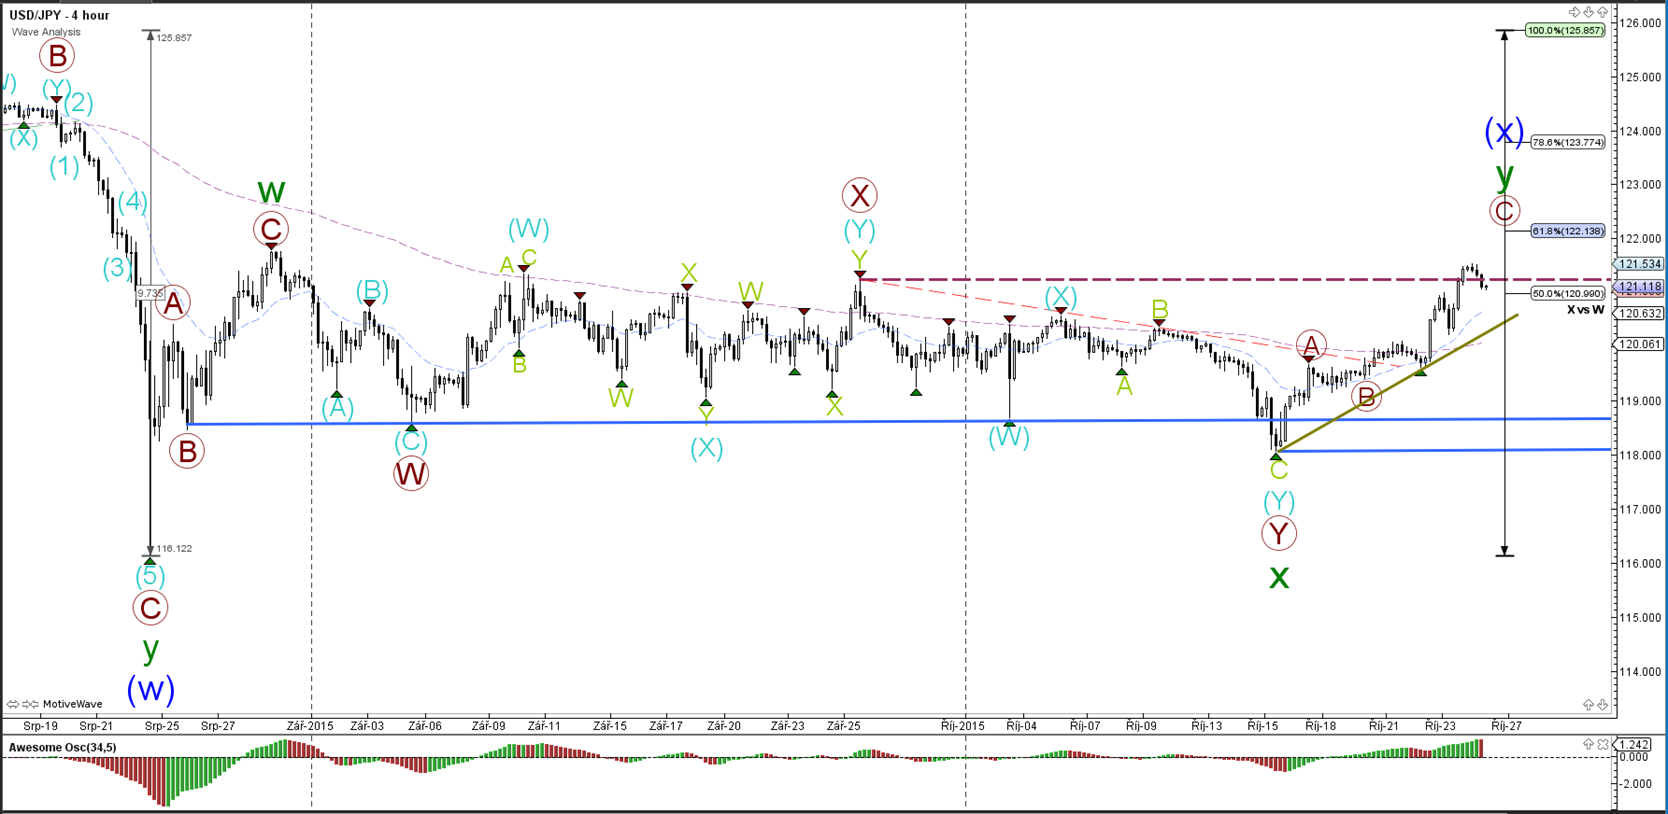
4 hour
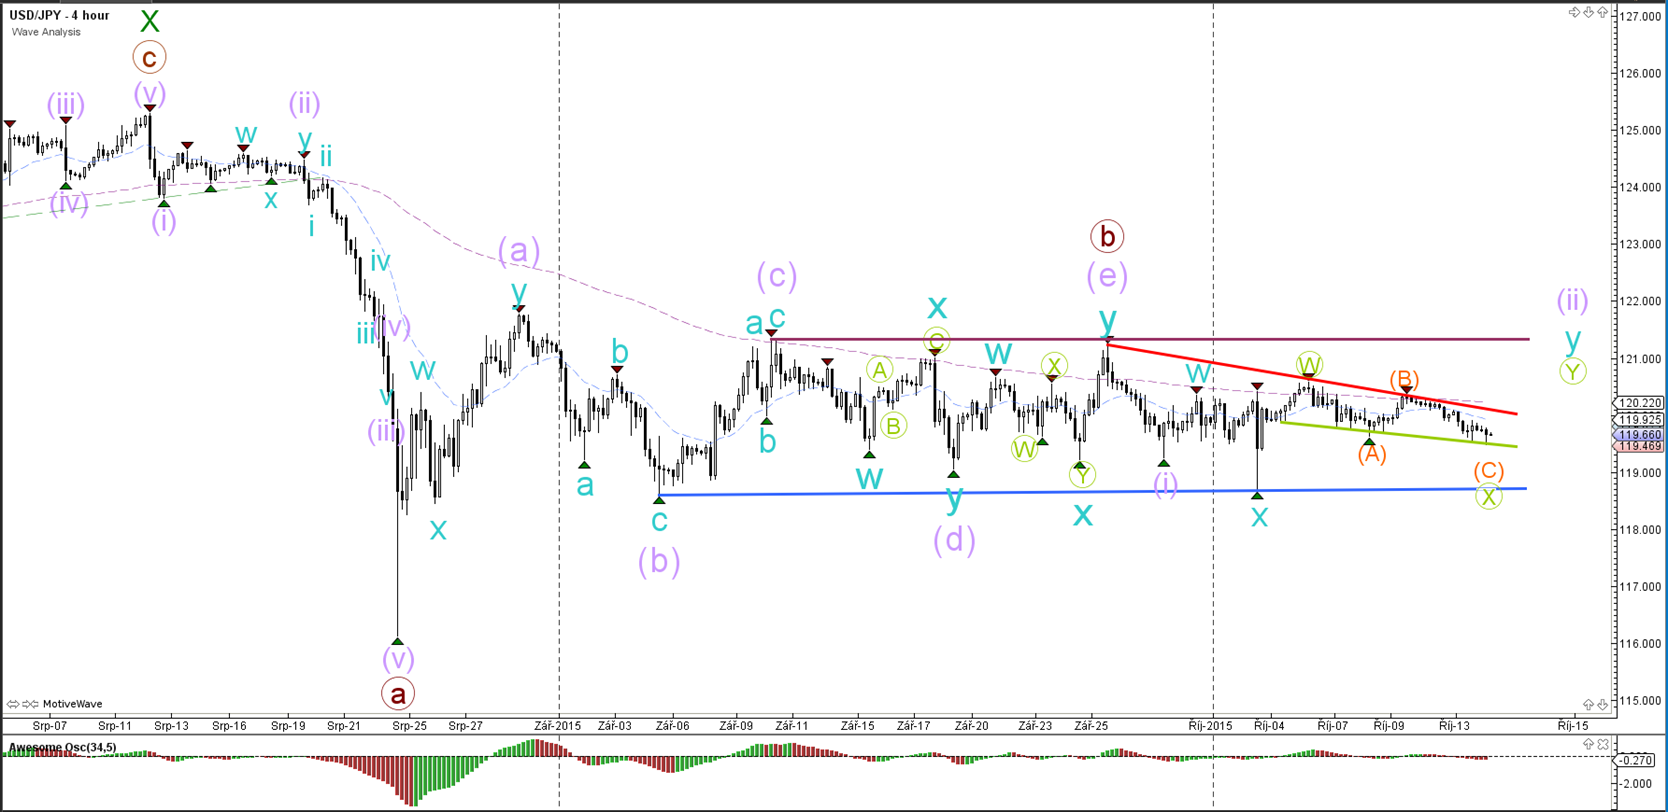
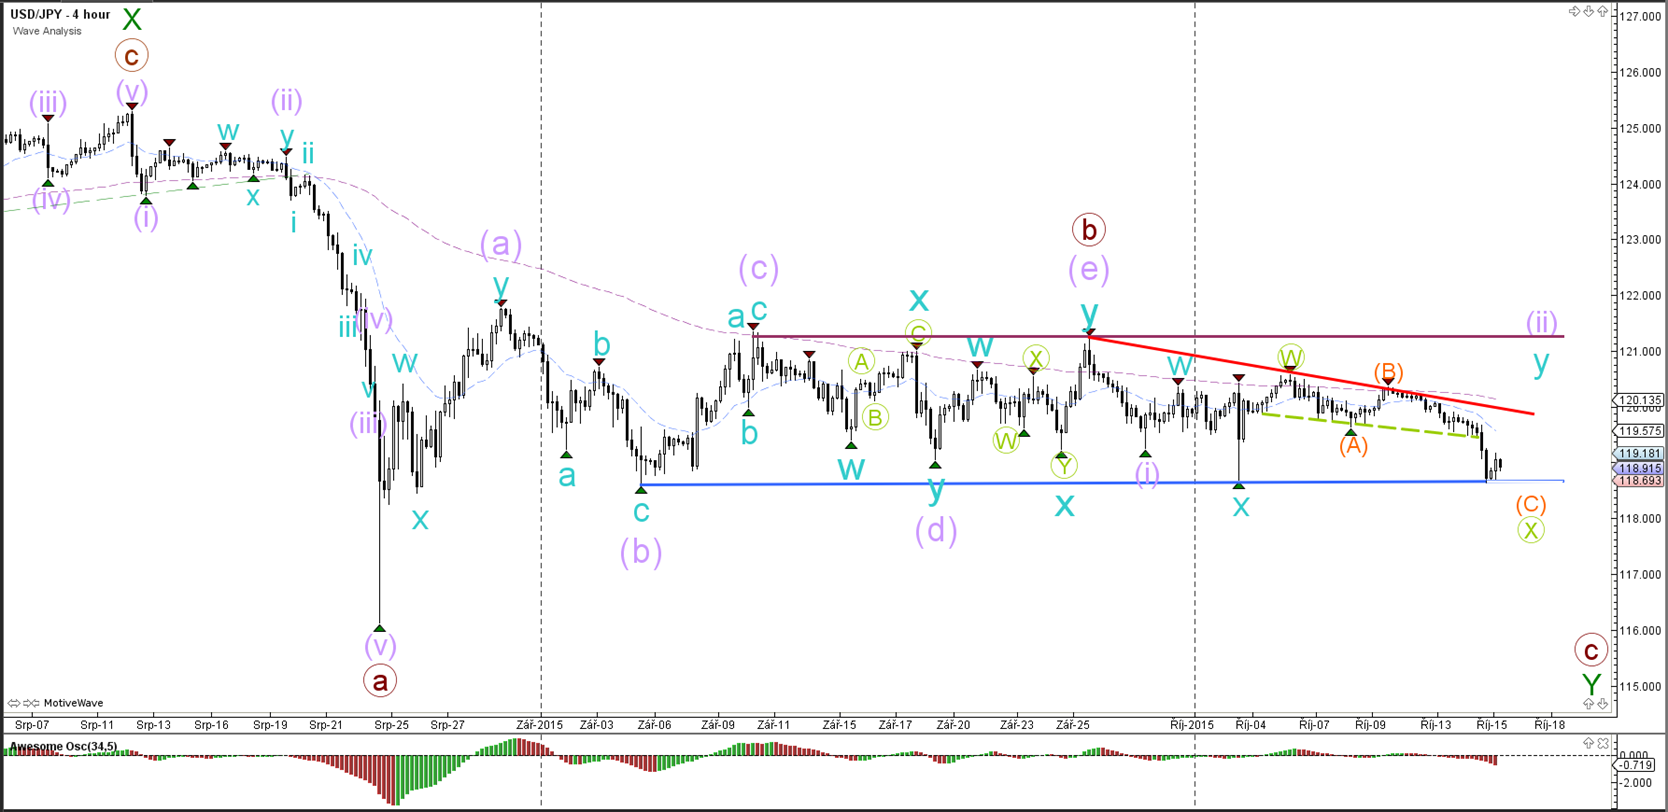
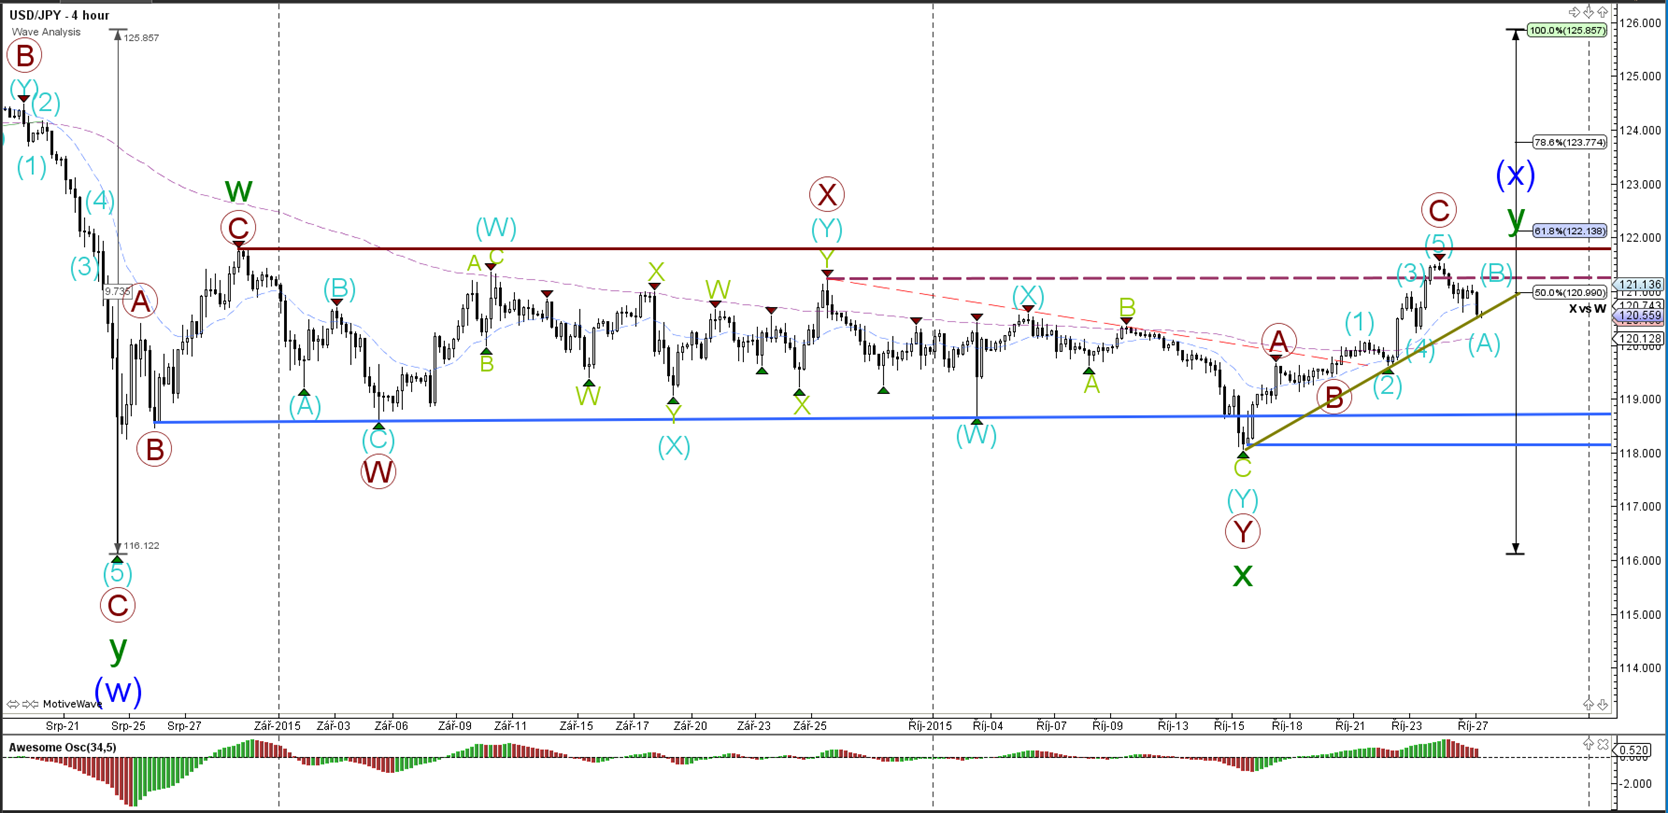
The USD/JPY remains very choppy and price action has significantly slowed down.
“Original analysis is provided by Admiral Markets”
EUR/USD
4 hour

The EUR/USD has shown a deep pullback within the potential wave 2 (brown) up to the 88.6% Fibonacci retracement level. A break above the purple line invalidates the current wave 1-2 (brown) structure.
1 hour
The EUR/USD made one more bullish push yesterday which could be explained by a wave 4 and 5 (green). Currently there is a rising wedge (red/green lines) chart pattern taking place on the 1 hour chart, which is most often a reversal signal. A break of the various support levels confirms the bearish potential, whereas a break above resistance invalidates the wave 2 (brown).
GBP/USD
4 hour

The GBP/USD posted a deep bearish retracement yesterday down to the 78.6% Fibonacci retracement level. A break below the support trend line (green) invalidates the wave B (green) and indicates that wave 2 (orange) has been most likely completed at the recent top (where wave A is now).
1 hour

The GBP/USD bounced at support (green) and price could have space up to the 100% Fibonacci target if price manages to break above the 61.8% Fibonacci target and then top (red).
USD/JPY
4 hour

The USD/JPY remains very choppy and price action has significantly slowed down.
“Original analysis is provided by Admiral Markets”