- Forex, Gold, BTC Market Analysis | Trading Signals
- Sive Morten- Currencies, Gold, Bitcoin Daily Video
You are using an out of date browser. It may not display this or other websites correctly.
You should upgrade or use an alternative browser.
You should upgrade or use an alternative browser.
Euro Forex Pro Weekly 31 May - 04 June 2010
- Thread starter Sive Morten
- Start date
Fernando Monera
Private
- Messages
- 10
I am LONG in EURUSD since last week (1.23059). Today I was able to close with profit that position and managed to improve my LONG position to 1.21505.
I am only based on Technical Analysis (4h, daily and weekly). I am LONG mainly because weekly and daily oscilators and other indicators told me to do so. Maybe a missinterpretation
Due to current volatility, I no longer trade intraday, and I read fundamentals only to support my decissions.
It is my bet that EURUSD will go up for some weeks. Well, at least this is my interpretation of the signals. That said, DO NOT take my comments too serious, I am just a newbie (and I lost a lot of money in EURUSD in recent weeks by the way).
yingkotj
Recruit
- Messages
- 3
sive
Hi sive,first i want to thank you for having the time to answer our questions,i know its really not that simple.i noticed you didn't open any position on your demo today,i have also been waiting to ask why your analysis are only based on eur/usd yet i noticed you open positions like eur/aud, aud/usd etc. form your demo account history,i know your answers may be personal but i trying to understand forex more from a grand master like you,please i hope you don't mind me asking.
Hi sive,first i want to thank you for having the time to answer our questions,i know its really not that simple.i noticed you didn't open any position on your demo today,i have also been waiting to ask why your analysis are only based on eur/usd yet i noticed you open positions like eur/aud, aud/usd etc. form your demo account history,i know your answers may be personal but i trying to understand forex more from a grand master like you,please i hope you don't mind me asking.
Sive Morten
Special Consultant to the FPA
- Messages
- 18,669
Hi sive,first i want to thank you for having the time to answer our questions,i know its really not that simple.,i have also been waiting to ask why your analysis are only based on eur/usd yet i noticed you open positions like eur/aud, aud/usd etc. form your demo account history,i know your answers may be personal but i trying to understand forex more from a grand master like you,please i hope you don't mind me asking.
Hi, Yingkotj
well, the primary reason for that is lack of time. Unfortunately, I can't cover many currency pairs here. But, from time to time, I've posted some material about other pairs - GBP/USD and JPY/USD.
Besides, the analysis tactic is the same for any pair. This part of forum mostly educational, rather then is for particular trading signals (Although that is happened also). I just try to give you a direction, share with my expectations and warn you about possible hidden unwelcomed stuff.
i noticed you didn't open any position on your demo today
I've opened twice
. As I've noticed - 1.2240 the level from which upove should start. If it will not - I'll be a seller. The main downmove starts after 1.2240 breakout. So, I sell two times - both of them were a scalp trade. And have closed my long position with shallow loss.
Sive Morten
Special Consultant to the FPA
- Messages
- 18,669
EUR/USD Update, Wed, 02 June
Gud'day Everybody.
Here is my thoughts for now.
First of all, as I've said for millions of times - market will break your heart. Everybody thought yesterday that this was a breakout and we should continue down move, but this has not happened. And I want to remind that this is a trading market right now for me. This means no long-term positions, only intraday trading.
As Sentinel has mentioned already, we have a W&R of previous lows that, in fact, should intend us to the Buy side -stops below lows were hit and market has made a reverse move. But not everything so simple.
In fact, I have a bearish bias on the market despite W&R. And here is my explanation.
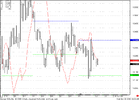
This is a 4-hour chart (I have some problems with software, so dont pay attention to that).
First of all - look, , market has touched weekly pivot and couldn't to get through it.
Second - look at MACDP failures. During last 4 bars - trend looks turns bullish, but when bar closed - this wasn't confirmed. And this was 4 bars in a row.
Third, I have a Crude oil bearish position and I expect that it has to reach 70.55$ area (My enter at 74.54$ couple days ago). This is relatively confirms bearish bias.
So, conclusion - I'm short now and expect that yesterday stops should be hit. My s/l at 1.2290, if it will be reached then 4-hour trend turns bullish and my issue will be failed.
It's difficult to trade current market, may be everything is not so complicated, as I think and Sentinel is right - we can go higher. You should listen, but make your own decision. I just share my thoughts with you and try to show that you may be do not see yet... So, for those who intend to go long - more safe to wait until 4-hour bullish trend will be confirmed, then enter on retracement
At the same time, as I've said, this is trading market right now, so I keep my risk absolutely at reasonable level.
BTW, you can track this trade on demo. It's already in place. As a target I've choose Fib support at 1.2020 (my t/p just a bit above of it).
Good luck to everybody.
Gud'day Everybody.
Here is my thoughts for now.
First of all, as I've said for millions of times - market will break your heart. Everybody thought yesterday that this was a breakout and we should continue down move, but this has not happened. And I want to remind that this is a trading market right now for me. This means no long-term positions, only intraday trading.
As Sentinel has mentioned already, we have a W&R of previous lows that, in fact, should intend us to the Buy side -stops below lows were hit and market has made a reverse move. But not everything so simple.
In fact, I have a bearish bias on the market despite W&R. And here is my explanation.
This is a 4-hour chart (I have some problems with software, so dont pay attention to that).
First of all - look, , market has touched weekly pivot and couldn't to get through it.
Second - look at MACDP failures. During last 4 bars - trend looks turns bullish, but when bar closed - this wasn't confirmed. And this was 4 bars in a row.
Third, I have a Crude oil bearish position and I expect that it has to reach 70.55$ area (My enter at 74.54$ couple days ago). This is relatively confirms bearish bias.
So, conclusion - I'm short now and expect that yesterday stops should be hit. My s/l at 1.2290, if it will be reached then 4-hour trend turns bullish and my issue will be failed.
It's difficult to trade current market, may be everything is not so complicated, as I think and Sentinel is right - we can go higher. You should listen, but make your own decision. I just share my thoughts with you and try to show that you may be do not see yet... So, for those who intend to go long - more safe to wait until 4-hour bullish trend will be confirmed, then enter on retracement
At the same time, as I've said, this is trading market right now, so I keep my risk absolutely at reasonable level.
BTW, you can track this trade on demo. It's already in place. As a target I've choose Fib support at 1.2020 (my t/p just a bit above of it).
Good luck to everybody.
Attachments
Last edited:
dragan lukic
Recruit
- Messages
- 16
Hi everybody,
Do someone can explain me what is W&R i MACDP.
Thank you in advance.
Do someone can explain me what is W&R i MACDP.
Thank you in advance.
Hi everybody,
Do someone can explain me what is W&R i MACDP.
Thank you in advance.
You should read Joe DiNapoli's book for these and all the other terms discussed here such as Confluence, Agreement, LOP, XOP, COP, OP, DeREPO, RailRoad Track, Bread & Butter, Fib Squat, Bushes, Minesweeper etc..
W&R - Wash & Rinse - Here is Sive's answer to my question on this forum about W&R :
Yes, Sentinel, you're right about W&R. DiNapoli did not pay much attention to this very very important signal.
For me, it's not a separate signal (but you can use it as it is also), but W&R is an imortant confirmation of the level.
When market break level and then make return move (better if it happens fast and return move has a signs of thrust) - this is W&R. It's simplier to see than describe.
Just look on hourly chart and price behavior around 0,618 of double repo support. This is W&R. If I find some another examples - I will post it.
How it works...
Well, when market stays above the level for a some time, new participants enter market on buy side at this level with s/l below it. It's not nessesary, that it should be Fib level. It can be a common technical support and resistance. Market makers see these s/l orders. When value of orders become sagnificant, market-makers break the level with huge selling (usually on thin market or during data release) and close their positions by purchasing of the s/l selling orders. So the profit of m-makers - difference between price above the level and s/l sell orders. When m-makers has closed their possition and there is no selling orders under the level - price makes fast return up and starts to rise.
MACDP - Moving Average Convergance Divergence Predictor : An Indicator showing the exact price the current and next (future) bar will need to achieve for the MACD to cross.
Last edited by a moderator:
Similar threads
- Replies
- 14
- Views
- 295
- Replies
- 6
- Views
- 241
- Replies
- 10
- Views
- 231
- Replies
- 7
- Views
- 205
- Replies
- 11
- Views
- 261
- Forex, Gold, BTC Market Analysis | Trading Signals
- Sive Morten- Currencies, Gold, Bitcoin Daily Video