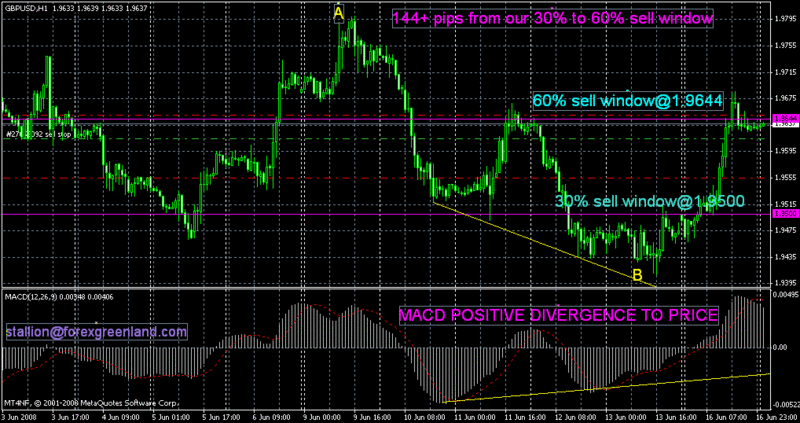
1.9668-1.9428=0.024
0.3 * 0.024=0.0072
1.9428+0.0072=1.9500(sell window)
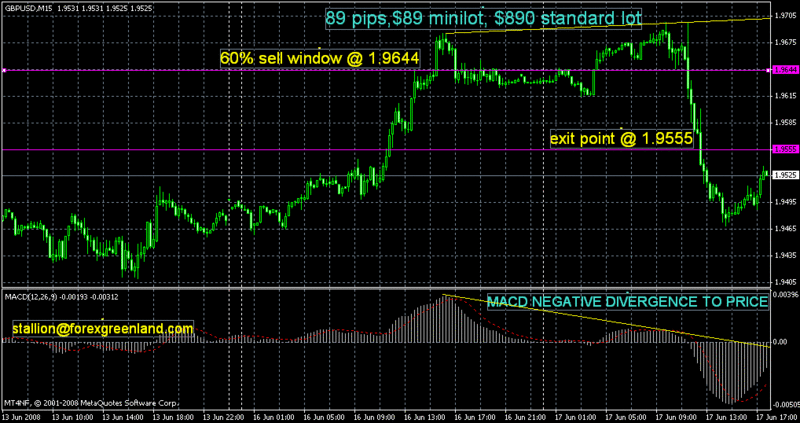
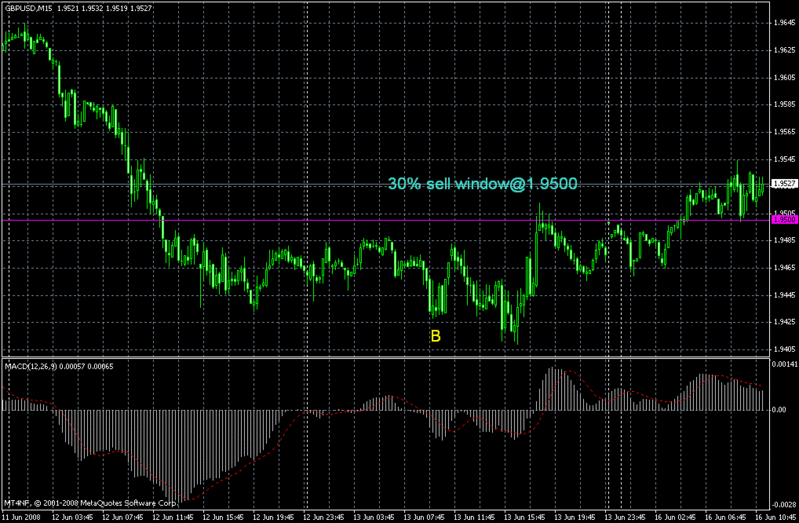
Helloo masif,well I was tempted to use the 60% sell window or retracement as you called it but looking at price action going on that friday, looked to me that the 30% sell window would have been much more realistic, even addind 20 pips more to it. Maybe traders were overly cautious of the notorious Black Friday the 13th or whatever mumbo jumbo its called. Even at that, we noticed price depressed down below the low(B) at London news session, tearing off stops before going upwards to the 30% sell window of 1.9500.
Though it eventually hit the 1st target point of 1.9520 this Monday, it was just too close for comfort. Too bad we ran into the begining of a 1-2-3 bottom before price took off.So we should be looking for the 2nd target to be hit if you are already on that pair.
Well, onwukarisa,I must say that the random walk theory does not usually come into play in the markets neither are there randomness in price action. The points(A and B) that you see on the chart diagram is taken from the highest high to the lowest low of price movement.from there, you can apply your buy and sell windows.
Please understand the buy and sell are synonymous to the fibonacci retracement levels which tend to work amazingly if you know how to use it dynamically as price moves along. Due to the fact that different traders have different levels of skills and know how, that is why it is simplified as BUY and SELL windows
0.3 * 0.024=0.0072
1.9428+0.0072=1.9500(sell window)
Hi forexgreenland,
did you use the 60 percent retracement for the above as well?
Helloo masif,well I was tempted to use the 60% sell window or retracement as you called it but looking at price action going on that friday, looked to me that the 30% sell window would have been much more realistic, even addind 20 pips more to it. Maybe traders were overly cautious of the notorious Black Friday the 13th or whatever mumbo jumbo its called. Even at that, we noticed price depressed down below the low(B) at London news session, tearing off stops before going upwards to the 30% sell window of 1.9500.
Though it eventually hit the 1st target point of 1.9520 this Monday, it was just too close for comfort. Too bad we ran into the begining of a 1-2-3 bottom before price took off.So we should be looking for the 2nd target to be hit if you are already on that pair.
I will like to know how you do choose your points in your diagrams. that is your point A and B. can i just choose it randomly
Well, onwukarisa,I must say that the random walk theory does not usually come into play in the markets neither are there randomness in price action. The points(A and B) that you see on the chart diagram is taken from the highest high to the lowest low of price movement.from there, you can apply your buy and sell windows.
Please understand the buy and sell are synonymous to the fibonacci retracement levels which tend to work amazingly if you know how to use it dynamically as price moves along. Due to the fact that different traders have different levels of skills and know how, that is why it is simplified as BUY and SELL windows