Sive Morten
Special Consultant to the FPA
- Messages
- 18,699
Monthly
Investors moved to the safety of the yen and Swiss franc on Friday, unnerved by escalating tensions between the West and Russia over Ukraine, and also took advantage of higher yielding Pacific currencies. Mixed U.S. data in recent weeks has left investors without a clear trend, which is now being trumped by the geopolitical concerns in Europe, a combination that has made placing big bets on currency movements high risk endeavors. "Neither of these two themes are dominant and if you play on one you get hit with the other, which is why today I think we are seeing a little bit of buying of Pacific currencies," said Steven Englander, global head of G10 FX strategy at CitiFX in New York. "I wouldn't say the economic news out of Asia has been good but it is far from the eye of the storm, and if you can pick up a bit of yield there, people are sitting around saying, Why not?" he added.
Next week's euro zone April flash inflation report and April U.S. employment data are the key economic events that could pull attention away from Ukraine. The dollar fell to 102.13 yen , down 0.16 percent on the day and its worst levels in a week. The greenback slid 0.04 percent to 0.8808 Swiss francs, having fallen to a one-week low of 0.8798 franc earlier in the day.
With tensions between Ukraine and Russia high, Ukrainian Special Forces launched a second phase of their operation in the east of the country on Friday, an official on the presidential staff said. The United States said it was prepared to impose further targeted sanctions on Russia over its actions in Ukraine and that European leaders had agreed to coordinate on steps to make Moscow pay.
Risk aversion has supported the yen, said Credit Agricole FX strategist Manuel Oliveri. "But geopolitical risks are not having too much of an impact on currencies, with most investors still focused on growth prospects. If risk sentiment improves, the yen will be sold off," he said.
Volumes in euro/Danish crown trades picked up for a second day, according to Reuters Matching. The euro recovered from a near three-month low against the crown of 7.4614 to trade at 7.4649 crowns. The crown strengthened after the Danish central bank surprised the market by raising the rate on certificate of deposits and ending a regime of negative interest rates in a bid to stem outflows and support the currency.
Technical
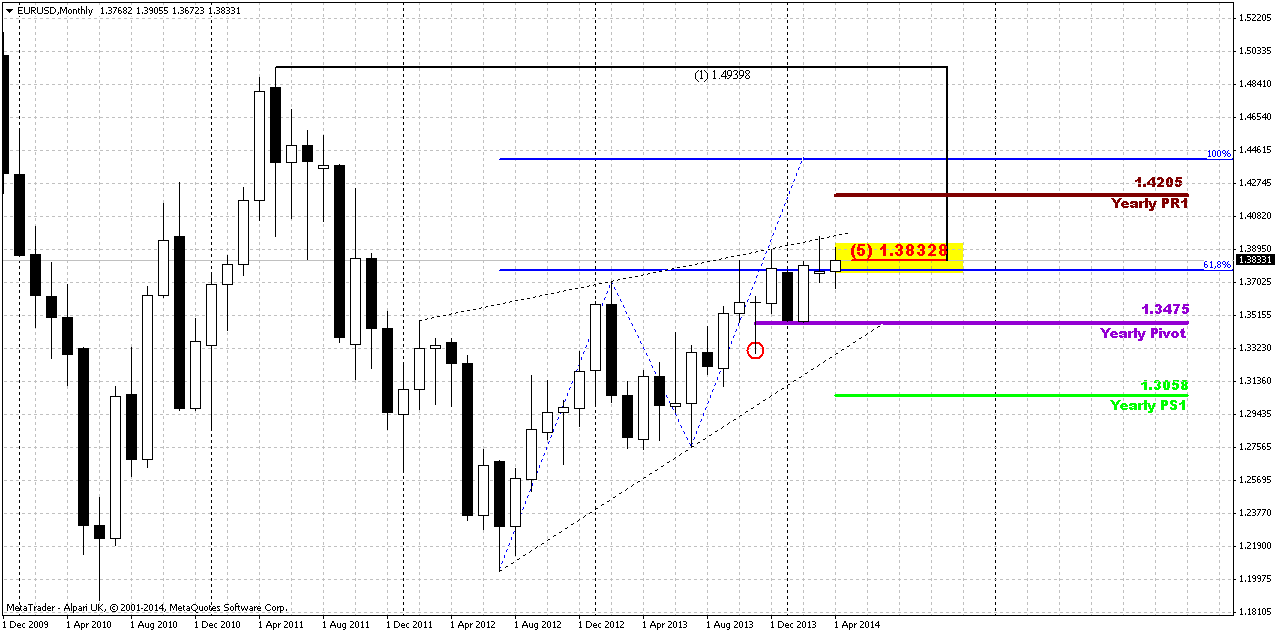
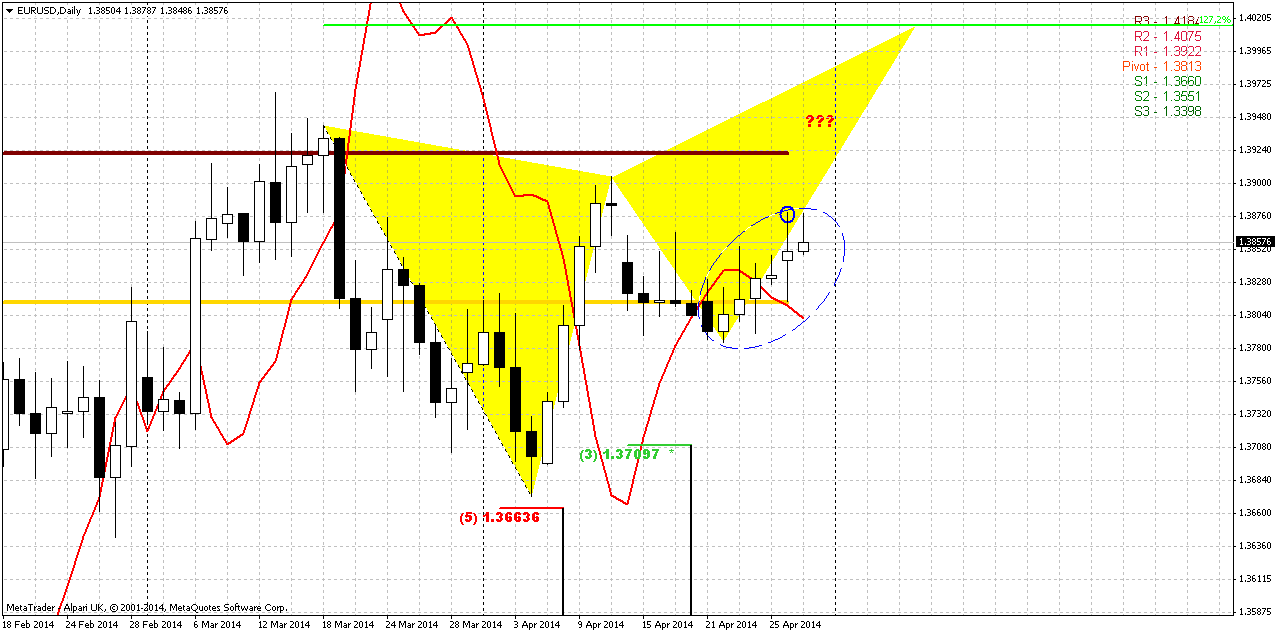
Since our previous research price has changed only for 30 pips – this is too small difference to make any impact on monthly chart. Our major concern here stands around breakout moment of 1.3830 Fib resistance and Agreement. That is also long-term downward trendline. We see that market has challenged this level twice already, but still stands below it and April action doesn’t look impressive yet here. In fact market stands in tight range since 2014. Thus, 1.33-1.3850 is an area of “indecision”. While market stands inside of it we can talk about neither upward breakout nor downward reversal. At least, reversal identification could be done with yearly pivot – if market will move below it, this could be early sign of changing sentiment. But, as you can see, nothing among this issues have happened yet. The same has happened on previous week. Only recently we’ve disccused, as it was seemed, downward bounce out from 1.3850 level. But today we see that price has returned right back up to it.
Returning to discussion of Yearly Pivot - we’ve noted that upward bounce has started precisely from 1.3475 level. Now the major question stands as follows – whether this upward action is a confirmation of long-term bullish sentiment or just a respect of YPP first touch. Following the chart we see very useful combination for us – YPP stands very close to 1.33 – our invalidation point. And if market will move below YPP this will become bearish moment by itself.
Speaking about upward continuation, market mechanics does not allow price to show any deep retracement any more. Any move of this kind should be treated as market weakness and it will increase probability of reversal down. Take a look that as market has hit minor 0.618 AB-CD extension target right at former rock hard resistance – Fib level and Agreement and former yearly PR1, it has shown reasonable bounce down to 1.33. As retracement after 0.618 target already has happened, it is unlogical and unreasonable to see another deep bounce and if it will happen - it will look suspicious.
So, speaking about monthly upside targets... If we will get finally real break through resistance, we have two major targets – AB=CD one around 1.44 and Yearly PR1 = 1.4205.
Thus, here we can make following conclusion – nothing drastical yet, market still coiling near resistance and we can continue to stick with working range for nearest perspective on monthly chart – an area between YPP=1.3475 and resistance around 1.3850. Monthly chart can’t give us direction yet and we need to find something else to trade on lower time frame charts.
Weekly
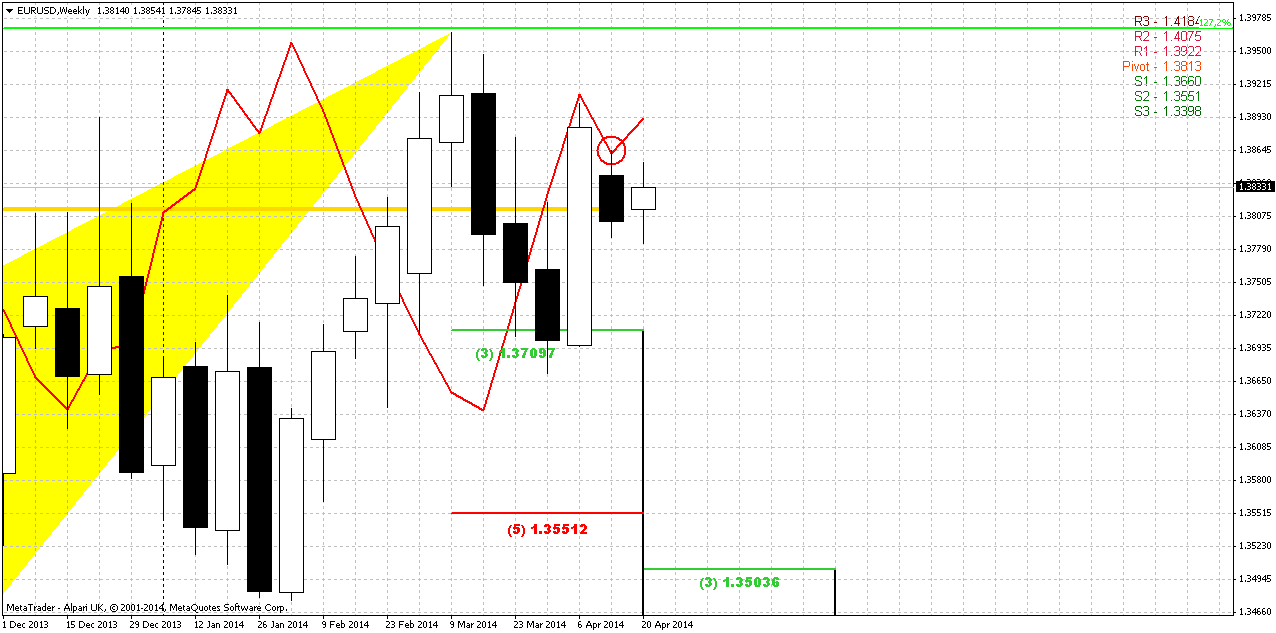
On passed week market has shown solid recovery. That’s beaing said – major question is what this recovery was? Currently I mostly gravitate to conclusion that this is some kind of momentum action, since previously market has moved up for considerable period of time and recent recovery is just an inertness - attempt to continue move up, some kind of exhausting action of former upward rally. If we would have, say, 8 weeks of upward action in a row and not just 6 weeks – we could indentify B&B “Buy” trade. We didn’t do this, but the core of this action could be the same – recent long upward candle could be not new upward trend but last part of former trend.
In fact, as we’ve seen on monthly chart, and on the weekly – if you will contract chart, we will get long-term wedge. Usually wedges are reversal or exhausting patterns, but sometimes they could be broken in unexpected direction. Anyway, any breakout usually accompanied by strong acceleration.
At the same time we have completed bearish butterfly pattern that suggests deeper retracement down, at least to 3/8 Fib support of whole butterfly action. This level stands at 1.35-1.3520 K-support area and Yearly Pivot. Previously we’ve made suggestion that market could show some respect and bounce up as reaction on current support area, but after that some downward continuation should follow. Major concern was about how this will happen. On previous week we have identified bearish stop grabber. It tells us that market should at least take out former lows and to form AB=CD down. Depending on how fast this move will be – may be later we will switch to 1.27 target that creates an Agreement precisely with minimum target of butterfly and weekly K-support.
On recent week market has shown minor upward action, but the range of the week was even tighter than the week before. Price was not able to take out the high of grabber and that means that it is still valid. The one moment that could be not very nice for bears is MPP – market has moved above it again, but this moment itself can’t erase grabber pattern.
EUR situation is sophisticated fundamentally as well. As we’ve noted earlier – any signs of EUR appreciation will trigger monetary easing steps from ECB. Thus, it will press on market participants and could help downward action on EUR. But let’s hope that major US economy data finally will lead current indecision situation to some result.
Thus, as we have bearish pattern on weekly accompanied by divergence – our direction is down, until market either will not complete it or grabber will fail.
Daily
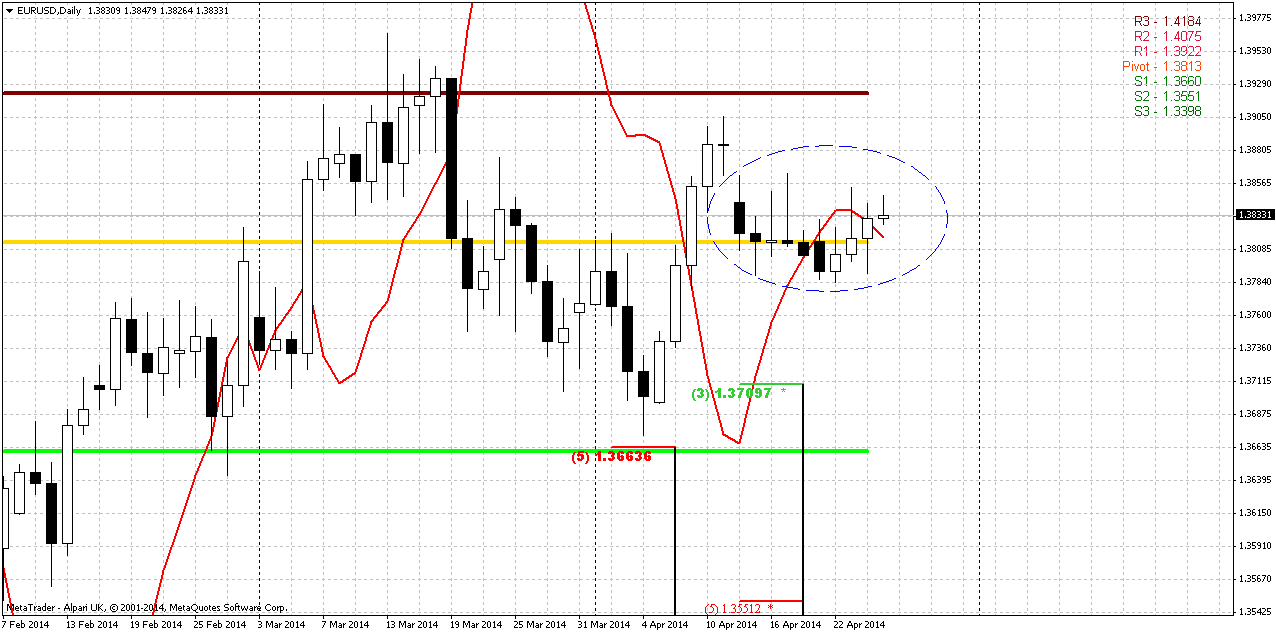
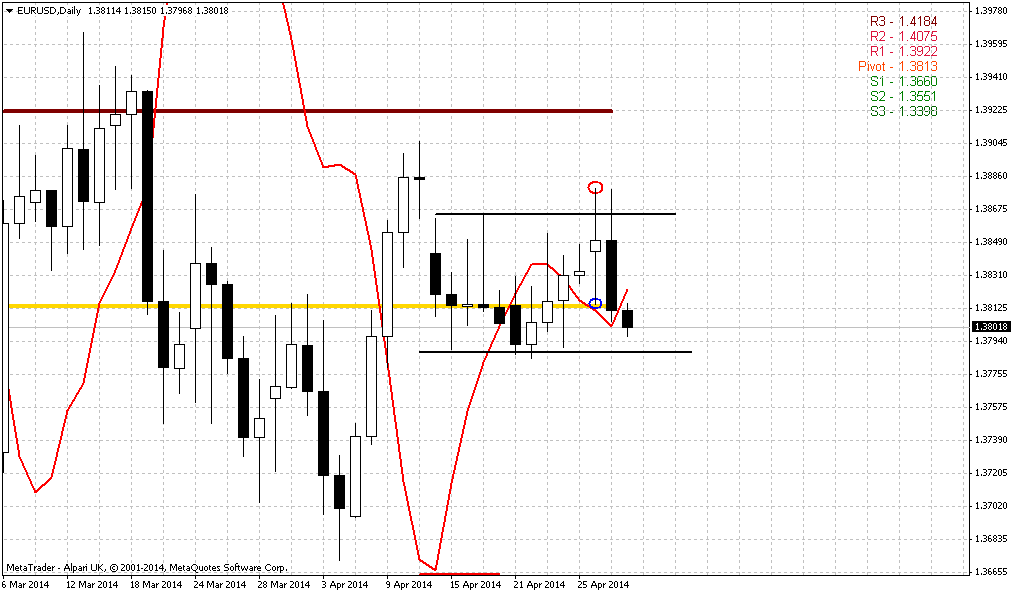
Here guys, I still can’t find solution for the riddle. Recent move up what was it? Does it mean something or we should just ignore it. Why this upward action has happened at all? At first glance this could be insignificant, but this recent small action could become a clue. Why? It does not match overall picture of patterns on weekly/daily setup. I can’t build it in harmonic and logical picture of weekly and daily price behavior. Take a look by yourself. Everything looks good till recent week – we have weekly butterfly that has triggered retracement down. When first leg down has been completed, market by reasonable rest of momentum has shown upward recovery. This recovery has completed by again reasonable bearish grabber that suggests appearing of second leg of retracement down.
And now take a look what has happened – right in the beginning of this leg down market takes some unclear pause, moves above MPP. In fact, market stands flat for 2 weeks around MPP. Even more – we can see small bullish dynamic pressure on daily, when price moves against MACD direction and in general this behavior stay out of overall situation, does not match it. What we should to do with this? May be use this move up as a chance for short entry, because we still have bearish patterns on weekly chart? Or vice versa – stay aside and wait?
My thought is as follows. Despite how curious and unsupportive this action stands in relation to bearish direction – I do not want to take long position, because one way or another but we still have bearish valid patterns on weekly chart. That’s why conservative tactics will be – do nothing and wait for more clarity and signals. If bearish patterns will be destroyed – that will be another tune.
Second way is for those who ready to take small risk and take short position. This tactics is aggressive and mostly based on idea of small potential loss, but not on hard rock reliable and flawless setup. Since market has come very close to invalidation point of weekly grabber – this will give us chance to take short position very close to invalidation point. This significantly reduces risk and increases attractiveness of risk/reward ratio. Because if market still will turn down and we currently do not have 100% reasons to exclude this scenario – this will be very fast move down, I suppose. May be all this strategy smells like “pain or gain” and gambling, but actually we do not have much choice around EUR right now. That’s why I’ve said – that this is not for everybody. Choice you will have to make by yourself, as usual.
4-hour
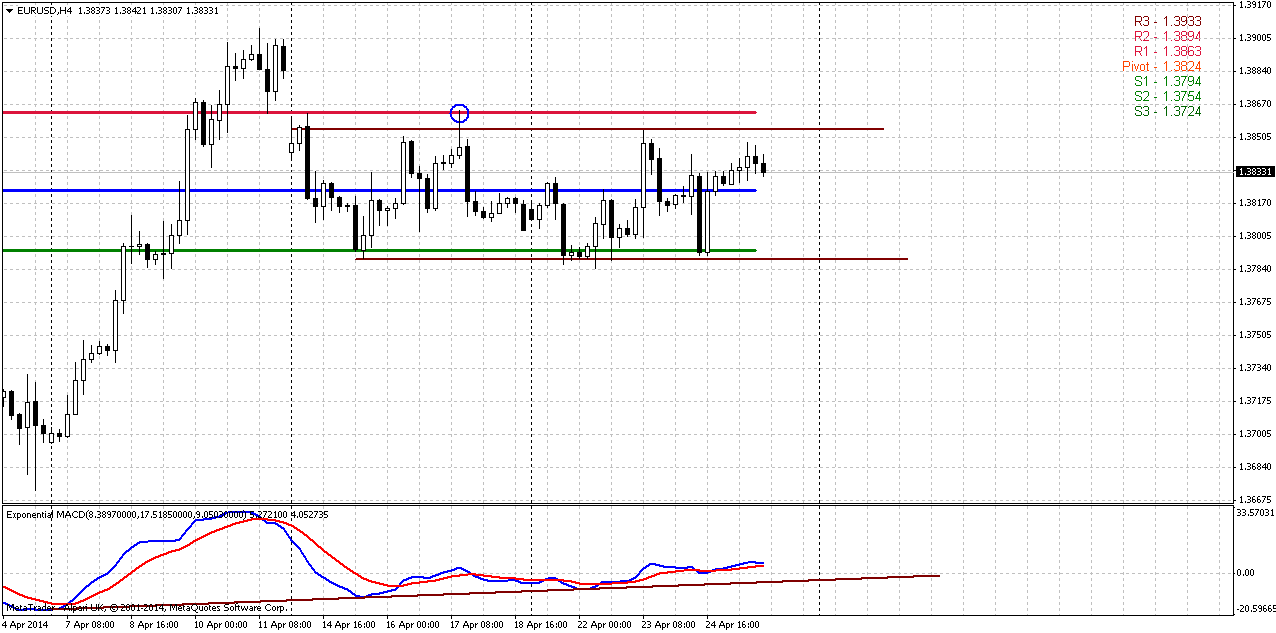
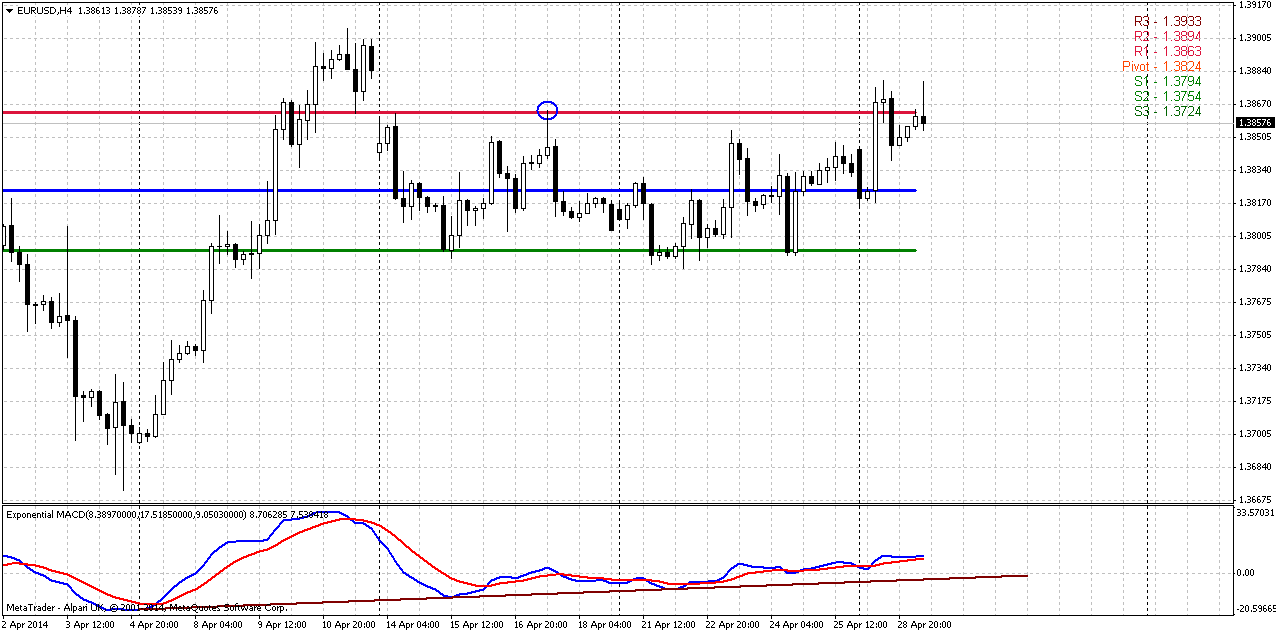
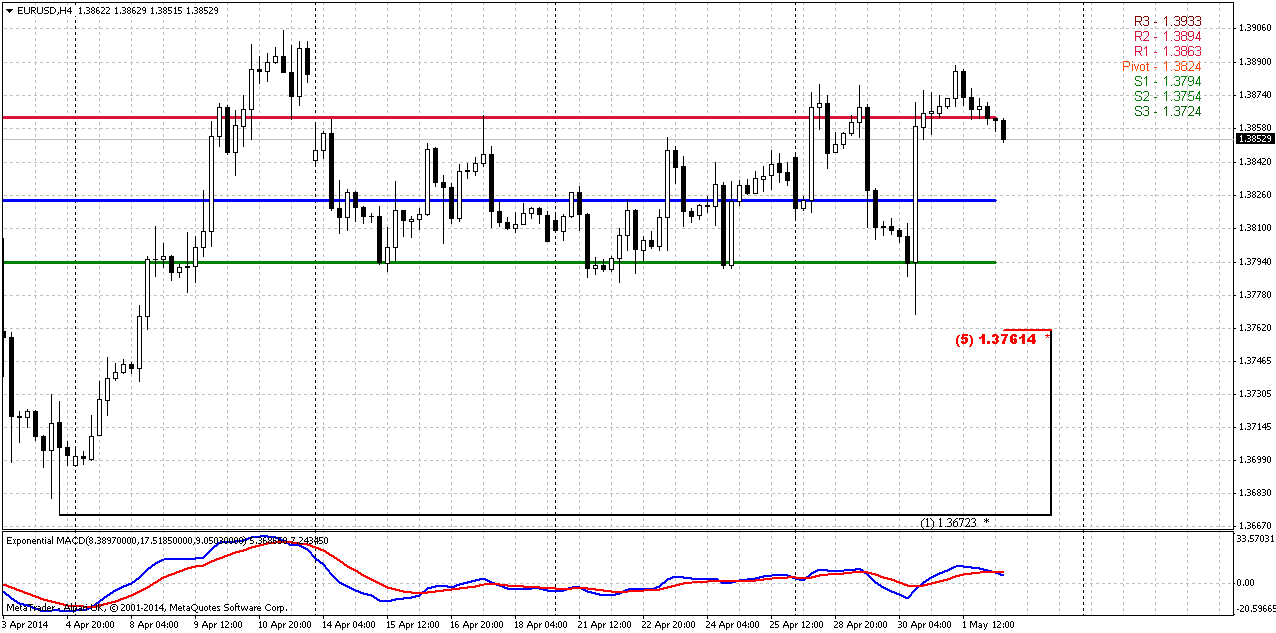
In recent 2 weeks market stands in sideways consolidation. Upper border has significant meaning – this is 50% Fib resistance, former yet unfilled gap and the invalidation point of our weekly bearish grabber. At the same time there is just 40-50 pips till this area. As market stands in a range for a long time, it is logically that pivots envelope this range by WPR1 and WPS1. WPP itself stands right in the middle of the range. As usual, the direction of breakout probably will set further action. Thus, two ways to act – trying to take short position closer to WPR1 and upper border of the range, or... do nothing, wait breakout and only after that take position on retracement.
Another moment that we have is bullish divergence with MACD. In current conditions this could be bearish dynamic pressure, since market stands flat without any hit on upward reversal yet.
Conclusion:
While price stands in 1.33-1.38 area we can’t speak either on upward or downward breakout. Market continues to coiling inside of this range and April action does not look promising yet. Although we’ve seen solid upward recovery on recent week but currently this is insufficient to speak about long-term upward continuation. Even more, this upward recovery now looks like just the last momentum of previous 6-week rally.
In short-term perspective market stands in the range for 2 weeks. This is process of energy building that will accelerate breakout in any direction. We have valid bearish patterns and even probably bearish dynamic pressure as well on intraday chart, that’s why it is better to be caution with any long position.
Let’s hope that important fundamental data of current week will force market move and clarify medium-term direction.
The technical portion of Sive's analysis owes a great deal to Joe DiNapoli's methods, and uses a number of Joe's proprietary indicators. Please note that Sive's analysis is his own view of the market and is not endorsed by Joe DiNapoli or any related companies.
Investors moved to the safety of the yen and Swiss franc on Friday, unnerved by escalating tensions between the West and Russia over Ukraine, and also took advantage of higher yielding Pacific currencies. Mixed U.S. data in recent weeks has left investors without a clear trend, which is now being trumped by the geopolitical concerns in Europe, a combination that has made placing big bets on currency movements high risk endeavors. "Neither of these two themes are dominant and if you play on one you get hit with the other, which is why today I think we are seeing a little bit of buying of Pacific currencies," said Steven Englander, global head of G10 FX strategy at CitiFX in New York. "I wouldn't say the economic news out of Asia has been good but it is far from the eye of the storm, and if you can pick up a bit of yield there, people are sitting around saying, Why not?" he added.
Next week's euro zone April flash inflation report and April U.S. employment data are the key economic events that could pull attention away from Ukraine. The dollar fell to 102.13 yen , down 0.16 percent on the day and its worst levels in a week. The greenback slid 0.04 percent to 0.8808 Swiss francs, having fallen to a one-week low of 0.8798 franc earlier in the day.
With tensions between Ukraine and Russia high, Ukrainian Special Forces launched a second phase of their operation in the east of the country on Friday, an official on the presidential staff said. The United States said it was prepared to impose further targeted sanctions on Russia over its actions in Ukraine and that European leaders had agreed to coordinate on steps to make Moscow pay.
Risk aversion has supported the yen, said Credit Agricole FX strategist Manuel Oliveri. "But geopolitical risks are not having too much of an impact on currencies, with most investors still focused on growth prospects. If risk sentiment improves, the yen will be sold off," he said.
Volumes in euro/Danish crown trades picked up for a second day, according to Reuters Matching. The euro recovered from a near three-month low against the crown of 7.4614 to trade at 7.4649 crowns. The crown strengthened after the Danish central bank surprised the market by raising the rate on certificate of deposits and ending a regime of negative interest rates in a bid to stem outflows and support the currency.
Technical
Since our previous research price has changed only for 30 pips – this is too small difference to make any impact on monthly chart. Our major concern here stands around breakout moment of 1.3830 Fib resistance and Agreement. That is also long-term downward trendline. We see that market has challenged this level twice already, but still stands below it and April action doesn’t look impressive yet here. In fact market stands in tight range since 2014. Thus, 1.33-1.3850 is an area of “indecision”. While market stands inside of it we can talk about neither upward breakout nor downward reversal. At least, reversal identification could be done with yearly pivot – if market will move below it, this could be early sign of changing sentiment. But, as you can see, nothing among this issues have happened yet. The same has happened on previous week. Only recently we’ve disccused, as it was seemed, downward bounce out from 1.3850 level. But today we see that price has returned right back up to it.
Returning to discussion of Yearly Pivot - we’ve noted that upward bounce has started precisely from 1.3475 level. Now the major question stands as follows – whether this upward action is a confirmation of long-term bullish sentiment or just a respect of YPP first touch. Following the chart we see very useful combination for us – YPP stands very close to 1.33 – our invalidation point. And if market will move below YPP this will become bearish moment by itself.
Speaking about upward continuation, market mechanics does not allow price to show any deep retracement any more. Any move of this kind should be treated as market weakness and it will increase probability of reversal down. Take a look that as market has hit minor 0.618 AB-CD extension target right at former rock hard resistance – Fib level and Agreement and former yearly PR1, it has shown reasonable bounce down to 1.33. As retracement after 0.618 target already has happened, it is unlogical and unreasonable to see another deep bounce and if it will happen - it will look suspicious.
So, speaking about monthly upside targets... If we will get finally real break through resistance, we have two major targets – AB=CD one around 1.44 and Yearly PR1 = 1.4205.
Thus, here we can make following conclusion – nothing drastical yet, market still coiling near resistance and we can continue to stick with working range for nearest perspective on monthly chart – an area between YPP=1.3475 and resistance around 1.3850. Monthly chart can’t give us direction yet and we need to find something else to trade on lower time frame charts.
Weekly
On passed week market has shown solid recovery. That’s beaing said – major question is what this recovery was? Currently I mostly gravitate to conclusion that this is some kind of momentum action, since previously market has moved up for considerable period of time and recent recovery is just an inertness - attempt to continue move up, some kind of exhausting action of former upward rally. If we would have, say, 8 weeks of upward action in a row and not just 6 weeks – we could indentify B&B “Buy” trade. We didn’t do this, but the core of this action could be the same – recent long upward candle could be not new upward trend but last part of former trend.
In fact, as we’ve seen on monthly chart, and on the weekly – if you will contract chart, we will get long-term wedge. Usually wedges are reversal or exhausting patterns, but sometimes they could be broken in unexpected direction. Anyway, any breakout usually accompanied by strong acceleration.
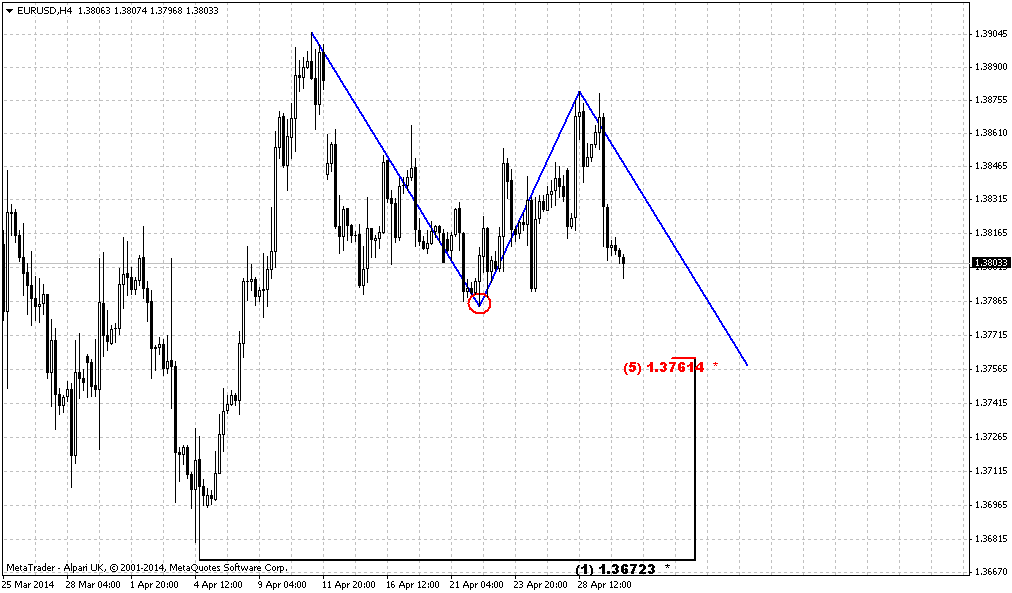
At the same time we have completed bearish butterfly pattern that suggests deeper retracement down, at least to 3/8 Fib support of whole butterfly action. This level stands at 1.35-1.3520 K-support area and Yearly Pivot. Previously we’ve made suggestion that market could show some respect and bounce up as reaction on current support area, but after that some downward continuation should follow. Major concern was about how this will happen. On previous week we have identified bearish stop grabber. It tells us that market should at least take out former lows and to form AB=CD down. Depending on how fast this move will be – may be later we will switch to 1.27 target that creates an Agreement precisely with minimum target of butterfly and weekly K-support.
On recent week market has shown minor upward action, but the range of the week was even tighter than the week before. Price was not able to take out the high of grabber and that means that it is still valid. The one moment that could be not very nice for bears is MPP – market has moved above it again, but this moment itself can’t erase grabber pattern.
EUR situation is sophisticated fundamentally as well. As we’ve noted earlier – any signs of EUR appreciation will trigger monetary easing steps from ECB. Thus, it will press on market participants and could help downward action on EUR. But let’s hope that major US economy data finally will lead current indecision situation to some result.
Thus, as we have bearish pattern on weekly accompanied by divergence – our direction is down, until market either will not complete it or grabber will fail.
Daily
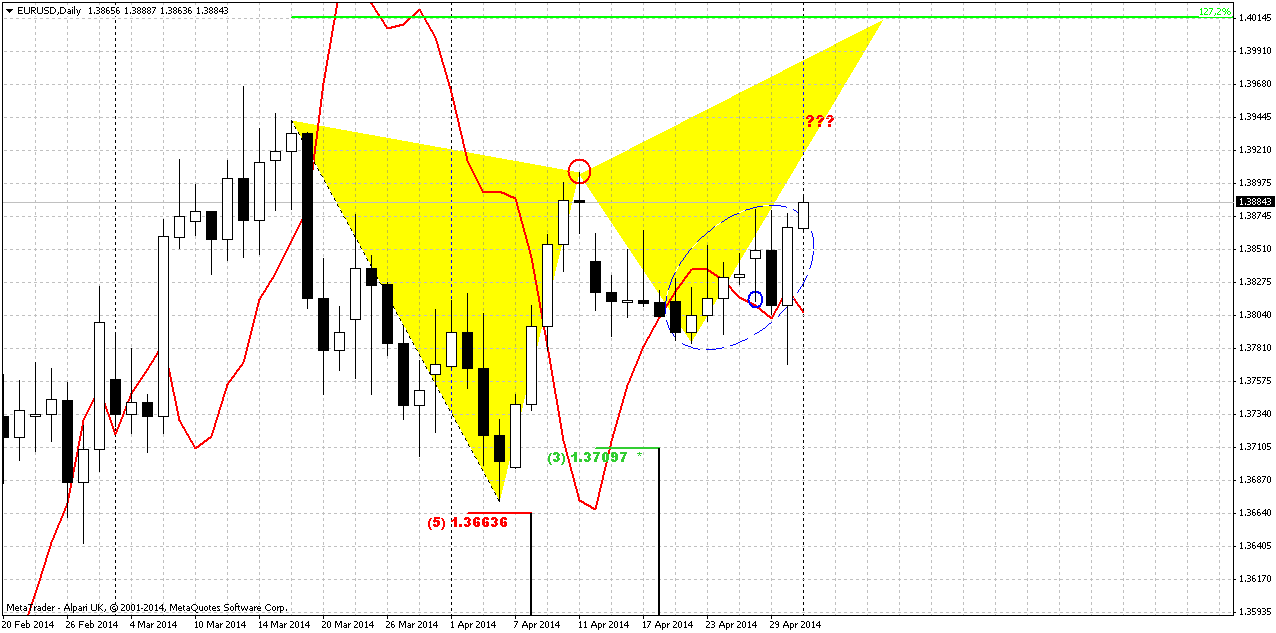
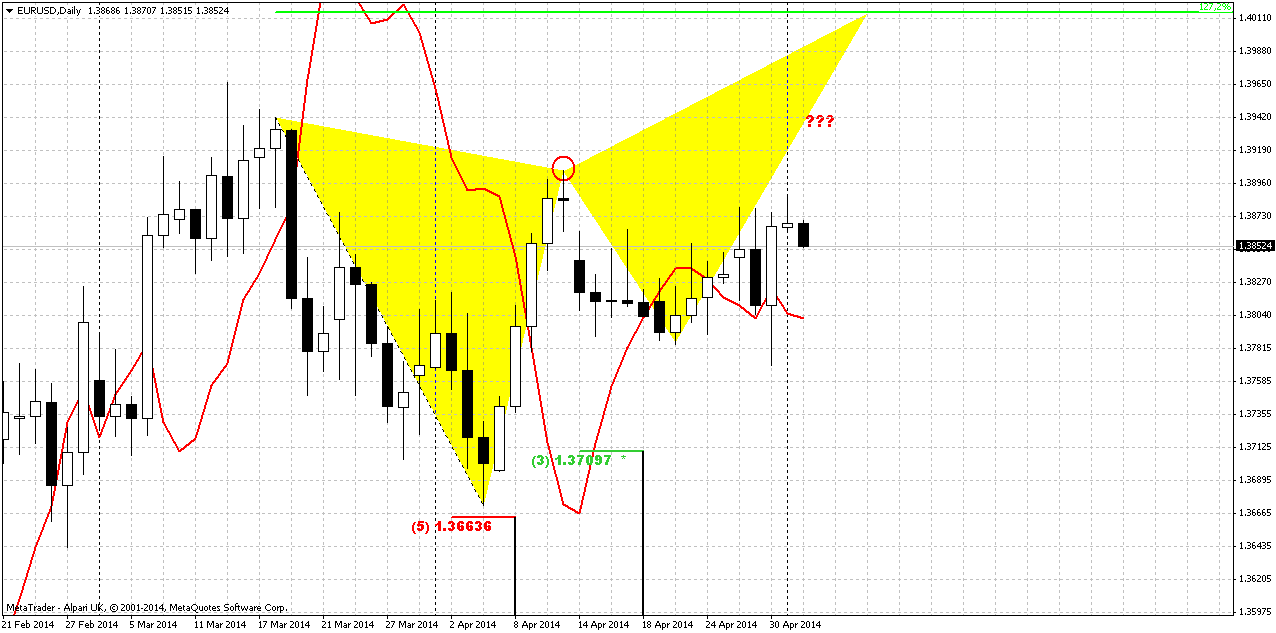
Here guys, I still can’t find solution for the riddle. Recent move up what was it? Does it mean something or we should just ignore it. Why this upward action has happened at all? At first glance this could be insignificant, but this recent small action could become a clue. Why? It does not match overall picture of patterns on weekly/daily setup. I can’t build it in harmonic and logical picture of weekly and daily price behavior. Take a look by yourself. Everything looks good till recent week – we have weekly butterfly that has triggered retracement down. When first leg down has been completed, market by reasonable rest of momentum has shown upward recovery. This recovery has completed by again reasonable bearish grabber that suggests appearing of second leg of retracement down.
And now take a look what has happened – right in the beginning of this leg down market takes some unclear pause, moves above MPP. In fact, market stands flat for 2 weeks around MPP. Even more – we can see small bullish dynamic pressure on daily, when price moves against MACD direction and in general this behavior stay out of overall situation, does not match it. What we should to do with this? May be use this move up as a chance for short entry, because we still have bearish patterns on weekly chart? Or vice versa – stay aside and wait?
My thought is as follows. Despite how curious and unsupportive this action stands in relation to bearish direction – I do not want to take long position, because one way or another but we still have bearish valid patterns on weekly chart. That’s why conservative tactics will be – do nothing and wait for more clarity and signals. If bearish patterns will be destroyed – that will be another tune.
Second way is for those who ready to take small risk and take short position. This tactics is aggressive and mostly based on idea of small potential loss, but not on hard rock reliable and flawless setup. Since market has come very close to invalidation point of weekly grabber – this will give us chance to take short position very close to invalidation point. This significantly reduces risk and increases attractiveness of risk/reward ratio. Because if market still will turn down and we currently do not have 100% reasons to exclude this scenario – this will be very fast move down, I suppose. May be all this strategy smells like “pain or gain” and gambling, but actually we do not have much choice around EUR right now. That’s why I’ve said – that this is not for everybody. Choice you will have to make by yourself, as usual.
4-hour
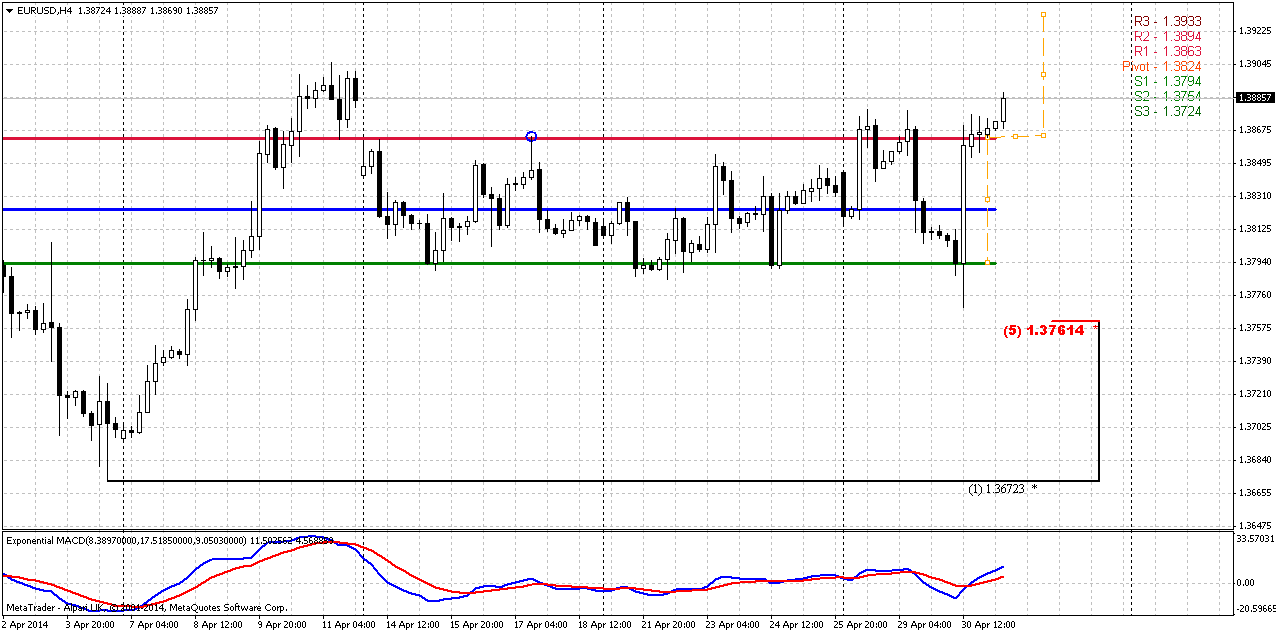
In recent 2 weeks market stands in sideways consolidation. Upper border has significant meaning – this is 50% Fib resistance, former yet unfilled gap and the invalidation point of our weekly bearish grabber. At the same time there is just 40-50 pips till this area. As market stands in a range for a long time, it is logically that pivots envelope this range by WPR1 and WPS1. WPP itself stands right in the middle of the range. As usual, the direction of breakout probably will set further action. Thus, two ways to act – trying to take short position closer to WPR1 and upper border of the range, or... do nothing, wait breakout and only after that take position on retracement.
Another moment that we have is bullish divergence with MACD. In current conditions this could be bearish dynamic pressure, since market stands flat without any hit on upward reversal yet.
Conclusion:
While price stands in 1.33-1.38 area we can’t speak either on upward or downward breakout. Market continues to coiling inside of this range and April action does not look promising yet. Although we’ve seen solid upward recovery on recent week but currently this is insufficient to speak about long-term upward continuation. Even more, this upward recovery now looks like just the last momentum of previous 6-week rally.
In short-term perspective market stands in the range for 2 weeks. This is process of energy building that will accelerate breakout in any direction. We have valid bearish patterns and even probably bearish dynamic pressure as well on intraday chart, that’s why it is better to be caution with any long position.
Let’s hope that important fundamental data of current week will force market move and clarify medium-term direction.
The technical portion of Sive's analysis owes a great deal to Joe DiNapoli's methods, and uses a number of Joe's proprietary indicators. Please note that Sive's analysis is his own view of the market and is not endorsed by Joe DiNapoli or any related companies.
")


