Sive Morten
Special Consultant to the FPA
- Messages
- 18,699
Monthly
The U.S. dollar hit a one-week low against a basket of major currencies on Friday after escalating geopolitical tensions led traders to take profits on the greenback after its recent strength. The United States launched its first air strike against Iraq since American troops withdrew from the country in 2011. Fighting has also resumed in Gaza between Palestinian militants and Israel, while the conflict between Russia and Ukraine remained on investors' radar.
The concerns drove traders to book profits on bullish positions in the dollar, while the euro gained after traders took profits on short bets against the shared currency, analysts said.
The profit-taking came after the U.S. dollar index, which measures the greenback against a basket of six major currencies, notched its biggest monthly gain in nearly 1-1/2 years in July.
"Geopolitical issues in different parts of the world are going much further than anyone expected," said Steven Englander, global head of G10 foreign exchange strategy at Citi FX in New York.
President Obama authorized air strikes on Iraq after tens of thousands of Christians fled Islamic State fighters who have crucified and beheaded captives. The dollar held losses despite a report that Russia's defense ministry said Friday it had finished military exercises it was conducting near the border with Ukraine.
The benchmark 10-year U.S. Treasury note was last up 1/32 in price to yield 2.42 percent after hitting 2.35 percent, its lowest in 14 months.
Analysts said the dollar's losses would likely prove brief.
"These events cause risk aversion initially, but within a day or so, the market has moved on," said Richard Franulovich, senior currency strategist at Westpac Banking Corp. in New York, in reference to the events fuelling the day's geopolitical worries. He said next Wednesday's U.S. retail sales data for July would be closely watched given the importance of consumer spending on gross domestic product growth. Economists polled by Reuters expect a 0.3 percent gain, up from a 0.2 percent rise in June.
Technical
Today, guys, we again turn to JPY. Situation there has changed since our previous discussion and moved forward in agreement with our analysis of monthly chart. Our medium-term EUR analysis stands the same. Due Friday’s rally market has become one step closer to DRPO “Buy” on daily chart. But right now is JPY. Here is the core of our previous discussion that is still valid and important:
Let’s take a look at wide JPY chart first. Here is some very tricky moment hidden and if you careful enough you could find him. First of all, we see that 101.50 area is long-term natural support/resistance line. Sometimes market has pierced it significantly but this line holds. Now we also see that on previous touch market has pierced it as well, but has not broken it. Now price stands slightly higher than the line that I’ve drawn, but still lower than previous high. It means that market has not passed through this resistance yet, although at first glance it seems the opposite is true. Now I would ask you – what do you expect to happen when you have natural resistance line and slightly higher solid Fib resistance level? Will chances on true breakout of resistance be greater or smaller? Market could loss a lot of momentum on struggle against natural level and then it will meet Fib resistance. This situation starts to smell as possible W&R or even failure breakout. That’s why it’s very interesting. Anything could happen of cause, but if price will swamp and form some reversal pattern in 101.50-105.5 area this could trigger solid retracement down. That is our primary object to monitor – identifying and catching reversal pattern in this area.
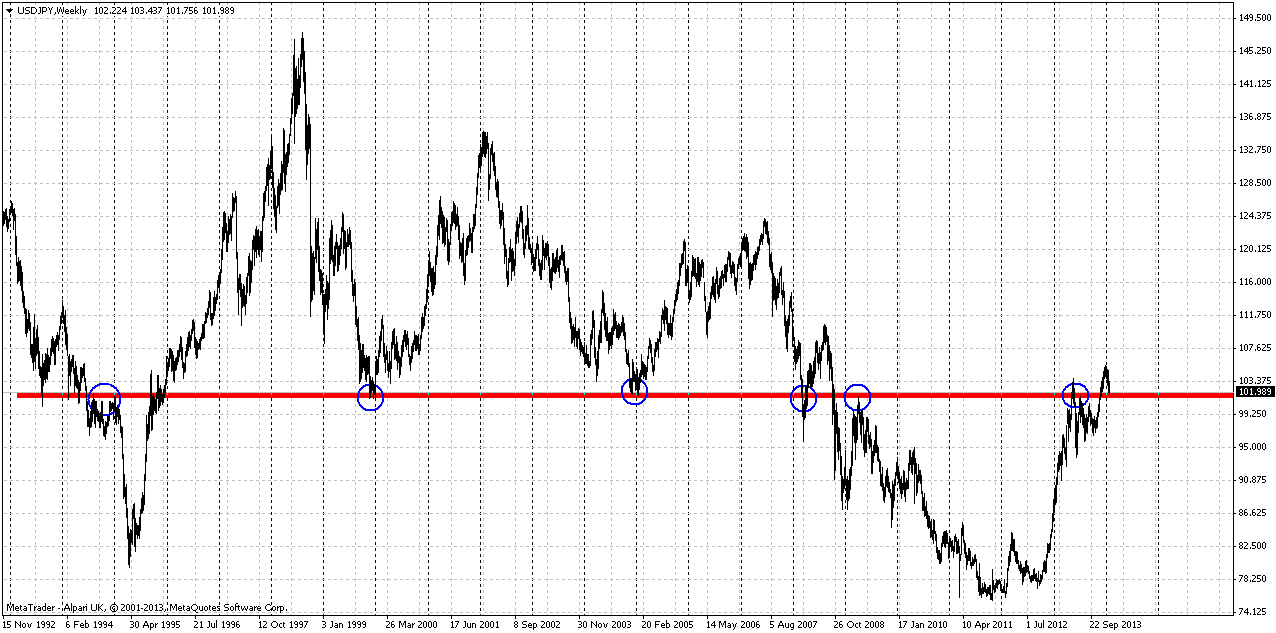
In previous research (on March 9th 2014) we noted that despite appearing of bearish engulfing pattern we see two possible risk factors here. First is that market has not quite reached Fib resistance, approximately for 30 pips. Second is now market has reached this 101.50 long-term level from upside and this could be just re-testing of broken level. Other words risk stands in possibility of upward continuation after re-testing of broken area. We should keep in mind these moments later, to create trading plan for next week.
On second monthly chart you can see modern picture of JPY.
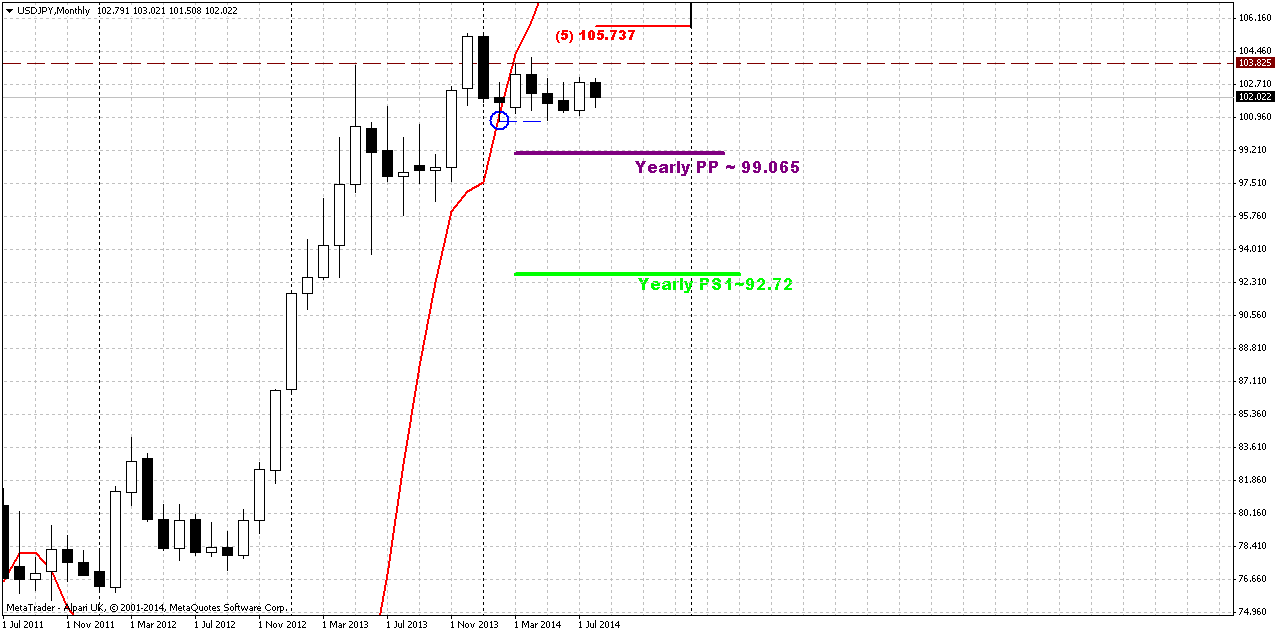
Situation here is very interesting. Take a look at blue circle. This is bullish stop grabber that has been formed in February! But its low has not been taken out and this grabber is still valid. Yes, here we probably could argue and appeal to “3-period Rule” that tells – if market has not started action according to pattern within 3 period – better is to close position. Also we can see that Yen has not tested YPP and this is also bearish moment. Still both of these moments are not direct, but grabber pattern that is still valid is a direct one.
So, let’s investigate what we have on lower time frames and try to gather single picture.
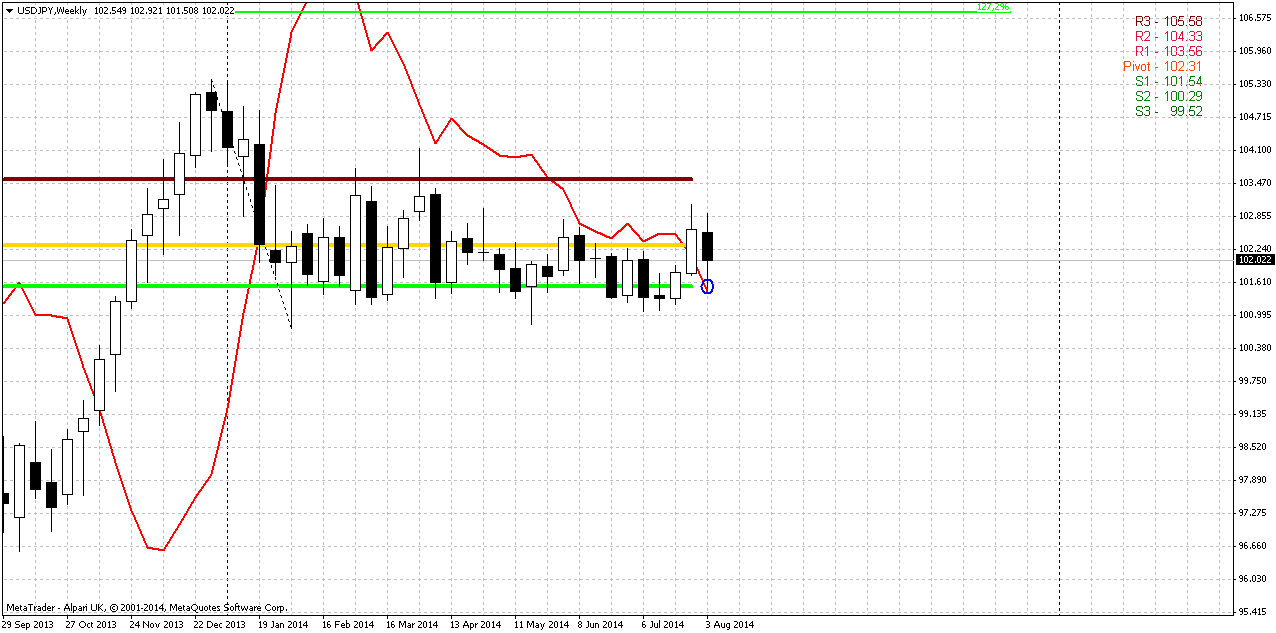
Weekly
Second important issue stands on weekly chart. Since market stands in a tight range for a long period already – monthly pivots stand very tight to price action. What do we see since the beginning of the year? Trend has turned bearish, but market stands flat and trend shifting is not confirmed by price action. Market even forms higher lows. This is a sigh of bullish dynamic pressure. Our long-term 101.50 support level also can impact on price action, but it should not lead to appearing of higher lows. That’s why here is something more than just simple support, probably.
On first week of the August market has shifted trend bullish and challenged MPP. Now price has bounced to MPS1, but kept the trend. Unfortunately we do not have bullish grabber in blue circle, at least due Alpari UK quotes data. It could help us much, but even these moments should be enough to get nuances of current situation. It seems that JPY has more bullish under cover signs that it seems at first glance.
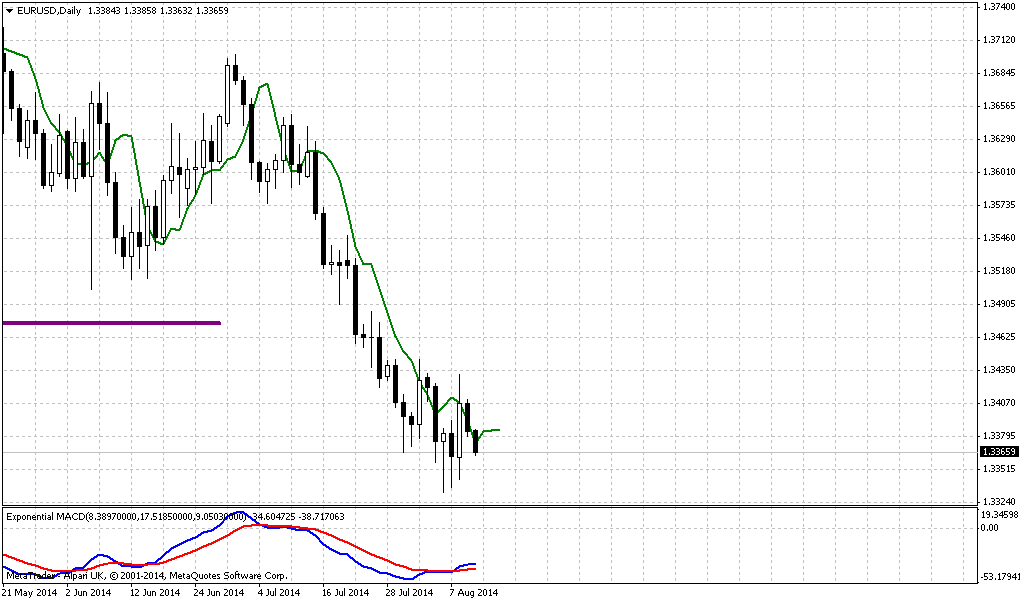
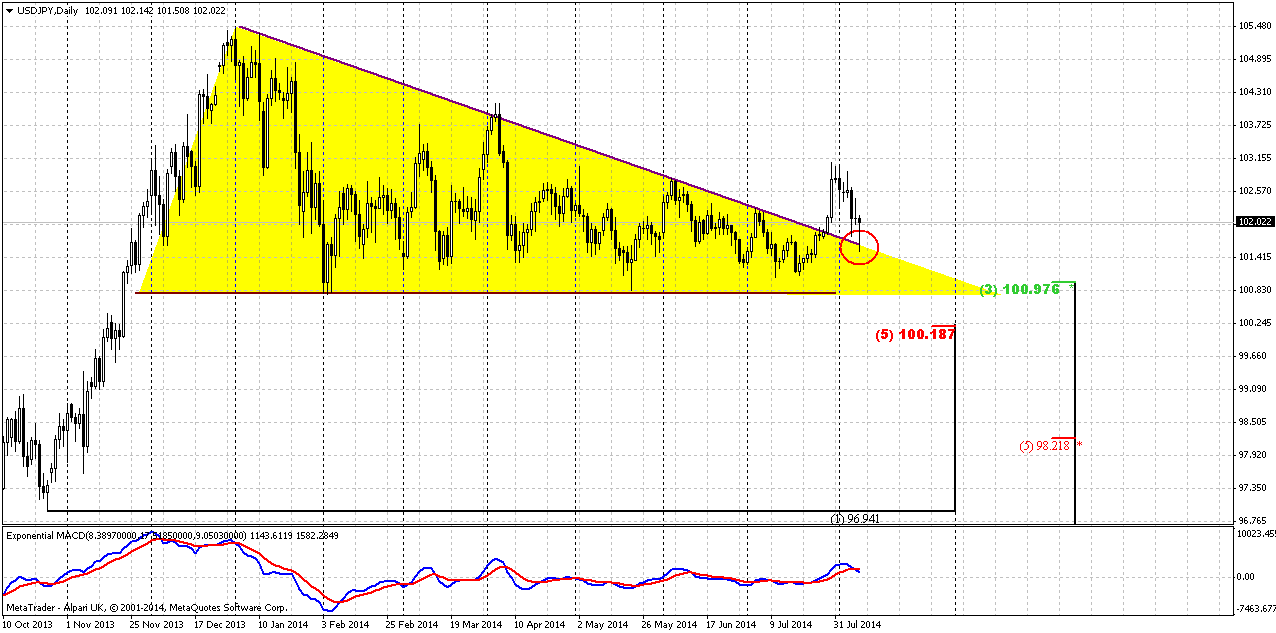
Daily
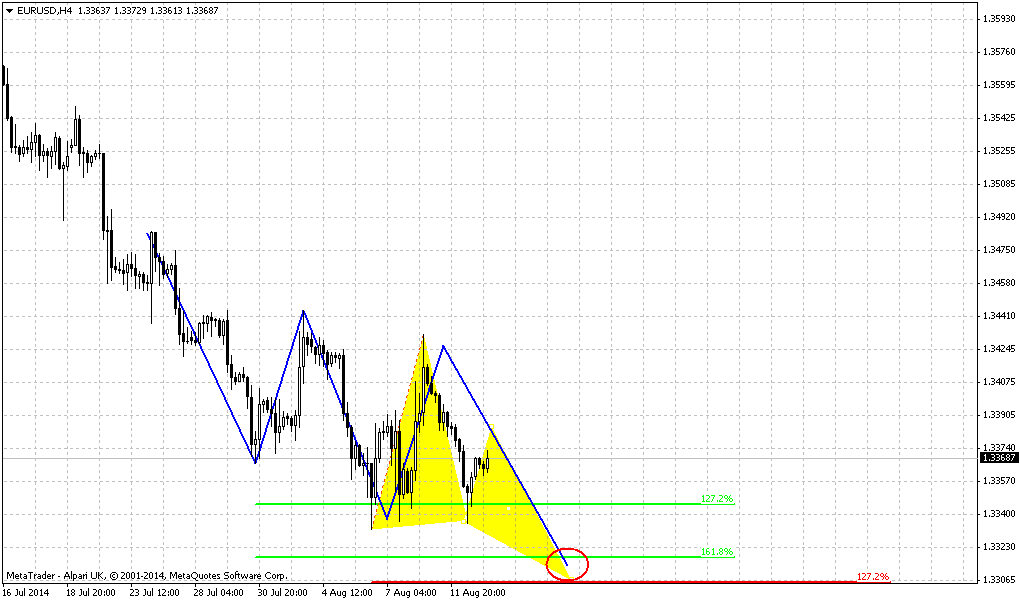
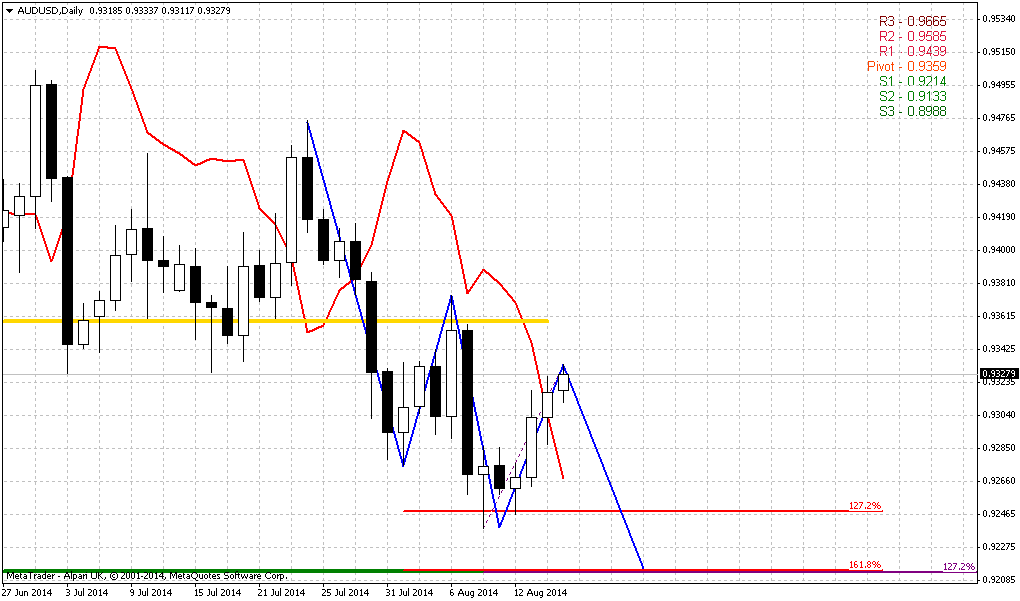
On daily time frame trend is bearish, but this is not as important as when market stands in thrusting action. The major game on daily chart will be around this triangle, guys. Inside triangle, you probably, could find one, two or even three potential butterflies, but they are not as important right now as triangle itself. The lower border of triangle coincides with K-support area. And on passed week market has shown upward breakout of the pattern, on Friday it has re-tested broken border. Thus, situation becomes simpler for us – market should not return inside triangle’s body. To prove its intention to move higher market should stay above broken line. That is what we will monitor on coming week.
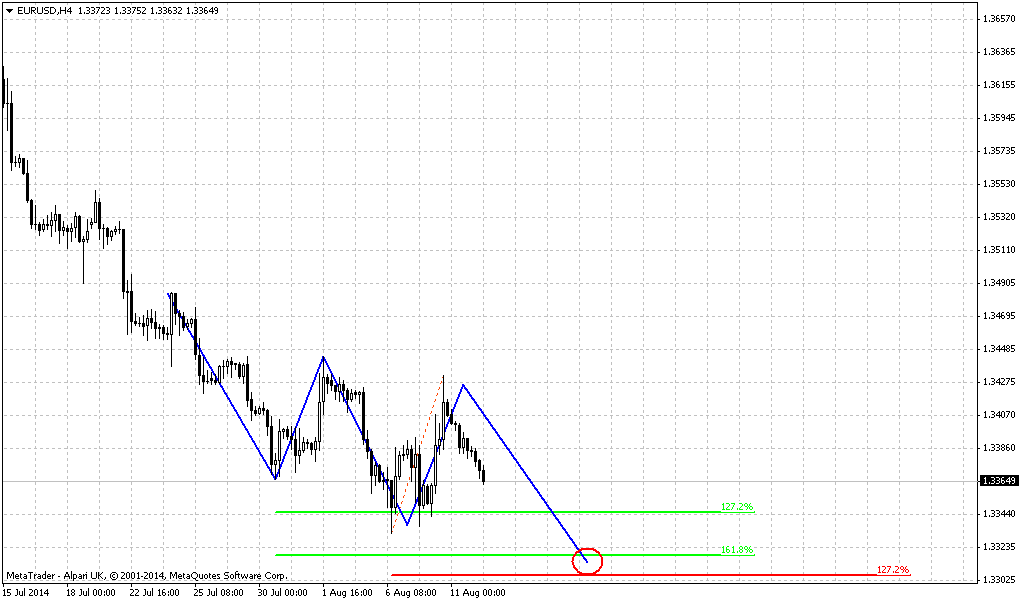
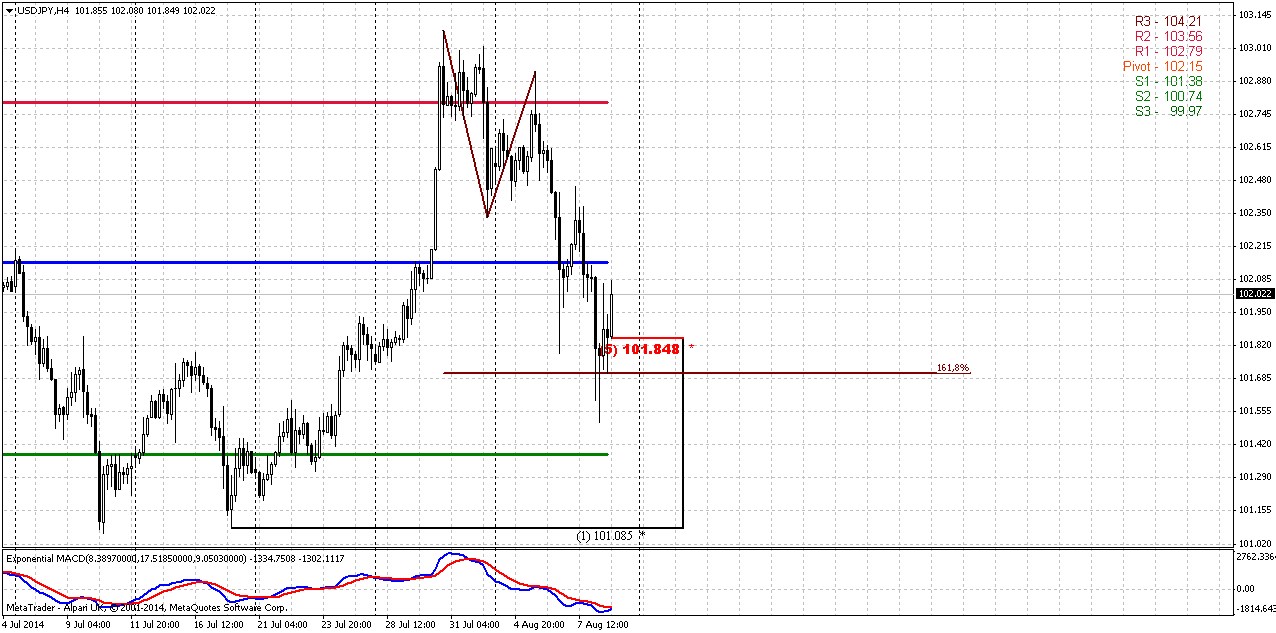
4-hour
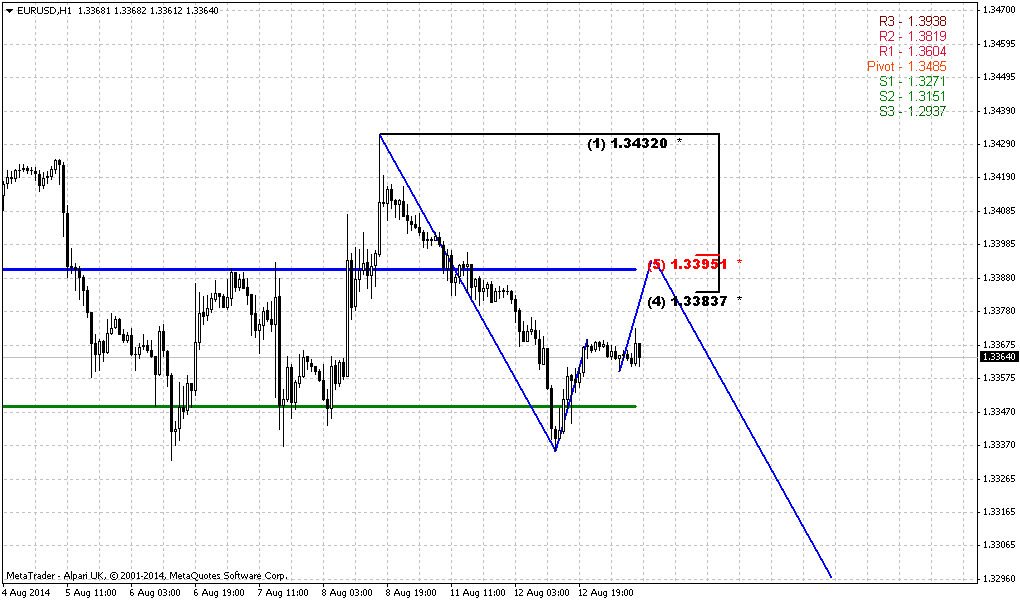
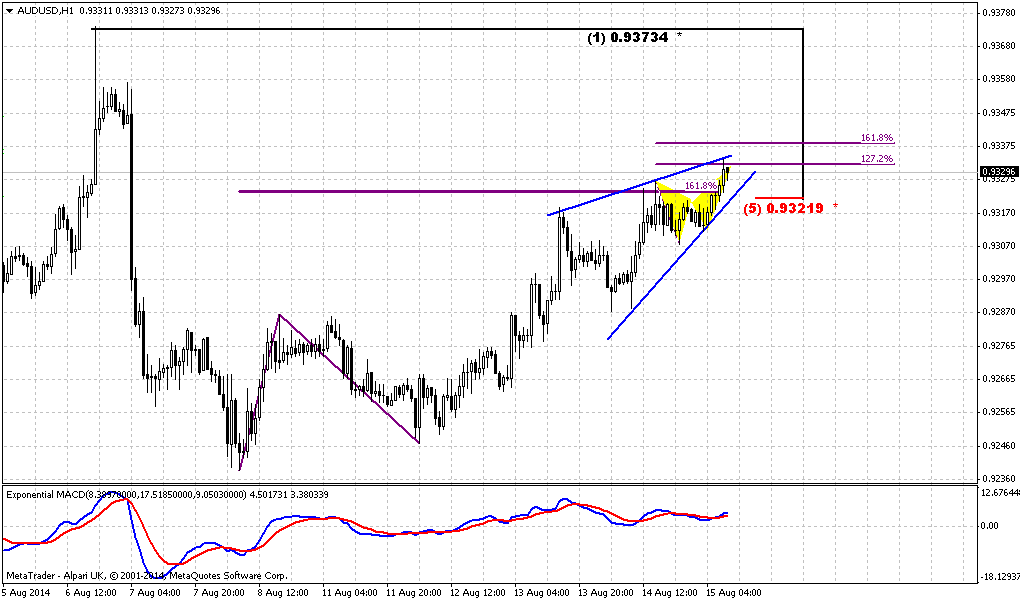
This time just shows that market has reached Agreement support during retracement down to daily trend line. Price has completed 1.618 AB=CD pattern right at 5/8 Fib support. Currently market stands at crucial point for short-term perspective. If market will fail here and turn down again – this will mean that upward breakout is at least postponed (or even cancelled), while turning up will confirm our suggestion about possible upward continuation of long-term trend.
Conclusion:
Our former suggestion points on possible another leg up to 106-106.30 area. After creating of bullish grabber that is still valid, market makes more and more visible presence of bullish dynamic pressure on weekly chart. On lower time frames breakout of long-term triangle supports this analysis, but this is just first issue that could be unstable and need to be checked better.
Following to logical action market should continue move up, if it is really bullish and has intention to continue long-term trend. Because all other preliminary steps have been done already – breakout and retracement after it already has happened.
If market will not follow up, fail and turn down again – it will mean that upward continuation is postponed. That’s being said, although may be we haven’t got clear patterns yet to take positions, but we stand very close to moment when market will clarify direction probably.
The technical portion of Sive's analysis owes a great deal to Joe DiNapoli's methods, and uses a number of Joe's proprietary indicators. Please note that Sive's analysis is his own view of the market and is not endorsed by Joe DiNapoli or any related companies.
The U.S. dollar hit a one-week low against a basket of major currencies on Friday after escalating geopolitical tensions led traders to take profits on the greenback after its recent strength. The United States launched its first air strike against Iraq since American troops withdrew from the country in 2011. Fighting has also resumed in Gaza between Palestinian militants and Israel, while the conflict between Russia and Ukraine remained on investors' radar.
The concerns drove traders to book profits on bullish positions in the dollar, while the euro gained after traders took profits on short bets against the shared currency, analysts said.
The profit-taking came after the U.S. dollar index, which measures the greenback against a basket of six major currencies, notched its biggest monthly gain in nearly 1-1/2 years in July.
"Geopolitical issues in different parts of the world are going much further than anyone expected," said Steven Englander, global head of G10 foreign exchange strategy at Citi FX in New York.
President Obama authorized air strikes on Iraq after tens of thousands of Christians fled Islamic State fighters who have crucified and beheaded captives. The dollar held losses despite a report that Russia's defense ministry said Friday it had finished military exercises it was conducting near the border with Ukraine.
The benchmark 10-year U.S. Treasury note was last up 1/32 in price to yield 2.42 percent after hitting 2.35 percent, its lowest in 14 months.
Analysts said the dollar's losses would likely prove brief.
"These events cause risk aversion initially, but within a day or so, the market has moved on," said Richard Franulovich, senior currency strategist at Westpac Banking Corp. in New York, in reference to the events fuelling the day's geopolitical worries. He said next Wednesday's U.S. retail sales data for July would be closely watched given the importance of consumer spending on gross domestic product growth. Economists polled by Reuters expect a 0.3 percent gain, up from a 0.2 percent rise in June.
Technical
Today, guys, we again turn to JPY. Situation there has changed since our previous discussion and moved forward in agreement with our analysis of monthly chart. Our medium-term EUR analysis stands the same. Due Friday’s rally market has become one step closer to DRPO “Buy” on daily chart. But right now is JPY. Here is the core of our previous discussion that is still valid and important:
Let’s take a look at wide JPY chart first. Here is some very tricky moment hidden and if you careful enough you could find him. First of all, we see that 101.50 area is long-term natural support/resistance line. Sometimes market has pierced it significantly but this line holds. Now we also see that on previous touch market has pierced it as well, but has not broken it. Now price stands slightly higher than the line that I’ve drawn, but still lower than previous high. It means that market has not passed through this resistance yet, although at first glance it seems the opposite is true. Now I would ask you – what do you expect to happen when you have natural resistance line and slightly higher solid Fib resistance level? Will chances on true breakout of resistance be greater or smaller? Market could loss a lot of momentum on struggle against natural level and then it will meet Fib resistance. This situation starts to smell as possible W&R or even failure breakout. That’s why it’s very interesting. Anything could happen of cause, but if price will swamp and form some reversal pattern in 101.50-105.5 area this could trigger solid retracement down. That is our primary object to monitor – identifying and catching reversal pattern in this area.
In previous research (on March 9th 2014) we noted that despite appearing of bearish engulfing pattern we see two possible risk factors here. First is that market has not quite reached Fib resistance, approximately for 30 pips. Second is now market has reached this 101.50 long-term level from upside and this could be just re-testing of broken level. Other words risk stands in possibility of upward continuation after re-testing of broken area. We should keep in mind these moments later, to create trading plan for next week.
On second monthly chart you can see modern picture of JPY.
Situation here is very interesting. Take a look at blue circle. This is bullish stop grabber that has been formed in February! But its low has not been taken out and this grabber is still valid. Yes, here we probably could argue and appeal to “3-period Rule” that tells – if market has not started action according to pattern within 3 period – better is to close position. Also we can see that Yen has not tested YPP and this is also bearish moment. Still both of these moments are not direct, but grabber pattern that is still valid is a direct one.
So, let’s investigate what we have on lower time frames and try to gather single picture.
Weekly
Second important issue stands on weekly chart. Since market stands in a tight range for a long period already – monthly pivots stand very tight to price action. What do we see since the beginning of the year? Trend has turned bearish, but market stands flat and trend shifting is not confirmed by price action. Market even forms higher lows. This is a sigh of bullish dynamic pressure. Our long-term 101.50 support level also can impact on price action, but it should not lead to appearing of higher lows. That’s why here is something more than just simple support, probably.
On first week of the August market has shifted trend bullish and challenged MPP. Now price has bounced to MPS1, but kept the trend. Unfortunately we do not have bullish grabber in blue circle, at least due Alpari UK quotes data. It could help us much, but even these moments should be enough to get nuances of current situation. It seems that JPY has more bullish under cover signs that it seems at first glance.
Daily
On daily time frame trend is bearish, but this is not as important as when market stands in thrusting action. The major game on daily chart will be around this triangle, guys. Inside triangle, you probably, could find one, two or even three potential butterflies, but they are not as important right now as triangle itself. The lower border of triangle coincides with K-support area. And on passed week market has shown upward breakout of the pattern, on Friday it has re-tested broken border. Thus, situation becomes simpler for us – market should not return inside triangle’s body. To prove its intention to move higher market should stay above broken line. That is what we will monitor on coming week.
4-hour
This time just shows that market has reached Agreement support during retracement down to daily trend line. Price has completed 1.618 AB=CD pattern right at 5/8 Fib support. Currently market stands at crucial point for short-term perspective. If market will fail here and turn down again – this will mean that upward breakout is at least postponed (or even cancelled), while turning up will confirm our suggestion about possible upward continuation of long-term trend.
Conclusion:
Our former suggestion points on possible another leg up to 106-106.30 area. After creating of bullish grabber that is still valid, market makes more and more visible presence of bullish dynamic pressure on weekly chart. On lower time frames breakout of long-term triangle supports this analysis, but this is just first issue that could be unstable and need to be checked better.
Following to logical action market should continue move up, if it is really bullish and has intention to continue long-term trend. Because all other preliminary steps have been done already – breakout and retracement after it already has happened.
If market will not follow up, fail and turn down again – it will mean that upward continuation is postponed. That’s being said, although may be we haven’t got clear patterns yet to take positions, but we stand very close to moment when market will clarify direction probably.
The technical portion of Sive's analysis owes a great deal to Joe DiNapoli's methods, and uses a number of Joe's proprietary indicators. Please note that Sive's analysis is his own view of the market and is not endorsed by Joe DiNapoli or any related companies.