Sive Morten
Special Consultant to the FPA
- Messages
- 18,695
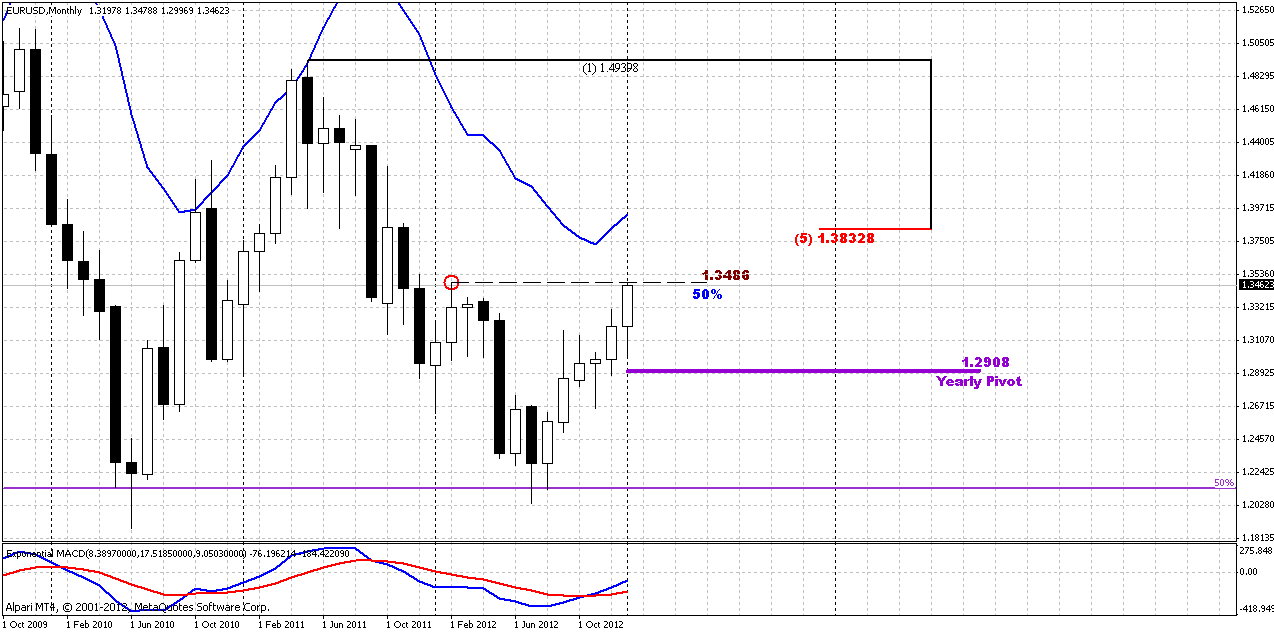
Monthly
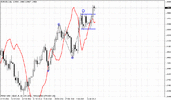
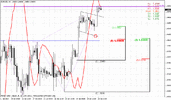
Trend holds bullish, next major resistance level is 1.3834 and monthly overbought. At the same time, as it was noted on previous week, we have to pay attention to 1.3486 level. This level is significant by two reasons. It coincides with 50% resistance and second - this level is a kind of quality test for current upward move, since this is a high of most recent swing down. We know that when market forms swing up that is greater than previous swing down – this might be an indication of reversal. Particularly by that mean – 1.3486 is significant, and market will open right around it on next week.
Taking a look at very big picture, current upward move could become just another bounce from all time 50% support at 1.21 area. The first test and bounce from this area has taken place in summer of 2010, as you can see on the chart. In very long-term perspective it could mean that market is challenging 1.21 area. So it could bounce ones, twice, but bounces should start to fade and sooner or later this level could be broken.
So, major idea of monthly chart – we have bullish sentiment. If market will pass through 1.35 area – next resistance and target is 1.3830.
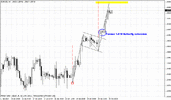
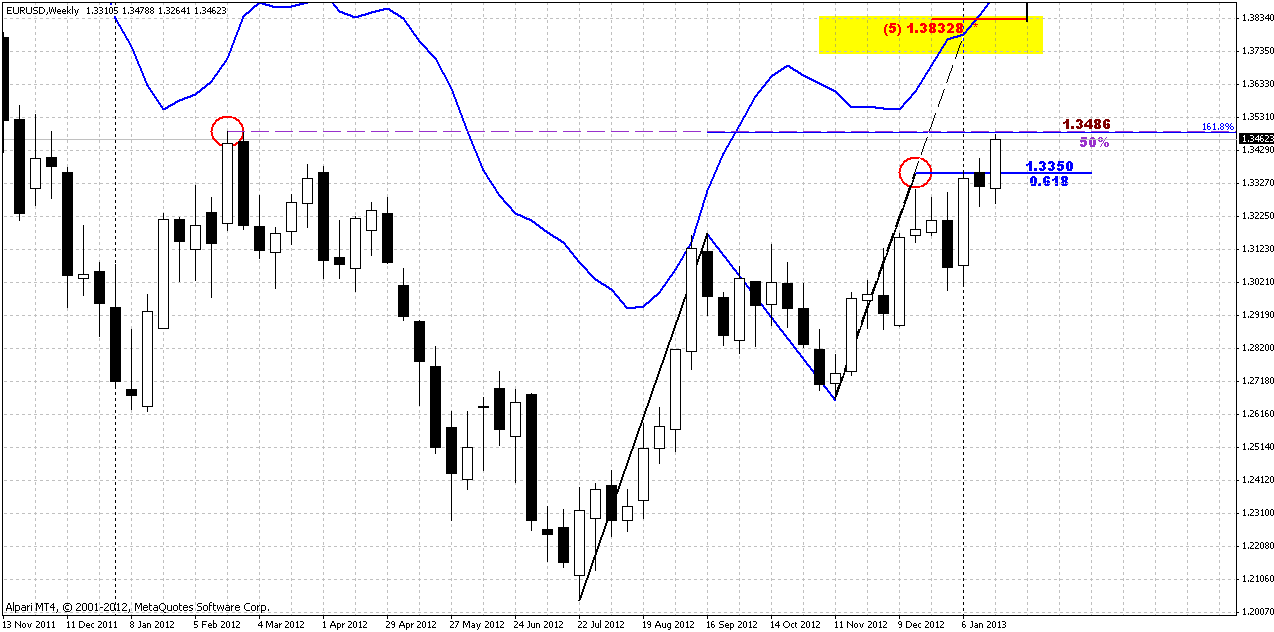
Weekly
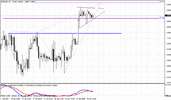
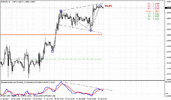
Trend holds bullish here, as well as price action. Market stands above MPR1, so I do not have pivots on this chart. Price has accomplished our first condition that we’ve announced on previous research – “since market has hit 0.618 extension – any retracement will be OK, if it will be tight”. That has happened – market has flirted a bit with this level by tight rectangle consolidation and yesterday, finally, we’ve got upward continuation. Still, here we stand in a bit tricky situation. Since market already has passed above 0.618, then it’s logical next destination is 1.0 extension at 1.3780 area – in Agreement with major 5/8 resistance at 1.3830. There is no overbought and Fib levels ahead. From another point of view – we stand at natural 1.3486 resistance, that is also 50% level, as we’ve noted above, and, take a look – 1.618 extension of BC leg. Rather solid barrier, isn’t it? Usually you never know how market will deal with it, because from the Fib work standpoint – they are minor levels. Market very rare retraces from 1.618 extension of BC leg of AB=CD patterns. So, market could pass them as they not exist or some retracement could happen. That’s why it is always better to have some patterns on lower time frames that could give you more accurate information on how to deal with it, where to place stop and where to enter.
Another unpleasant moment with this AB=CD is slow CD leg.
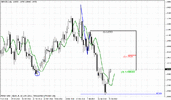
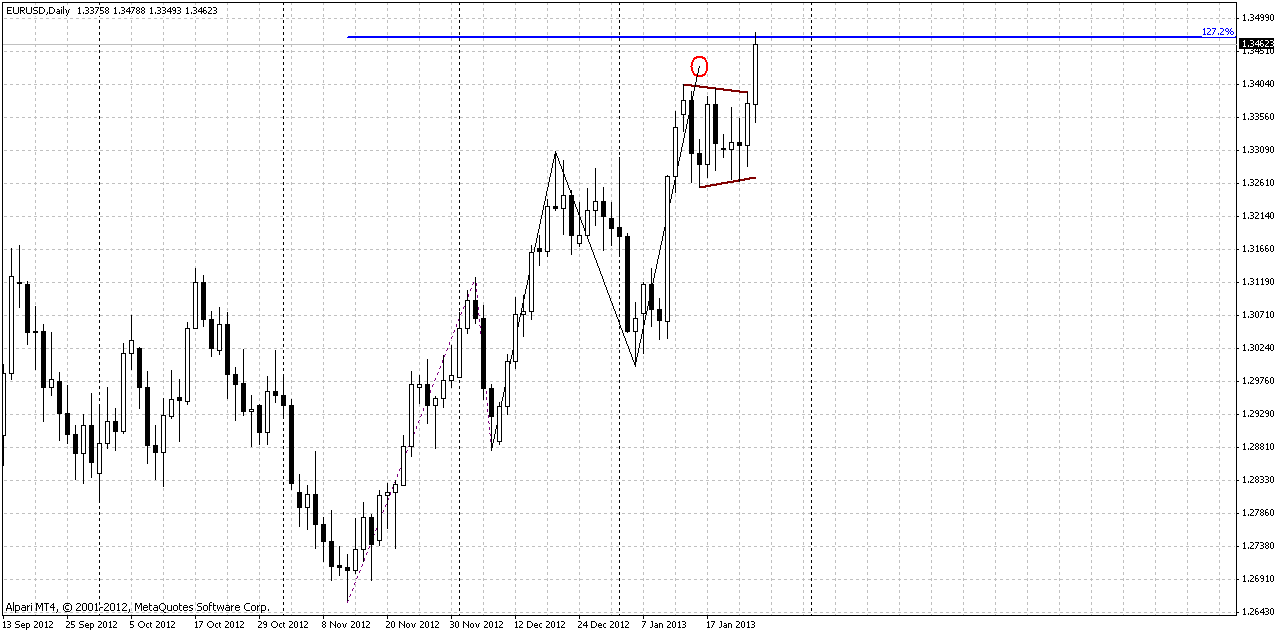
Daily
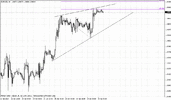
Daily time frame does not give us more clarification, it just confirms that we at resistance. Trend is bullish here, market is not at overbought. Current level is recent AB=CD target and 1.27 extension of previous AB=CD as well. So, probably it will better to take a look at lower time frames…
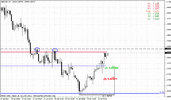
4-hour
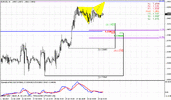
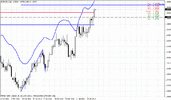
I think that 4-hour chart is our major picture for beginning of the week. First, is because we have a pattern here. That is bearish butterfly. Price has passed above its 1.27 extension, so it’s very probable that resistance should appear around 1.618 – 1.3495 area. Butterfly will be treated as worked pattern, if market will show even 3/8 retracement from its completion point. We, in turn, also do not want to get deep retracement, and weekly pivots will become our major assitance. Take a look that nearest 3/8 support coincides with WPP, while WPS1 stands between 1.3310-1.3346 area. We know that when market stands in a bull trend – WPS1 should hold possible retracement. Hence, even move to WPS1 will not mean that bullish trend is over (if it will not lead to H&S pattern, for example). Still, I prefer tight retracement to get confidence with bullish strength, I mean pullback only to WPP, because deeper move, for example to WPS1 will keep door open for appearing of bearish patterns and make right decision will be more difficult.
Anyway, major conclusion here is to not enter long right now, wait a pullback. Perfectly, if it will happen only to WPP. To take short position at butterfly sell or not – that choice is up to you.
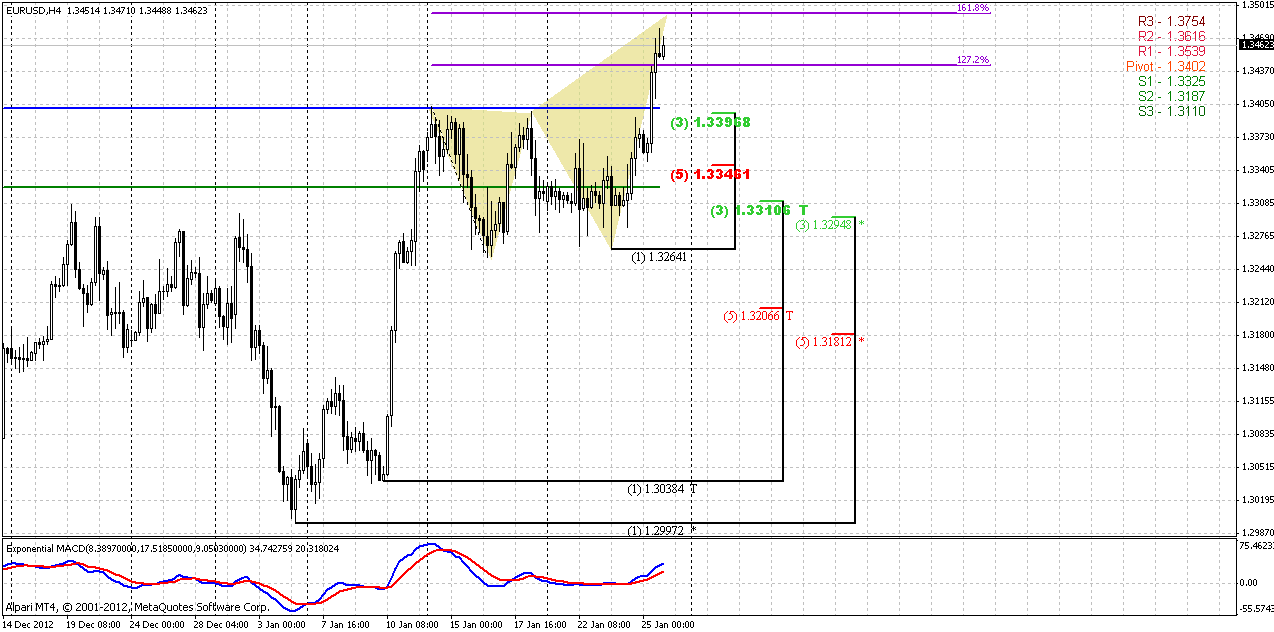
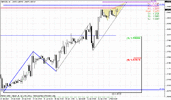
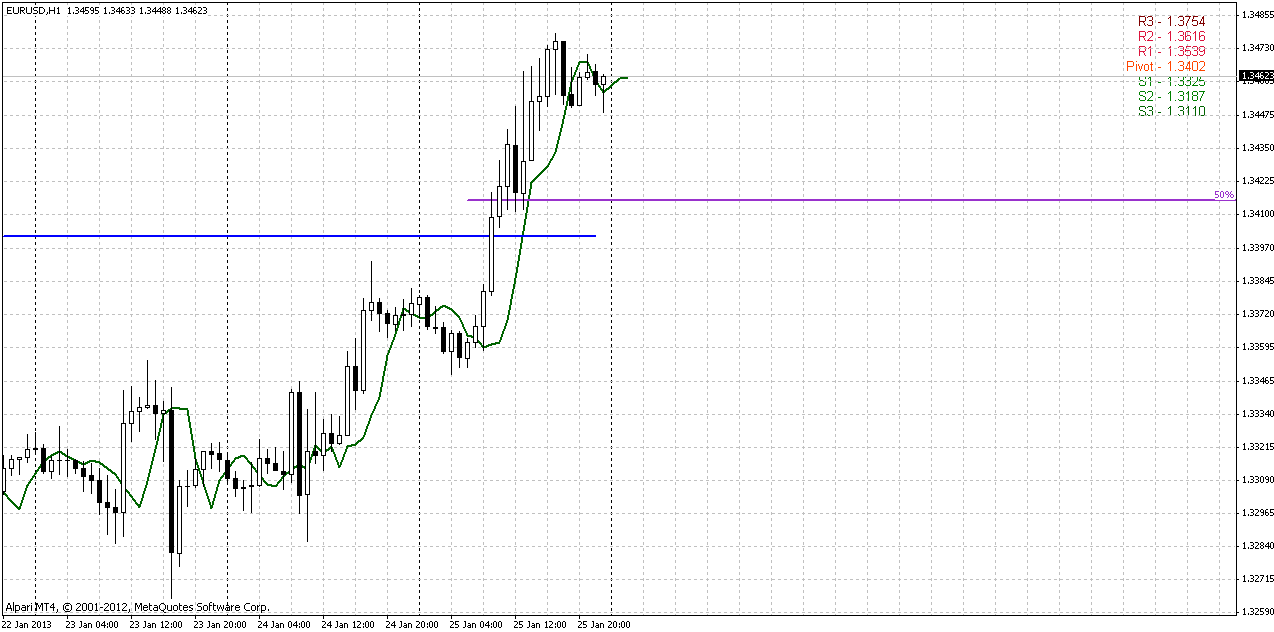
1-hour
This chart could be useful mostly for those of you who intends take short position on butterfly pattern. Here context is forming for possible DRPO “Sell” pattern. Market could form higher second top of DRPO and complete butterfly 1.618 target and turn to retracement. Minimum target of DRPO is 50% support of its thrust – stands near WPP.
Conclusion:
In a big picture bias holds bullish. Price now stands near the level that probably not as important from technical point of view as from sentiment analysis. Next major long-term target is 1.3830 area.
In a shorter term perspective, price stands at resistance and could show downward retracement. Preferably is, if it will stop at WPP. Those of you, who intends to take scalp short position on 4-hour Butterfly Sell, probably should keep an eye on hourly DRPO pattern that could trigger the retracement down.
P.S. Personally, I like more GBP daily chart for trading in the beginning of the week...
The technical portion of Sive's analysis owes a great deal to Joe DiNapoli's methods, and uses a number of Joe's proprietary indicators. Please note that Sive's analysis is his own view of the market and is not endorsed by Joe DiNapoli or any related companies.
Trend holds bullish, next major resistance level is 1.3834 and monthly overbought. At the same time, as it was noted on previous week, we have to pay attention to 1.3486 level. This level is significant by two reasons. It coincides with 50% resistance and second - this level is a kind of quality test for current upward move, since this is a high of most recent swing down. We know that when market forms swing up that is greater than previous swing down – this might be an indication of reversal. Particularly by that mean – 1.3486 is significant, and market will open right around it on next week.
Taking a look at very big picture, current upward move could become just another bounce from all time 50% support at 1.21 area. The first test and bounce from this area has taken place in summer of 2010, as you can see on the chart. In very long-term perspective it could mean that market is challenging 1.21 area. So it could bounce ones, twice, but bounces should start to fade and sooner or later this level could be broken.
So, major idea of monthly chart – we have bullish sentiment. If market will pass through 1.35 area – next resistance and target is 1.3830.
Weekly
Trend holds bullish here, as well as price action. Market stands above MPR1, so I do not have pivots on this chart. Price has accomplished our first condition that we’ve announced on previous research – “since market has hit 0.618 extension – any retracement will be OK, if it will be tight”. That has happened – market has flirted a bit with this level by tight rectangle consolidation and yesterday, finally, we’ve got upward continuation. Still, here we stand in a bit tricky situation. Since market already has passed above 0.618, then it’s logical next destination is 1.0 extension at 1.3780 area – in Agreement with major 5/8 resistance at 1.3830. There is no overbought and Fib levels ahead. From another point of view – we stand at natural 1.3486 resistance, that is also 50% level, as we’ve noted above, and, take a look – 1.618 extension of BC leg. Rather solid barrier, isn’t it? Usually you never know how market will deal with it, because from the Fib work standpoint – they are minor levels. Market very rare retraces from 1.618 extension of BC leg of AB=CD patterns. So, market could pass them as they not exist or some retracement could happen. That’s why it is always better to have some patterns on lower time frames that could give you more accurate information on how to deal with it, where to place stop and where to enter.
Another unpleasant moment with this AB=CD is slow CD leg.
Daily
Daily time frame does not give us more clarification, it just confirms that we at resistance. Trend is bullish here, market is not at overbought. Current level is recent AB=CD target and 1.27 extension of previous AB=CD as well. So, probably it will better to take a look at lower time frames…
4-hour
I think that 4-hour chart is our major picture for beginning of the week. First, is because we have a pattern here. That is bearish butterfly. Price has passed above its 1.27 extension, so it’s very probable that resistance should appear around 1.618 – 1.3495 area. Butterfly will be treated as worked pattern, if market will show even 3/8 retracement from its completion point. We, in turn, also do not want to get deep retracement, and weekly pivots will become our major assitance. Take a look that nearest 3/8 support coincides with WPP, while WPS1 stands between 1.3310-1.3346 area. We know that when market stands in a bull trend – WPS1 should hold possible retracement. Hence, even move to WPS1 will not mean that bullish trend is over (if it will not lead to H&S pattern, for example). Still, I prefer tight retracement to get confidence with bullish strength, I mean pullback only to WPP, because deeper move, for example to WPS1 will keep door open for appearing of bearish patterns and make right decision will be more difficult.
Anyway, major conclusion here is to not enter long right now, wait a pullback. Perfectly, if it will happen only to WPP. To take short position at butterfly sell or not – that choice is up to you.
1-hour
This chart could be useful mostly for those of you who intends take short position on butterfly pattern. Here context is forming for possible DRPO “Sell” pattern. Market could form higher second top of DRPO and complete butterfly 1.618 target and turn to retracement. Minimum target of DRPO is 50% support of its thrust – stands near WPP.
Conclusion:
In a big picture bias holds bullish. Price now stands near the level that probably not as important from technical point of view as from sentiment analysis. Next major long-term target is 1.3830 area.
In a shorter term perspective, price stands at resistance and could show downward retracement. Preferably is, if it will stop at WPP. Those of you, who intends to take scalp short position on 4-hour Butterfly Sell, probably should keep an eye on hourly DRPO pattern that could trigger the retracement down.
P.S. Personally, I like more GBP daily chart for trading in the beginning of the week...
The technical portion of Sive's analysis owes a great deal to Joe DiNapoli's methods, and uses a number of Joe's proprietary indicators. Please note that Sive's analysis is his own view of the market and is not endorsed by Joe DiNapoli or any related companies.
Last edited: