Sive Morten
Special Consultant to the FPA
- Messages
- 18,771
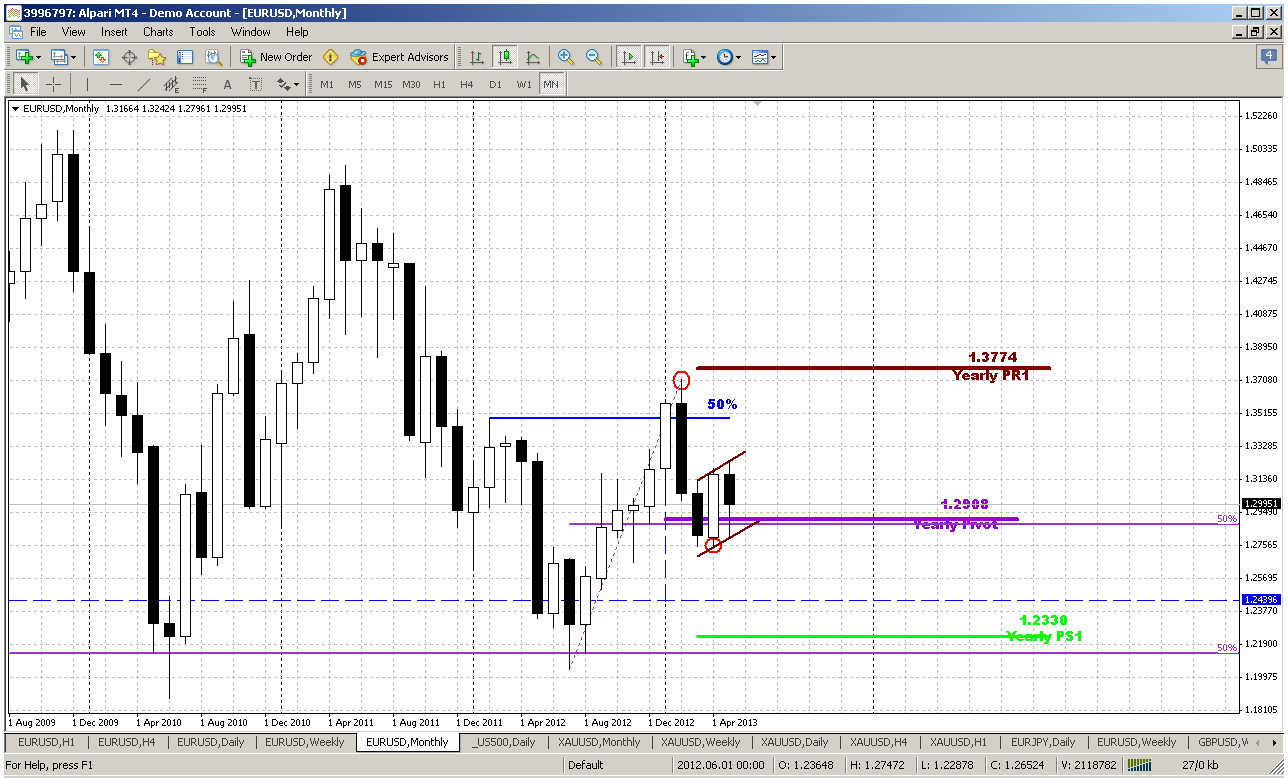
Monthly
Despite rather drammatical action on previous week, monthly chart has not changed much.
Monthly chart now looks very intriguing. First of all here we can see impact of yearly pivot support. This is really long-term support and it rather strong, especially since it coincides with 50% Fib support, and market can’t still pass through it. In fact, moving below yearly pivot will give market the direction for the rest of the year – that’s why this level is significant.
On previous week we’ve discussed appearing of bullish engulfing pattern around 1.29 area and perspectives of it, but on passed week market has shown too extended retracement down. Although lows of engulfing have not been taken out, now it starts to look more as flag bearish continuation pattern, rather than upward continuation appeal.
Currently I do not see valuable reasons to speak about upward trend – signs of it are weak, if they exist at all. it will be possible to start think about potential upward action only if market will return right back to major 50% resistance around 1.3500 area at minimum, or even will take out 1.37 highs.
Conversely bearish continuation needs to show shallower confirmations – will be enough, if market will break flag down and move below yearly pivot point. Perspectives of this potential action are really impressive. First road will be to 1.2150- 1.2330 Yearly pivot support 1 and all time 50% support. But next is 1.1650 – take a look, may be you also will find potential left wing of butterfly “Buy” here...
Even if we take a look at nature of action here, we can see that downward candles are faster, greater and heavier. Previous retracement up lasted for 7 monthly, but after 2 months market has passed half of it back. The combination of all these moments makes me think that domination on bears’ side still. I can’t specify precisely the value of it, but it seems that bears have more power here now. Although we do not see it here, but on lower time frame we just can get compounded upward retracement (we call it as “retracement” by far), that will postpone a bit downward action. It clearly could be seen on weekly time frame.
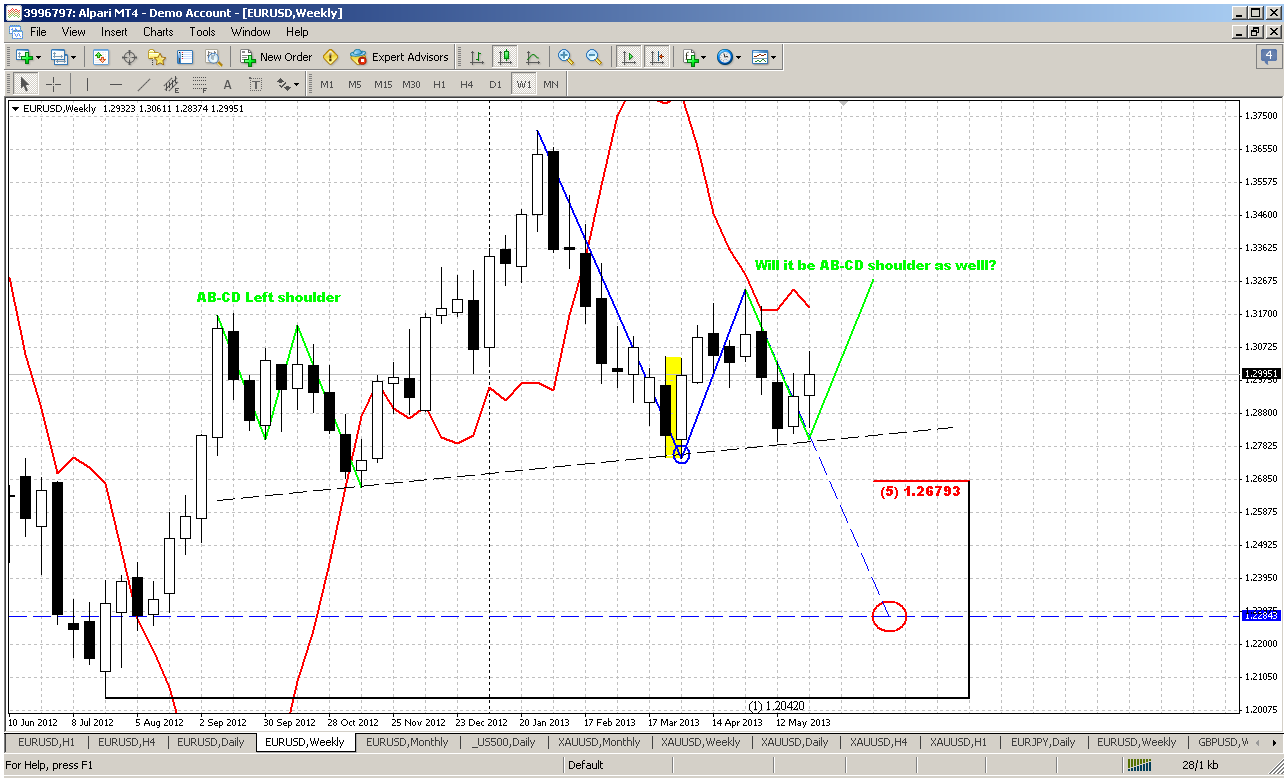
Weekly
On weekly time frame we can see this procrastinatory factor that we’ve taked about. Take a look that left shoulder of our pattern has AB-CD shape. Since H&S is harmonic pattern – the right shoulder also can take AB-CD shape. Although on previous 2 weeks we have talked about possible bounce up from neckline and anticipated that – initially we thought that this should not last too long, but now we see that bouce is a bit extended in time and this move up holds for the second week in a row. Now let’s try to assess and investigate the type of this move and how will be reasonable to treat it.
By my humble opinion this is not yet the challenge for AB-CD up. I do not know exactly, but somehow I am not ready to treat it as started AB-CD. I mostly gravitate to the thought that this is just retracement by far from the downward swing. I can explain. Look at previous upward continuations - as with left shoulder, when market bounce up from the neckline, as around 1.20 low. Both supports give market significant acceleration and candles were long and close near the top. But here we do not see this action yet. Past week has long shadows and not impressive range to the upside. This makes me think that current upward could not become completed AB-CD, but CD leg could be shorter and not neccesary will lead to 1.33 level. Anyway we will see, but currently we should not overvalue the meaning and nature of current move up from neckline. This leads to conclusion that bear trend is still intact as patterns that are forming here.
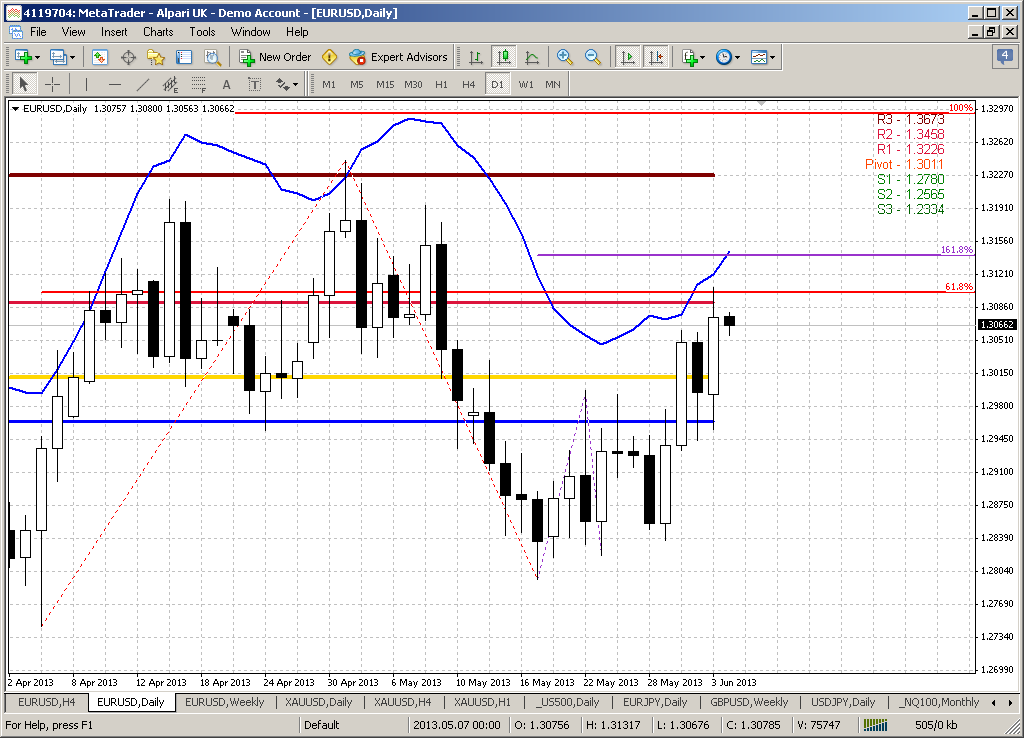
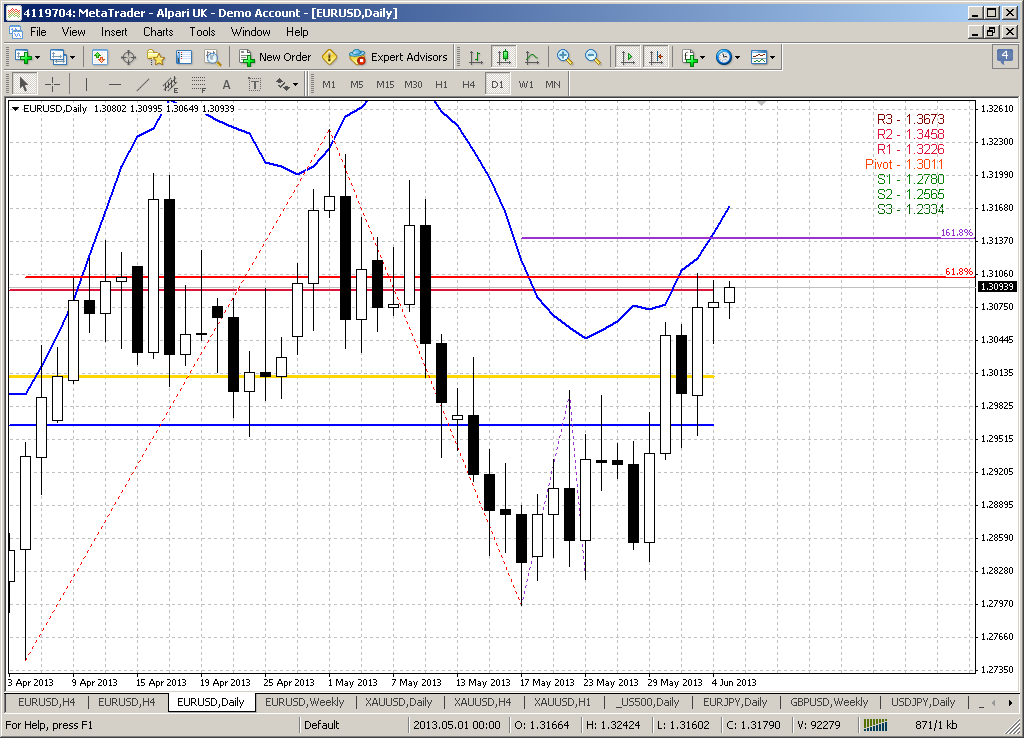
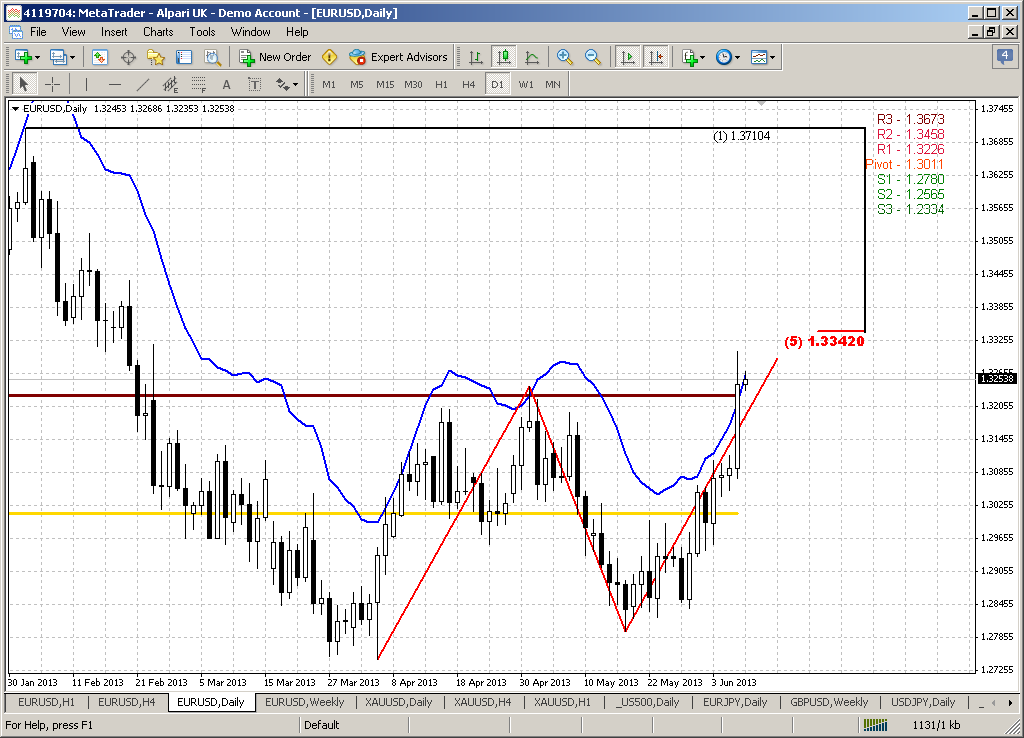
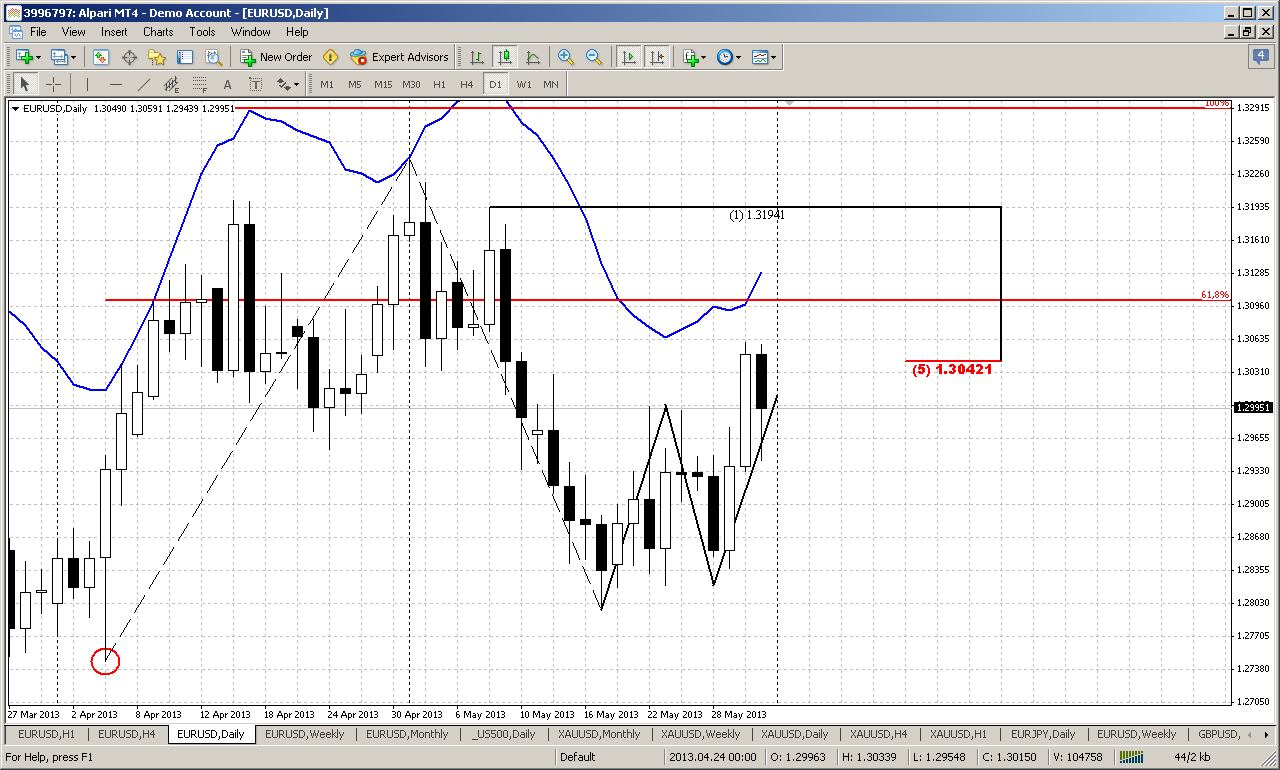
Daily
On daily time frame situation looks blurring a bit. Trend holds bullish, but market is not at overbought yet. Price has reached our Agreement resistance area and shown reasonable retracement down. What’s next? Was it just a retracement or, as we’ve said it could be “222” Sell pattern and it was just AB-CD retracement up? But the major disappointment here is that daily chart can’t clarify this totally, at least not yet. Here we have some bullish signs – strong breakout through previous 50% support and 1.2950 swing low resistance. After reaching 1.3050 resistance market has shown retracement and re-tested broken 1.2950 area. This is normal behavior for bullish price development. Thus, here we probably can try to estimate some significant and crucial levels that will help us to understand whether situation holds normal or something is wrong.
For upward action we need to keep an eye on 1.2920 area. After hitting AB-CD target market can show 5/8 retracement or only 50%, but too extended move down will look suspicious and will be the first sign that situation could turn to “222” sell. Next upward target is minor 61.8% extension of large weekly AB-CD and it stands at 1.31 area. If market will hold above 1.2920 and show 3-Drive “sell” pattern – it’s target also will be around it. Thus, to keep 1.31 target valid, market should not show move deeper than 1.2920.
For bears this will be probably the time of expectation. As trend holds bullish on daily as well as price action and we do not have any bearish pattern or something of that sort – we can’t enter short right now. We need either trend shifting or appearing some bearish combination or pattern. But if market will move below as weekly as monthly pivots and break through 1.2920 – this could be the first signs of downward continuation.
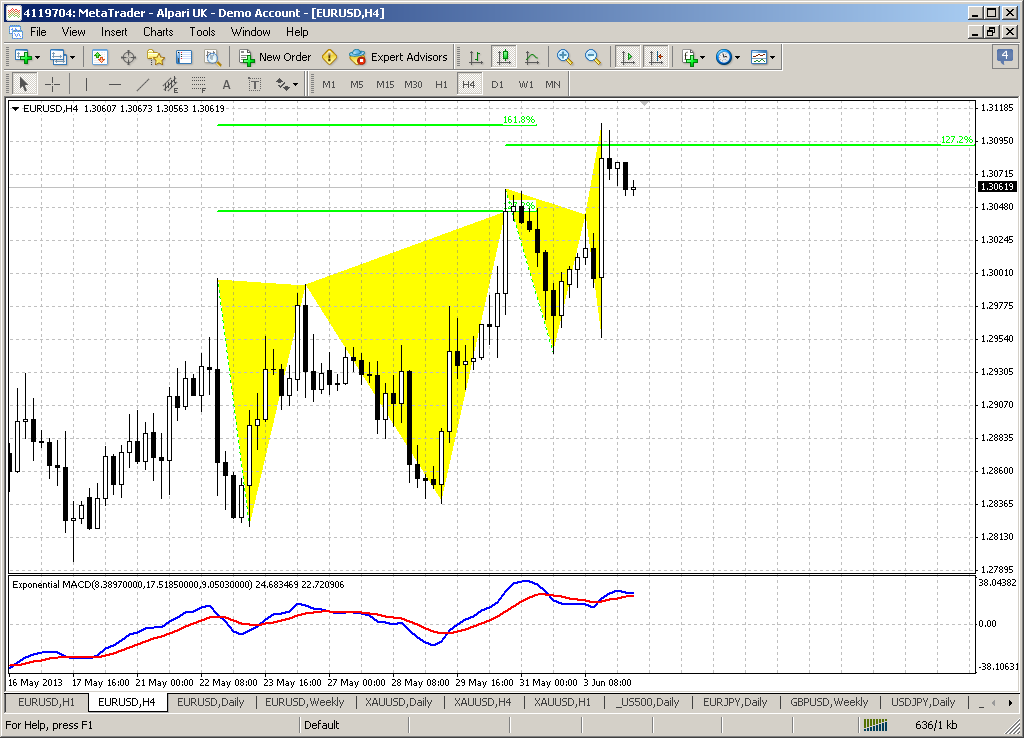
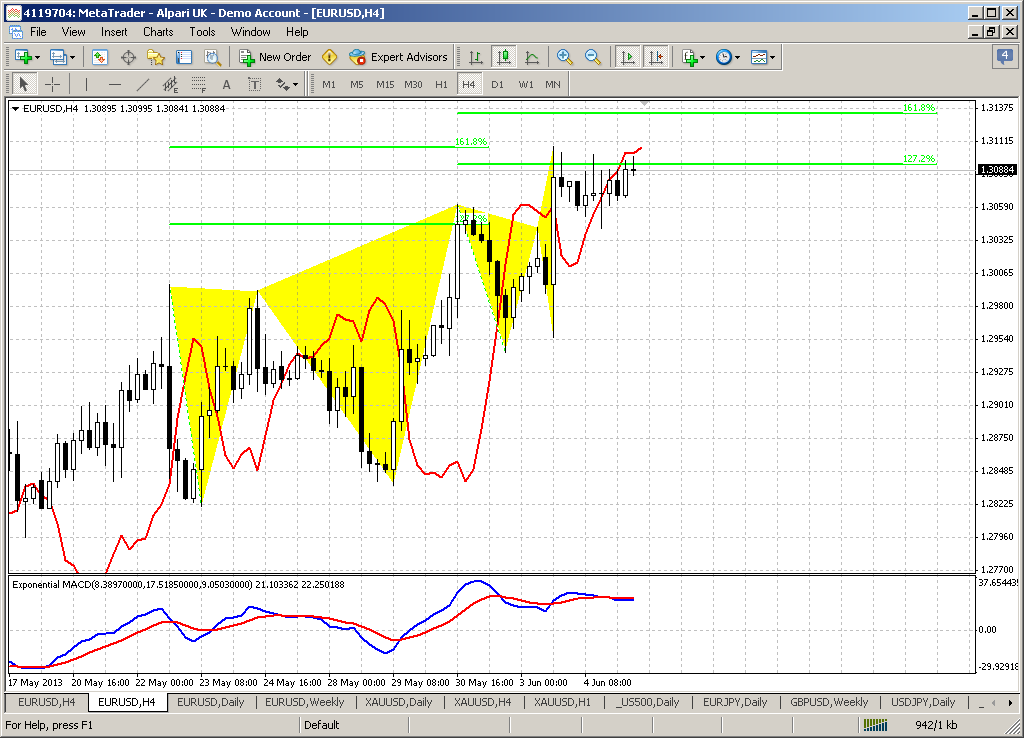
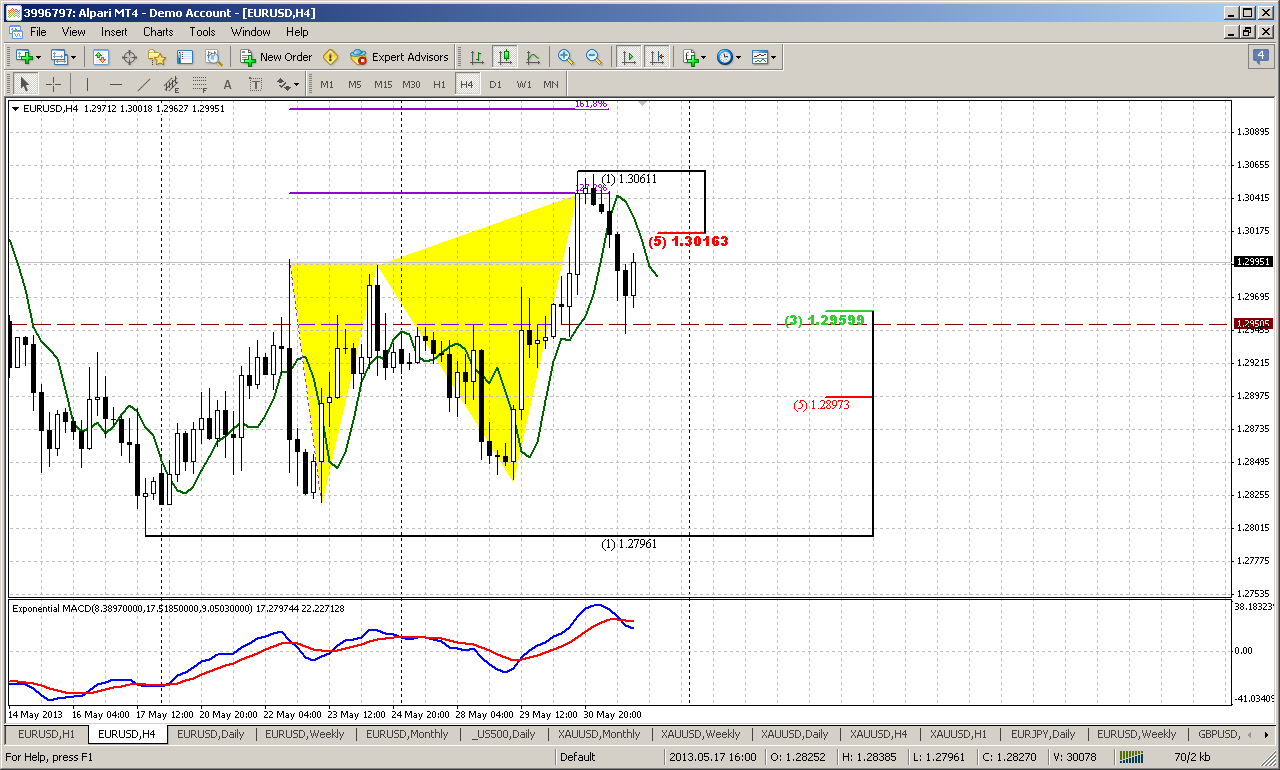
4-hour
This time frame also keeps door open for both directions. We have 1.27 butterfly pattern, that is also could become the 2nd drive in our potential 3-Drive “sell” pattern. This butterfly has 1.27 point right at our daily Agreement area and market has shown nice response on it.
Simulteniously this move down has created excellent context for DiNapoli B&B “Buy” and market behaves absolutely accordingly to our expectation – has hit 3/8 major support (that is also previous 1.2950 broken low) within 3 close below 3x3 DMA and now market is showing the bounce up. Interesting that 1.618 extesnion stands right at 1.31 – minor target of weekly AB-CD pattern and WPS1.
So, the possible development here as follows. First is – market probably will hit B&B target that is 5/8 resistance of whole downward retracement. But after that some variations are possible. We will get either AB=CD retracement down right to 1.2920, or upward continuation to 1.31. So, be careful with long position that you have based on B&B (if you have any). As market will hit 1.3016 – take at least half the profit and move stop loss on breakeven on the rest half of your position.
It is difficult to advise initiating of new position right now, since stop will be too far and risk/reward inatractive. That’s why for short position it will be better to wait reaching of 1.31 area, while if you would like to enter long – wait retracement to 1.2920. I do not want to say that market will turn up there, but as we’ve said in daily part – this is one of our significant points. Market stands now at resistance and it is not logical to take long right here.
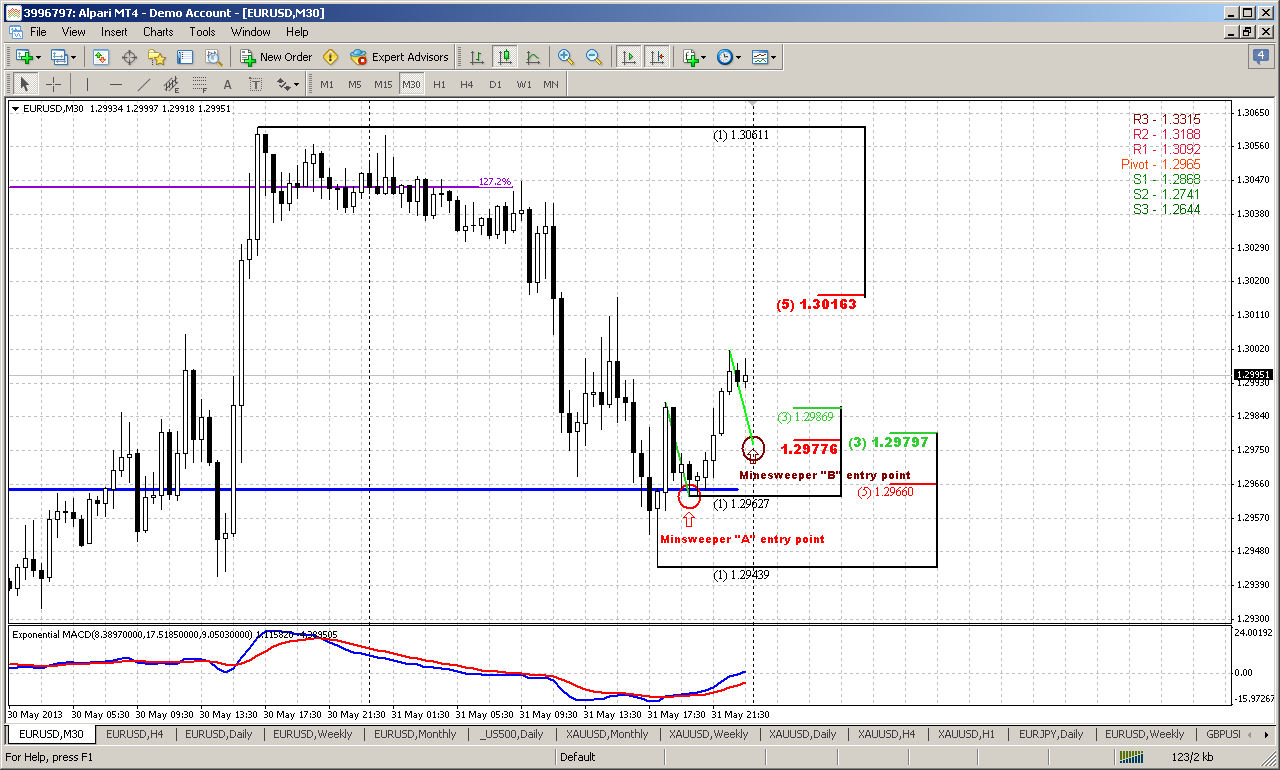
30-min
Since currently we have a lack of clear oportunities for trading, actually we just have in progress B&B – let’s discuss the scalp trade and framework of DiNapoli “Minesweeper” entry technique.
When you’re dealing with B&B, the major question that appears right at the beginning is how to determine from which level B&B will start. There are different possibilities exist, but we will focus only on current pattern. We know that B&B has to start within 3 closes below 3x3 DMA and from some significant support area. As market has hit support only during 3rd close – we didn’t need to guess. That was the only point where B&B could start and it has started.
After that we have to switch on lower time frame. Here I take 30-min chart. First thing that we have to wait here is when trend will shift bullish. Other words, when trend will support higher time frame bullish setup. Here we see that this has happened by solid upward jump right from support level. If you would like to apply Minesweeper “A” entry technique you need to enter long at first retracement after initial bounce up from higher time frame support and simulteniously control that trend here remains bullish. Both of these moments were accomplished apporximately at 50% retracement after initial move up. If you have missed this entry, you still can apply Minesweeper “B” technique. It almost the same to “A”, but assumes entry at firt K-support area that will appear when upward action will start develop.
Now take a look at the chart – we have perfect setup fo Minesweeper “B” entry. Trend hold bullish and it will remain bullish even if market will reach our K-support at 1.2977-1.2979 area. That is what we want to see. Harmonic swing of previous retracement also confirms this level as potential retracement target. This is good add-on. Thus, if you still want to take scalp part in B&B trading – you can try to take long at K-support with stop below 1.2965 area – 5/8 Fib support and WPP. Besides, you probably will have a chance even to move your stop at breakeven, since market probably will show a bounce up at first touch of K-area. Thus, if you will become wrong you will lose nothing or even gain something, but if you’re right you will get nice position that has tight stop, excellent risk/reward ratio and even potential to reach 1.31...
All these moments DiNapoli discusses in his book in “advance” entry technique, when he describes his intraday trading on S&P, but on the book it was written a bit complicated.
Conclusion:
In a big picture market stands at the edge of the deep – some steps down on monthly chart could lead to really dramatic fall to extended downward targets. Although downward action probably will be postponed a bit, even move to 1.33 will not cancel it totally.
Meantime, on short-term picture we have no choice but have to deal with lot of fuss about nothing - trying to catch some scalp trades and wait for further opportunities. This is frustrating, but market stands in such position where we have no sufficient confidence and taking of any position is not quite reasonable from risk management point of view. Still, it is very probable that market will get us more clarification within 1-2 days…
The technical portion of Sive's analysis owes a great deal to Joe DiNapoli's methods, and uses a number of Joe's proprietary indicators. Please note that Sive's analysis is his own view of the market and is not endorsed by Joe DiNapoli or any related companies.
Despite rather drammatical action on previous week, monthly chart has not changed much.
Monthly chart now looks very intriguing. First of all here we can see impact of yearly pivot support. This is really long-term support and it rather strong, especially since it coincides with 50% Fib support, and market can’t still pass through it. In fact, moving below yearly pivot will give market the direction for the rest of the year – that’s why this level is significant.
On previous week we’ve discussed appearing of bullish engulfing pattern around 1.29 area and perspectives of it, but on passed week market has shown too extended retracement down. Although lows of engulfing have not been taken out, now it starts to look more as flag bearish continuation pattern, rather than upward continuation appeal.
Currently I do not see valuable reasons to speak about upward trend – signs of it are weak, if they exist at all. it will be possible to start think about potential upward action only if market will return right back to major 50% resistance around 1.3500 area at minimum, or even will take out 1.37 highs.
Conversely bearish continuation needs to show shallower confirmations – will be enough, if market will break flag down and move below yearly pivot point. Perspectives of this potential action are really impressive. First road will be to 1.2150- 1.2330 Yearly pivot support 1 and all time 50% support. But next is 1.1650 – take a look, may be you also will find potential left wing of butterfly “Buy” here...
Even if we take a look at nature of action here, we can see that downward candles are faster, greater and heavier. Previous retracement up lasted for 7 monthly, but after 2 months market has passed half of it back. The combination of all these moments makes me think that domination on bears’ side still. I can’t specify precisely the value of it, but it seems that bears have more power here now. Although we do not see it here, but on lower time frame we just can get compounded upward retracement (we call it as “retracement” by far), that will postpone a bit downward action. It clearly could be seen on weekly time frame.
Weekly
On weekly time frame we can see this procrastinatory factor that we’ve taked about. Take a look that left shoulder of our pattern has AB-CD shape. Since H&S is harmonic pattern – the right shoulder also can take AB-CD shape. Although on previous 2 weeks we have talked about possible bounce up from neckline and anticipated that – initially we thought that this should not last too long, but now we see that bouce is a bit extended in time and this move up holds for the second week in a row. Now let’s try to assess and investigate the type of this move and how will be reasonable to treat it.
By my humble opinion this is not yet the challenge for AB-CD up. I do not know exactly, but somehow I am not ready to treat it as started AB-CD. I mostly gravitate to the thought that this is just retracement by far from the downward swing. I can explain. Look at previous upward continuations - as with left shoulder, when market bounce up from the neckline, as around 1.20 low. Both supports give market significant acceleration and candles were long and close near the top. But here we do not see this action yet. Past week has long shadows and not impressive range to the upside. This makes me think that current upward could not become completed AB-CD, but CD leg could be shorter and not neccesary will lead to 1.33 level. Anyway we will see, but currently we should not overvalue the meaning and nature of current move up from neckline. This leads to conclusion that bear trend is still intact as patterns that are forming here.
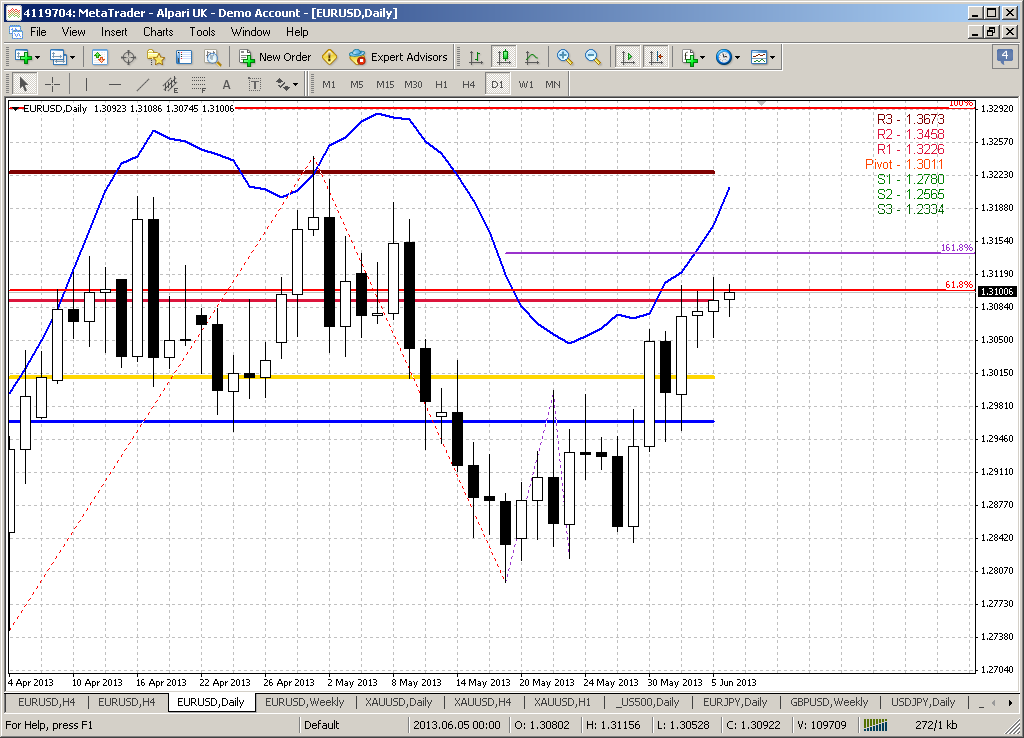
Daily
On daily time frame situation looks blurring a bit. Trend holds bullish, but market is not at overbought yet. Price has reached our Agreement resistance area and shown reasonable retracement down. What’s next? Was it just a retracement or, as we’ve said it could be “222” Sell pattern and it was just AB-CD retracement up? But the major disappointment here is that daily chart can’t clarify this totally, at least not yet. Here we have some bullish signs – strong breakout through previous 50% support and 1.2950 swing low resistance. After reaching 1.3050 resistance market has shown retracement and re-tested broken 1.2950 area. This is normal behavior for bullish price development. Thus, here we probably can try to estimate some significant and crucial levels that will help us to understand whether situation holds normal or something is wrong.
For upward action we need to keep an eye on 1.2920 area. After hitting AB-CD target market can show 5/8 retracement or only 50%, but too extended move down will look suspicious and will be the first sign that situation could turn to “222” sell. Next upward target is minor 61.8% extension of large weekly AB-CD and it stands at 1.31 area. If market will hold above 1.2920 and show 3-Drive “sell” pattern – it’s target also will be around it. Thus, to keep 1.31 target valid, market should not show move deeper than 1.2920.
For bears this will be probably the time of expectation. As trend holds bullish on daily as well as price action and we do not have any bearish pattern or something of that sort – we can’t enter short right now. We need either trend shifting or appearing some bearish combination or pattern. But if market will move below as weekly as monthly pivots and break through 1.2920 – this could be the first signs of downward continuation.
4-hour
This time frame also keeps door open for both directions. We have 1.27 butterfly pattern, that is also could become the 2nd drive in our potential 3-Drive “sell” pattern. This butterfly has 1.27 point right at our daily Agreement area and market has shown nice response on it.
Simulteniously this move down has created excellent context for DiNapoli B&B “Buy” and market behaves absolutely accordingly to our expectation – has hit 3/8 major support (that is also previous 1.2950 broken low) within 3 close below 3x3 DMA and now market is showing the bounce up. Interesting that 1.618 extesnion stands right at 1.31 – minor target of weekly AB-CD pattern and WPS1.
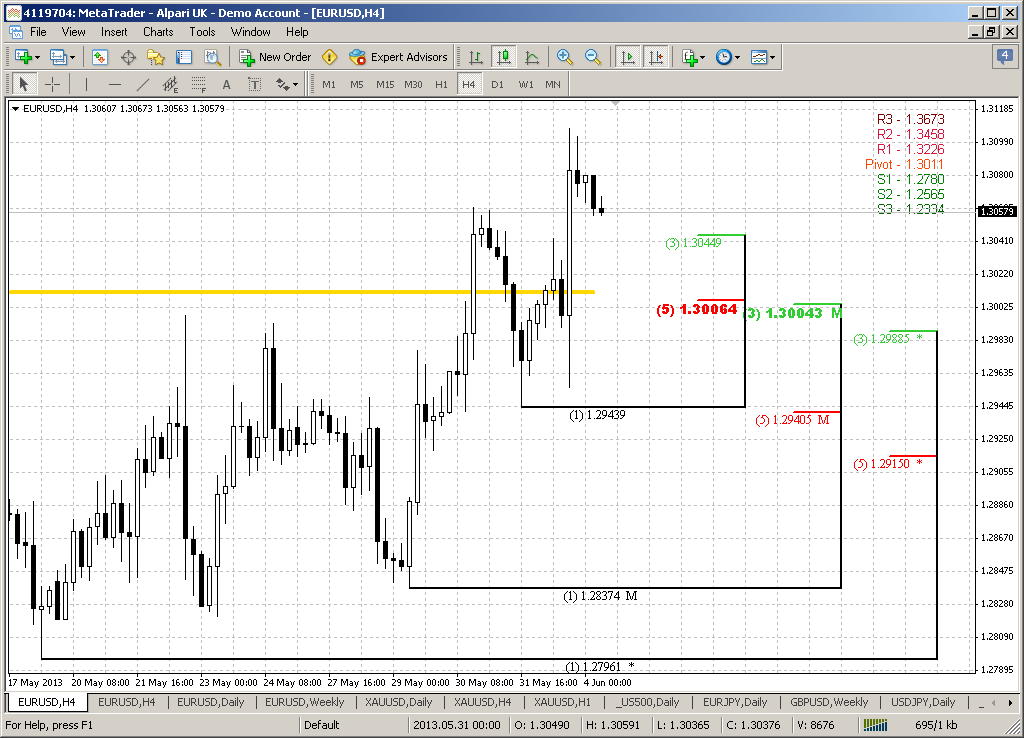
So, the possible development here as follows. First is – market probably will hit B&B target that is 5/8 resistance of whole downward retracement. But after that some variations are possible. We will get either AB=CD retracement down right to 1.2920, or upward continuation to 1.31. So, be careful with long position that you have based on B&B (if you have any). As market will hit 1.3016 – take at least half the profit and move stop loss on breakeven on the rest half of your position.
It is difficult to advise initiating of new position right now, since stop will be too far and risk/reward inatractive. That’s why for short position it will be better to wait reaching of 1.31 area, while if you would like to enter long – wait retracement to 1.2920. I do not want to say that market will turn up there, but as we’ve said in daily part – this is one of our significant points. Market stands now at resistance and it is not logical to take long right here.
30-min
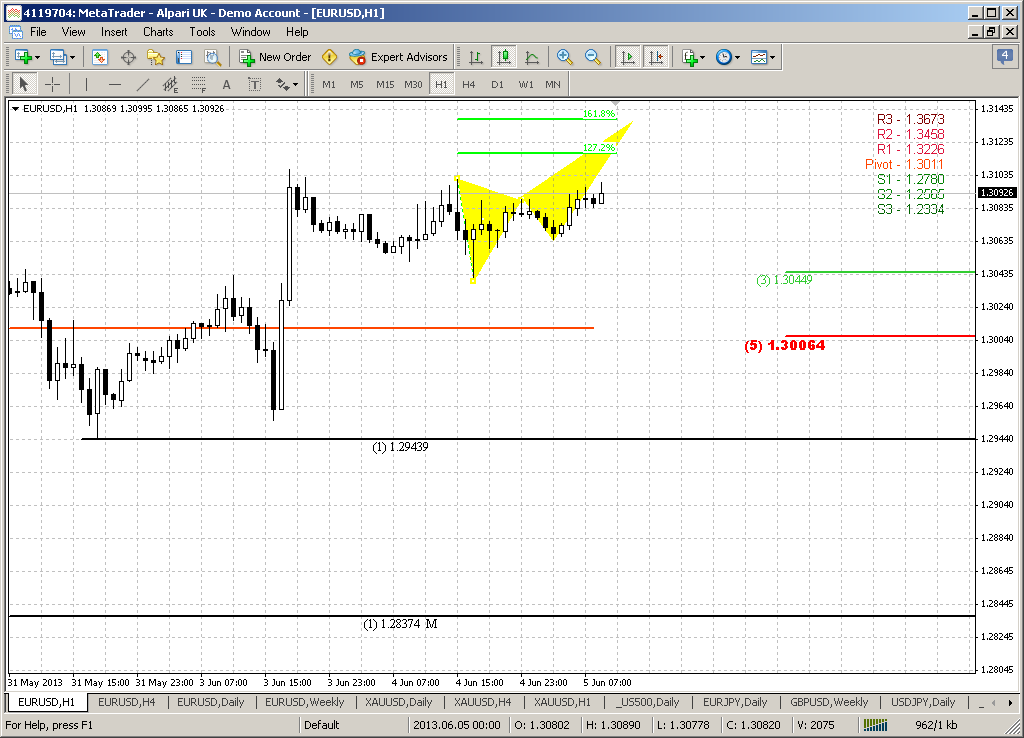
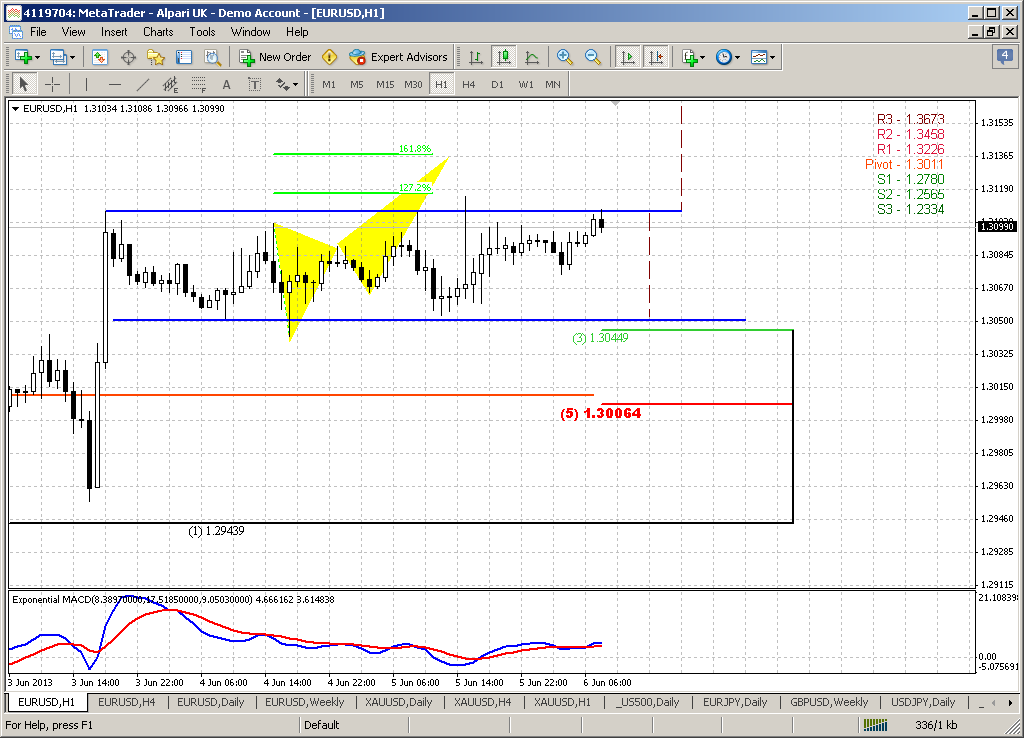
Since currently we have a lack of clear oportunities for trading, actually we just have in progress B&B – let’s discuss the scalp trade and framework of DiNapoli “Minesweeper” entry technique.
When you’re dealing with B&B, the major question that appears right at the beginning is how to determine from which level B&B will start. There are different possibilities exist, but we will focus only on current pattern. We know that B&B has to start within 3 closes below 3x3 DMA and from some significant support area. As market has hit support only during 3rd close – we didn’t need to guess. That was the only point where B&B could start and it has started.
After that we have to switch on lower time frame. Here I take 30-min chart. First thing that we have to wait here is when trend will shift bullish. Other words, when trend will support higher time frame bullish setup. Here we see that this has happened by solid upward jump right from support level. If you would like to apply Minesweeper “A” entry technique you need to enter long at first retracement after initial bounce up from higher time frame support and simulteniously control that trend here remains bullish. Both of these moments were accomplished apporximately at 50% retracement after initial move up. If you have missed this entry, you still can apply Minesweeper “B” technique. It almost the same to “A”, but assumes entry at firt K-support area that will appear when upward action will start develop.
Now take a look at the chart – we have perfect setup fo Minesweeper “B” entry. Trend hold bullish and it will remain bullish even if market will reach our K-support at 1.2977-1.2979 area. That is what we want to see. Harmonic swing of previous retracement also confirms this level as potential retracement target. This is good add-on. Thus, if you still want to take scalp part in B&B trading – you can try to take long at K-support with stop below 1.2965 area – 5/8 Fib support and WPP. Besides, you probably will have a chance even to move your stop at breakeven, since market probably will show a bounce up at first touch of K-area. Thus, if you will become wrong you will lose nothing or even gain something, but if you’re right you will get nice position that has tight stop, excellent risk/reward ratio and even potential to reach 1.31...
All these moments DiNapoli discusses in his book in “advance” entry technique, when he describes his intraday trading on S&P, but on the book it was written a bit complicated.
Conclusion:
In a big picture market stands at the edge of the deep – some steps down on monthly chart could lead to really dramatic fall to extended downward targets. Although downward action probably will be postponed a bit, even move to 1.33 will not cancel it totally.
Meantime, on short-term picture we have no choice but have to deal with lot of fuss about nothing - trying to catch some scalp trades and wait for further opportunities. This is frustrating, but market stands in such position where we have no sufficient confidence and taking of any position is not quite reasonable from risk management point of view. Still, it is very probable that market will get us more clarification within 1-2 days…
The technical portion of Sive's analysis owes a great deal to Joe DiNapoli's methods, and uses a number of Joe's proprietary indicators. Please note that Sive's analysis is his own view of the market and is not endorsed by Joe DiNapoli or any related companies.