Sive Morten
Special Consultant to the FPA
- Messages
- 18,706
Monthly
The dollar climbed on Friday, boosted by an unexpectedly large jump in U.S. jobs growth that set off enough buying to lift the greenback from a four-month low. Traders shifted gears when the U.S. Labor Department reported that America's employers added 175,000 jobs to their payrolls last month after creating 129,000 new positions in January. Forecasts had been for gains of about 149,000, according to a Reuters poll. The unemployment rate rose to 6.7 percent from a five-year low of 6.6 percent but the reports from Washington eased widely held worries that the U.S. economic recovery was stuck in a soft patch. "It is stronger than expected on several fronts. That the numbers came even while weather was bad shows the underlying strength of the economy," said currency strategist Camilla Sutton at Scotia Capital in Toronto. "It is good for the U.S. dollar." The data portraying job market improvements also meant the Federal Reserve was unlikely to slow its winding down of its bond-buying stimulus program now running at $65 billion a month, according to Sutton and other institutional investors. Average hourly wages during February rose by 9 cents, a result applauded by commentators as a possible sign of building demand for workers.
"We know that we need stronger wage growth, stronger investment spending, and strong job growth if growth in 2015 has a chance of matching 2014," said currency and rates analyst Eric Green at TD Securities. "The report today leaned in that direction. It did no more than lean, but that is enough to push rates higher and flatter." The U.S. dollar also rose against the Canadian dollar, which was stung by a data release showing an unexpected loss of Canadian jobs last month.
In earlier European trade, the euro hit a 2-1/2 year high of $1.3915, its highest since October 2011. The euro has made broad based gains after the ECB on Thursday decided to stand pat on policy and held off from fresh monetary stimulus. "The ECB was quite disappointing to a lot of euro bears," said Yujiro Gato, currency strategist at Nomura, London. The euro's gains accelerated on Friday after data from the ECB showed banks were set to repay a big chunk of its emergency 3-year loans next week. That repayment to the ECB shrinks its balance sheet size at a time when both the Federal Reserve and the Bank of Japan are expanding theirs by buying bonds. The repayment of loans leads to a drop in excess liquidity, a factor which saw money market rates rise and boost the euro's allure. Overall, investors are turning increasingly bullish about the euro after President Mario Draghi told a news conference that economic conditions in the region did not require a shift in monetary policy.
Technical
Today, guys, we again turn to JPY. Situation there has changed since our previous discussion and moved forward in agreement with our analysis of monthly chart. Our medium-term EUR analysis stands the same. As we’ve said in our previous research – EUR is moderately bullish and it has comfirmed this by recent action. All our suggestions concerning non-logical bearish action are confirming by current action. You may read about it in monthly and weekly parts of previous research. But right now is JPY. Here is the core of our previous discussion that is still valid and important:
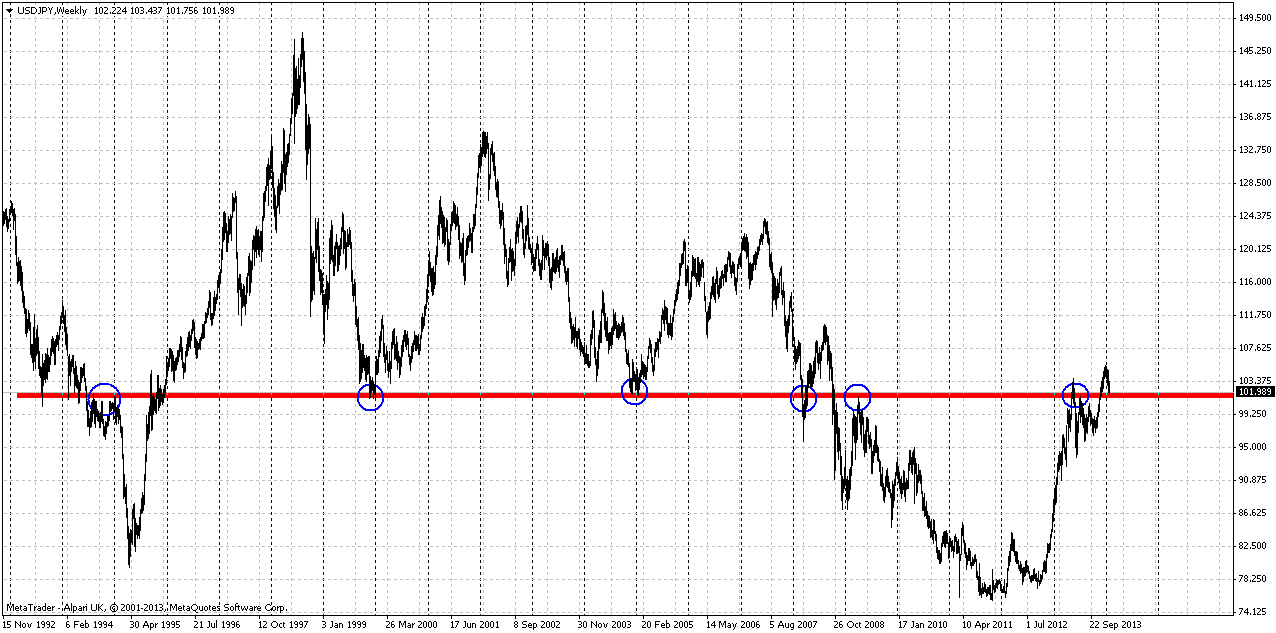
Let’s take a look at wide JPY chart first. Here is some very tricky moment hidden and if you careful enough you could find him. First of all, we see that 101.50 area is long-term natural support/resistance line. Sometimes market has pierced it significantly but this line holds. Now we also see that on previous touch market has pierced it as well, but has not broken it. No price stands slightly higher than the line that I’ve drawn, but still lower than previous high. It means that market has not passed through this resistance yet, although at first glance it seems the opposite is true. Now I would ask you – what do you expect to happen when you have natural resistance line and slightly higher solid Fib resistance level? Will chances on true breakout of resistance be greater or smaller? Market could loss a lot of momentum on struggle against natural level and then it will meet Fib resistance. This situation starts to smell as possible W&R or even failure breakout. That’s why it’s very interesting. Anything could happen of cause, but if price will swamp and form some reversal pattern in 101.50-105.5 area this could trigger solid retracement down. That is our primary object to monitor – identifying and catching reversal pattern in this area.
In previous research (on February 3d 2014) we noted that despite appearing of bearish engulfing pattern we see two possible risk factors here. First is that market has not quite reached Fib resistance, approximately for 30 pips. Second is now market has reached this 101.50 long-term level from upside and this could be just re-testing of broken level. Other words risk stands in possibility of upward continuation after re-testing of broken area. We should keep in mind these moments later, to create trading plan for next week.
On second monthly chart you can see modern picture of JPY.
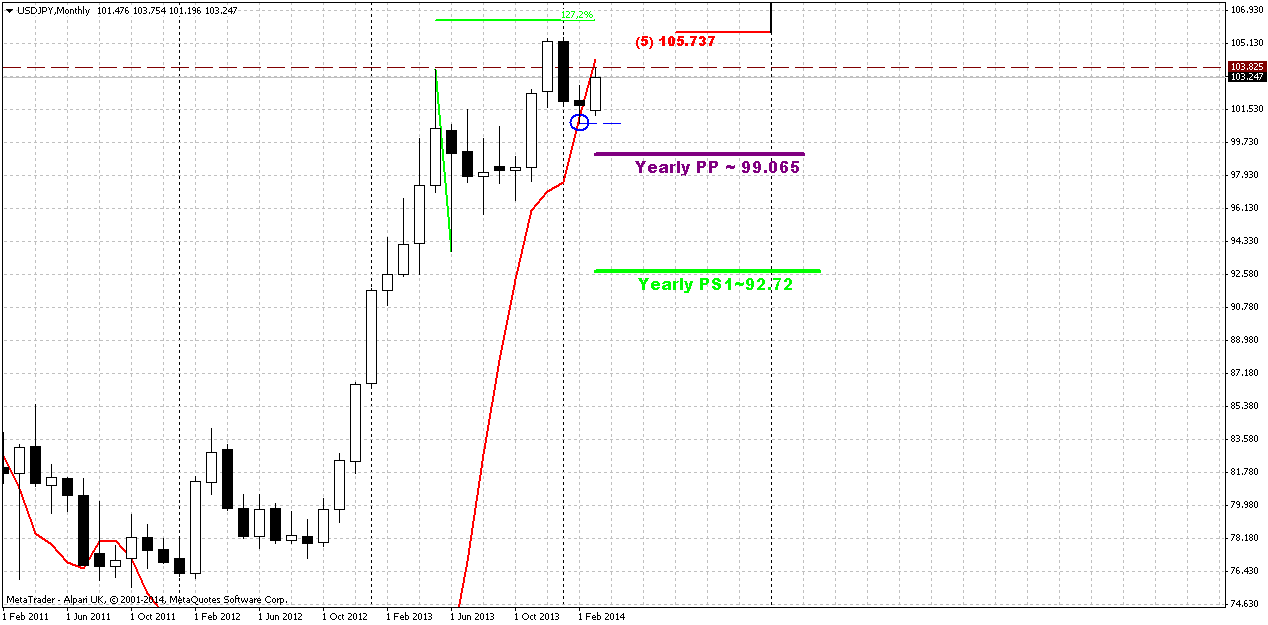
As we’ve noted above, in February we had only suspicions about another possible upward leg, but right now we can stick to the subject closely. And the reason for that stands with small candle that has given us monthly bullish stop grabber. Any clear monthly pattern is a huge advantage, because it is not just tells you where the target and invalidation points are. It also give you the direction for trading for a long perspective. As potential target we should use engulfing pattern’s highs, but we also have untouched Fib resistance and 1.27 extension of previous retracement. Thus, I suspect that market will reach it, if grabber will work.
Weekly
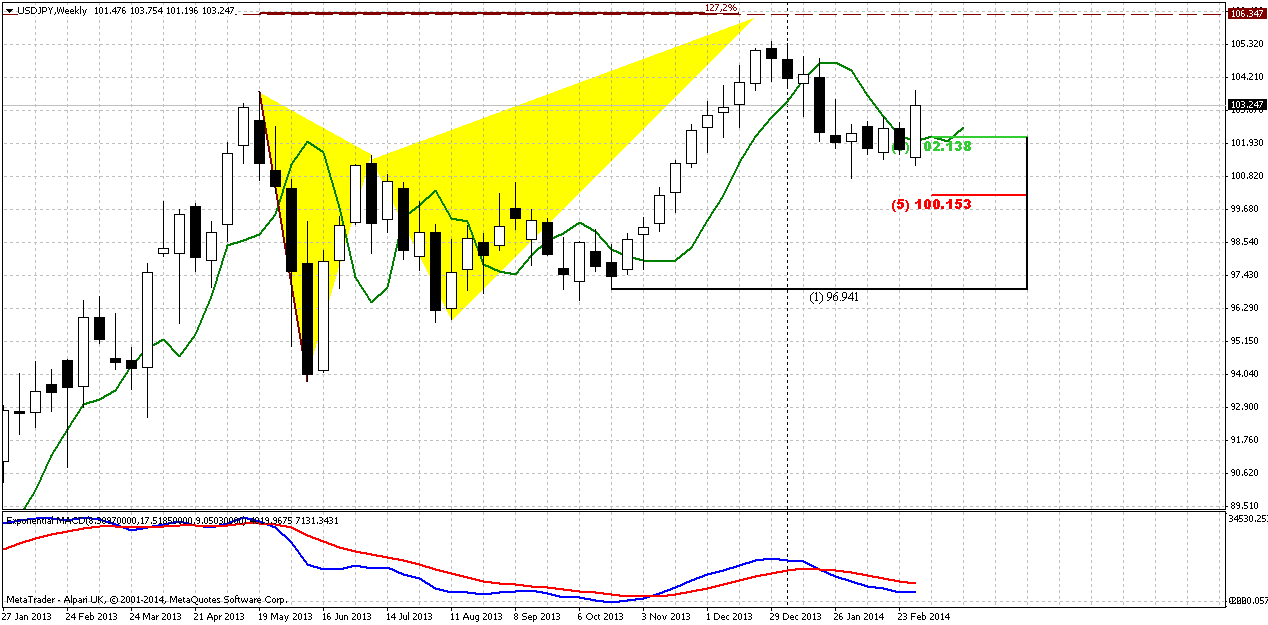
Finally market has reached B&B 103.50 “at least” target. Some of our forumers were frustrated concerning the term of B&B. They said it is “too long”. But guys, what have you expected? This is weekly pattern. Just imagine that you see not weekly but hourly chart – is it seems too long 4 hours to get the target? I guess not. The reason why you could think that it is too long is because you’ve chosen wrong time frame for trading that is not suitable for you by some reasons – either personality or money management (too large distances). Because this pattern has worked perfectly – it was not erased and it’s invalidation point was not hit. Pattern has reached the target after 4 periods. I do not see any problems here at all. As we’ve noted in previous disussion, B&B also could become a triggering pattern for upward continuation. Here is the part of our analysis from February 3d:
Second moment that I would like to discuss here is butterfly. As you can see market has turned down slightly earlier than 1.27 target. Reason for that stands on daily time frame – smaller butterfly that has hit 1.618 extension. So we have some sort of nested butterflies. Still, the moment that price has not quite reached 1.27 extension and monthly 5/8 Fib level is disturbing sign.
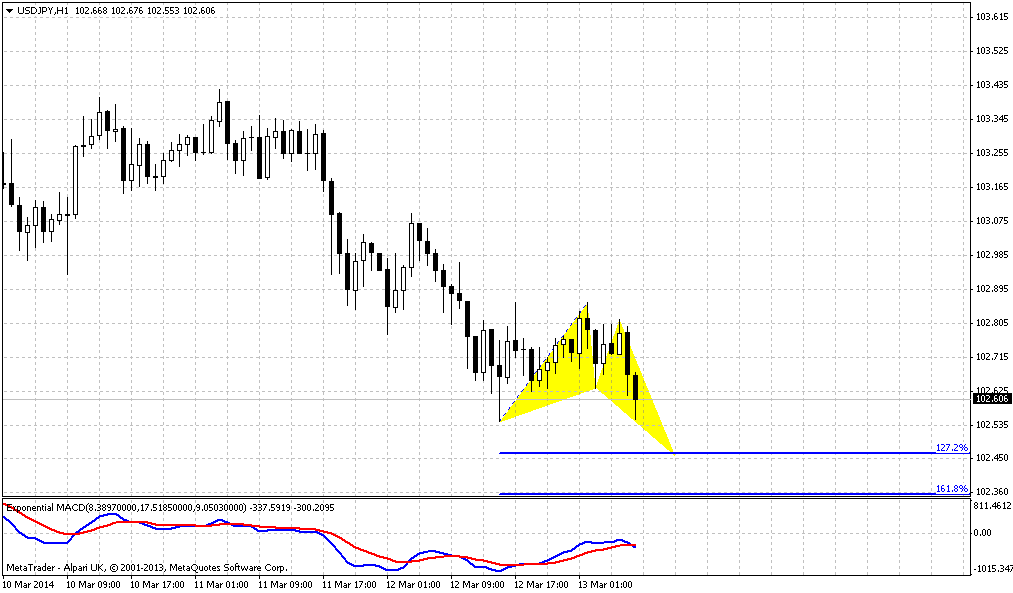
Now let’s make some analysis on MACD. This is final point here. First is – we have bearish divergence near major monthly Fib resistance. At the same time we have relatively bullish signs in smaller scale. Take a look – trend holds bearish by MACD, but price stands flat first and now has turned up. This might be bullish dynamic pressure that adds some points to our analysis concerning another leg up to 106-106.30 butterfly 1.27 target.
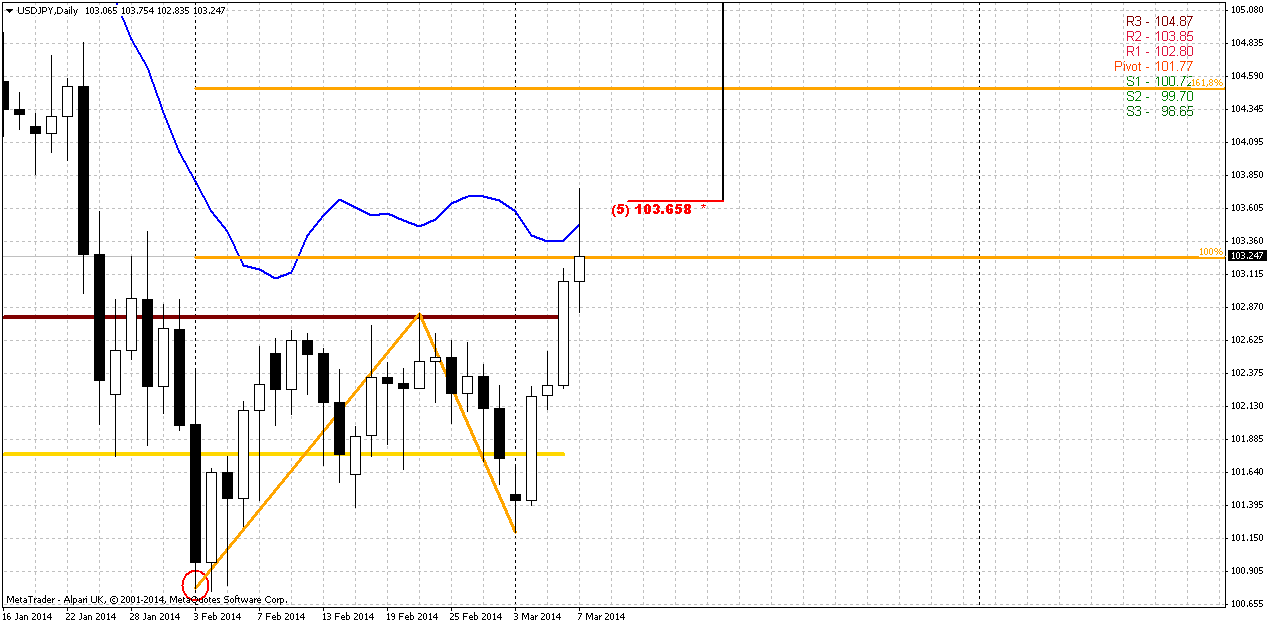
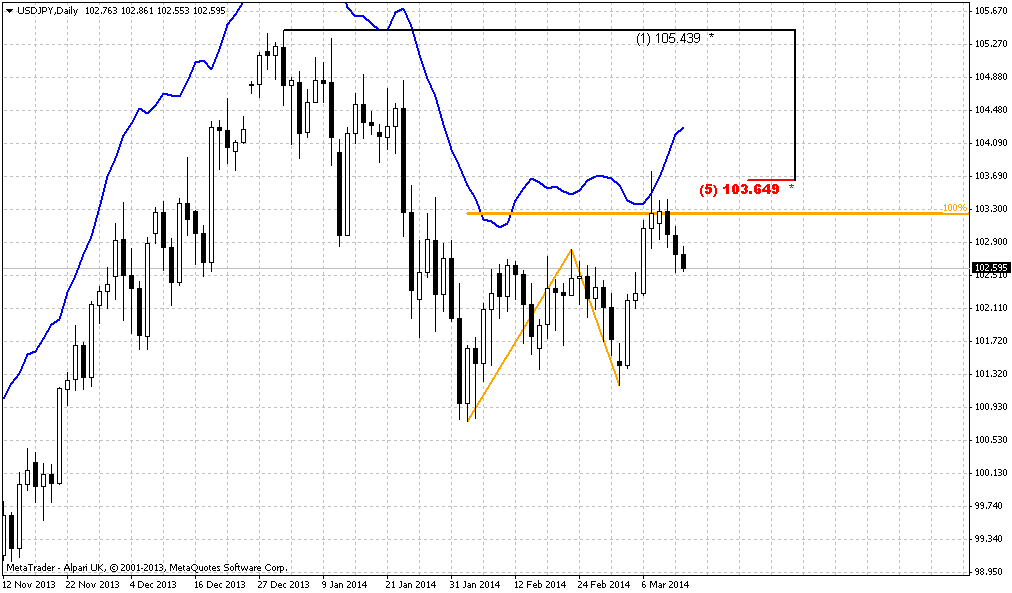
Daily
On daily time frame trend is bullish, price action is strong. Here is couple of moments that could be useful in trading on coming week. Take a look at AB=CD pattern first. Yes, market has hit our weekly B&B target. But price has accelerated right to 100% extension point and CD leg is much steeper then AB. This suggests further upward continuation. Next 1.618 extension stands at 104.50 point.
But second moment shows that currently we should think not about next target but about downward retracement in the beginning of the week. Although upward action is strong, but market has hit daily overbought right at Fib resistance and this is DiNapoli directional bearish “Stretch” pattern. And as we know from DiNapoli framework – “direction overrules trend”. Thus, in the beginning of the week we should be ready and be focused on possible bounce down. If you have skills to trade it – you can, I have no objection. But for daily traders major point is to take long position and buy dip.
Finally, another hint on possible upward continuation comes from MPP – price has exceeded MPR1.
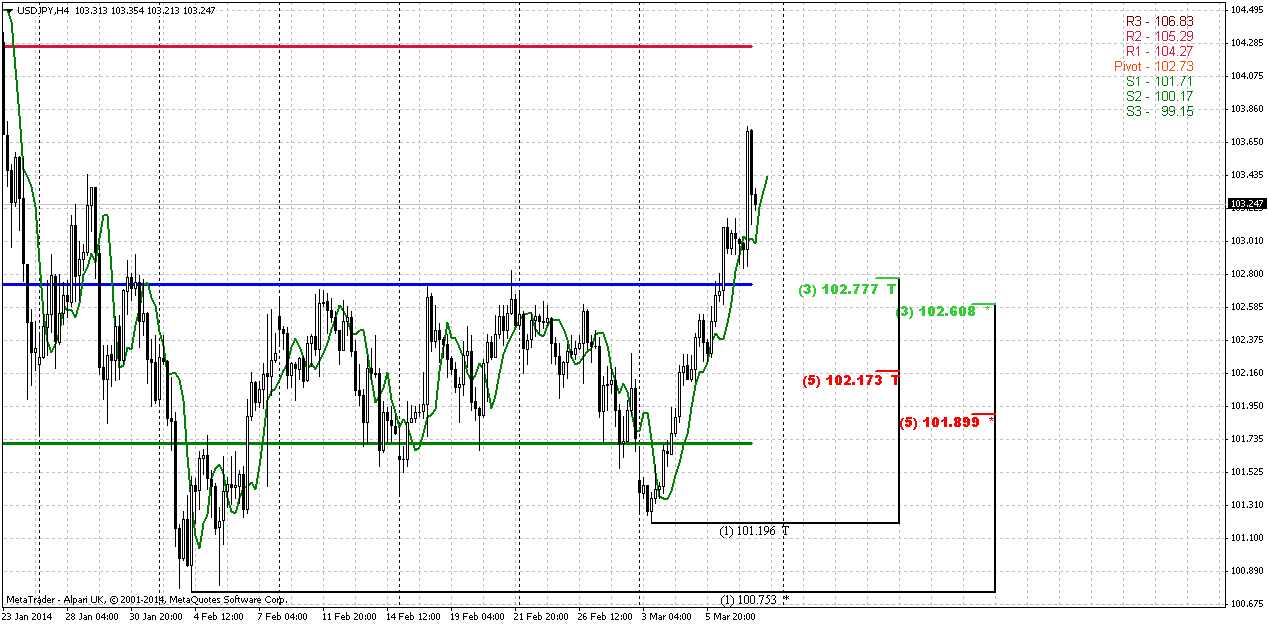
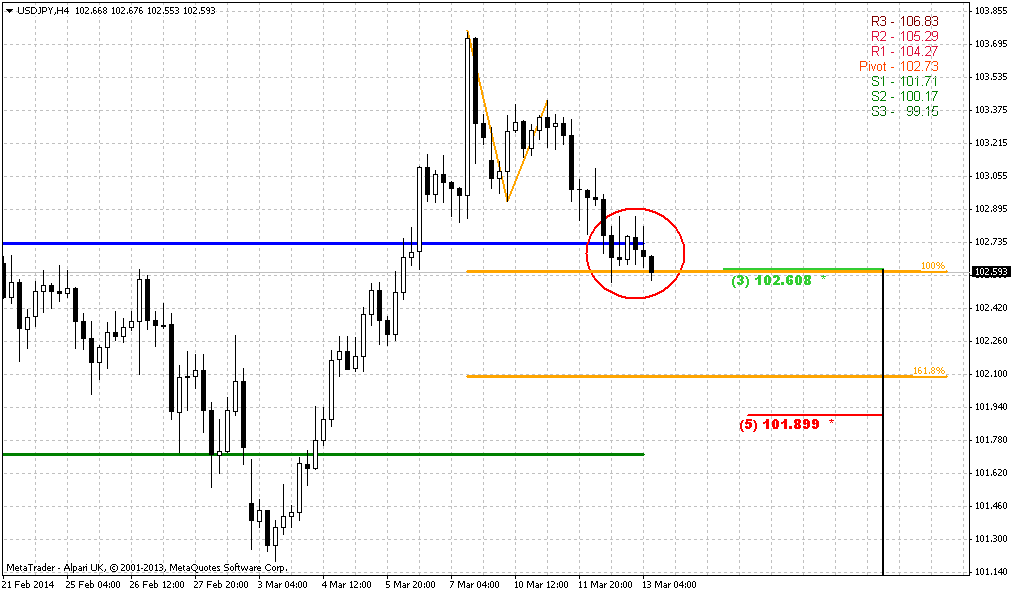
4-hour
Here I do not see any reversal patterns yet. WPR1 stands very close to next daily target around 104.50. Theoretically price could show retracement even to WPS1 and this will not be a tragedy. But, it will be better if retracement will end somewhere around WPP and nearest Fib levels, may be even around 102.17 support but not lower. This would be perfect. Since we have nice thrust up, reversal pattern here could be DRPO “Sell”. But let’s not turn to gambling – when week will start we probably will estimate this better. But major idea is clear – use pullback down for long entry.
Conclusion:
Our former suspicions concerning possible another leg up to 106-106.30 area have got logical continuation and market has formed monthly bullish stop grabber that suggests taking this area. Until it is valid our context holds bullish.
But as market has reached solid resistance on daily chart, our trading plan suggests waiting of downward retracement in the beginning of the week and taking long position with first target around 104.50.
The technical portion of Sive's analysis owes a great deal to Joe DiNapoli's methods, and uses a number of Joe's proprietary indicators. Please note that Sive's analysis is his own view of the market and is not endorsed by Joe DiNapoli or any related companies.
The dollar climbed on Friday, boosted by an unexpectedly large jump in U.S. jobs growth that set off enough buying to lift the greenback from a four-month low. Traders shifted gears when the U.S. Labor Department reported that America's employers added 175,000 jobs to their payrolls last month after creating 129,000 new positions in January. Forecasts had been for gains of about 149,000, according to a Reuters poll. The unemployment rate rose to 6.7 percent from a five-year low of 6.6 percent but the reports from Washington eased widely held worries that the U.S. economic recovery was stuck in a soft patch. "It is stronger than expected on several fronts. That the numbers came even while weather was bad shows the underlying strength of the economy," said currency strategist Camilla Sutton at Scotia Capital in Toronto. "It is good for the U.S. dollar." The data portraying job market improvements also meant the Federal Reserve was unlikely to slow its winding down of its bond-buying stimulus program now running at $65 billion a month, according to Sutton and other institutional investors. Average hourly wages during February rose by 9 cents, a result applauded by commentators as a possible sign of building demand for workers.
"We know that we need stronger wage growth, stronger investment spending, and strong job growth if growth in 2015 has a chance of matching 2014," said currency and rates analyst Eric Green at TD Securities. "The report today leaned in that direction. It did no more than lean, but that is enough to push rates higher and flatter." The U.S. dollar also rose against the Canadian dollar, which was stung by a data release showing an unexpected loss of Canadian jobs last month.
In earlier European trade, the euro hit a 2-1/2 year high of $1.3915, its highest since October 2011. The euro has made broad based gains after the ECB on Thursday decided to stand pat on policy and held off from fresh monetary stimulus. "The ECB was quite disappointing to a lot of euro bears," said Yujiro Gato, currency strategist at Nomura, London. The euro's gains accelerated on Friday after data from the ECB showed banks were set to repay a big chunk of its emergency 3-year loans next week. That repayment to the ECB shrinks its balance sheet size at a time when both the Federal Reserve and the Bank of Japan are expanding theirs by buying bonds. The repayment of loans leads to a drop in excess liquidity, a factor which saw money market rates rise and boost the euro's allure. Overall, investors are turning increasingly bullish about the euro after President Mario Draghi told a news conference that economic conditions in the region did not require a shift in monetary policy.
Technical
Today, guys, we again turn to JPY. Situation there has changed since our previous discussion and moved forward in agreement with our analysis of monthly chart. Our medium-term EUR analysis stands the same. As we’ve said in our previous research – EUR is moderately bullish and it has comfirmed this by recent action. All our suggestions concerning non-logical bearish action are confirming by current action. You may read about it in monthly and weekly parts of previous research. But right now is JPY. Here is the core of our previous discussion that is still valid and important:
Let’s take a look at wide JPY chart first. Here is some very tricky moment hidden and if you careful enough you could find him. First of all, we see that 101.50 area is long-term natural support/resistance line. Sometimes market has pierced it significantly but this line holds. Now we also see that on previous touch market has pierced it as well, but has not broken it. No price stands slightly higher than the line that I’ve drawn, but still lower than previous high. It means that market has not passed through this resistance yet, although at first glance it seems the opposite is true. Now I would ask you – what do you expect to happen when you have natural resistance line and slightly higher solid Fib resistance level? Will chances on true breakout of resistance be greater or smaller? Market could loss a lot of momentum on struggle against natural level and then it will meet Fib resistance. This situation starts to smell as possible W&R or even failure breakout. That’s why it’s very interesting. Anything could happen of cause, but if price will swamp and form some reversal pattern in 101.50-105.5 area this could trigger solid retracement down. That is our primary object to monitor – identifying and catching reversal pattern in this area.
In previous research (on February 3d 2014) we noted that despite appearing of bearish engulfing pattern we see two possible risk factors here. First is that market has not quite reached Fib resistance, approximately for 30 pips. Second is now market has reached this 101.50 long-term level from upside and this could be just re-testing of broken level. Other words risk stands in possibility of upward continuation after re-testing of broken area. We should keep in mind these moments later, to create trading plan for next week.
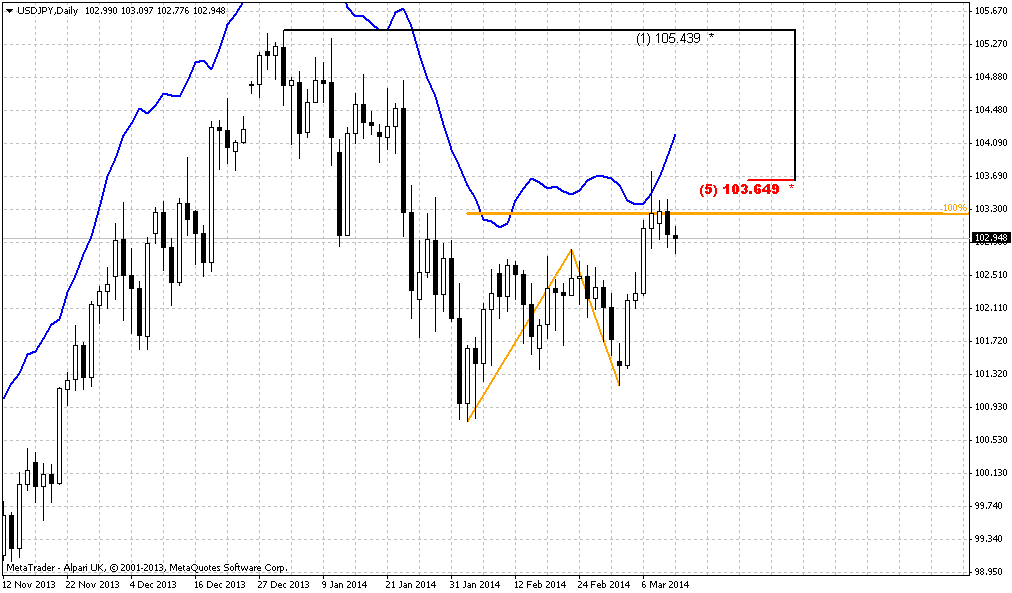
On second monthly chart you can see modern picture of JPY.
As we’ve noted above, in February we had only suspicions about another possible upward leg, but right now we can stick to the subject closely. And the reason for that stands with small candle that has given us monthly bullish stop grabber. Any clear monthly pattern is a huge advantage, because it is not just tells you where the target and invalidation points are. It also give you the direction for trading for a long perspective. As potential target we should use engulfing pattern’s highs, but we also have untouched Fib resistance and 1.27 extension of previous retracement. Thus, I suspect that market will reach it, if grabber will work.
Weekly
Finally market has reached B&B 103.50 “at least” target. Some of our forumers were frustrated concerning the term of B&B. They said it is “too long”. But guys, what have you expected? This is weekly pattern. Just imagine that you see not weekly but hourly chart – is it seems too long 4 hours to get the target? I guess not. The reason why you could think that it is too long is because you’ve chosen wrong time frame for trading that is not suitable for you by some reasons – either personality or money management (too large distances). Because this pattern has worked perfectly – it was not erased and it’s invalidation point was not hit. Pattern has reached the target after 4 periods. I do not see any problems here at all. As we’ve noted in previous disussion, B&B also could become a triggering pattern for upward continuation. Here is the part of our analysis from February 3d:
Second moment that I would like to discuss here is butterfly. As you can see market has turned down slightly earlier than 1.27 target. Reason for that stands on daily time frame – smaller butterfly that has hit 1.618 extension. So we have some sort of nested butterflies. Still, the moment that price has not quite reached 1.27 extension and monthly 5/8 Fib level is disturbing sign.
Now let’s make some analysis on MACD. This is final point here. First is – we have bearish divergence near major monthly Fib resistance. At the same time we have relatively bullish signs in smaller scale. Take a look – trend holds bearish by MACD, but price stands flat first and now has turned up. This might be bullish dynamic pressure that adds some points to our analysis concerning another leg up to 106-106.30 butterfly 1.27 target.
Daily
On daily time frame trend is bullish, price action is strong. Here is couple of moments that could be useful in trading on coming week. Take a look at AB=CD pattern first. Yes, market has hit our weekly B&B target. But price has accelerated right to 100% extension point and CD leg is much steeper then AB. This suggests further upward continuation. Next 1.618 extension stands at 104.50 point.
But second moment shows that currently we should think not about next target but about downward retracement in the beginning of the week. Although upward action is strong, but market has hit daily overbought right at Fib resistance and this is DiNapoli directional bearish “Stretch” pattern. And as we know from DiNapoli framework – “direction overrules trend”. Thus, in the beginning of the week we should be ready and be focused on possible bounce down. If you have skills to trade it – you can, I have no objection. But for daily traders major point is to take long position and buy dip.
Finally, another hint on possible upward continuation comes from MPP – price has exceeded MPR1.
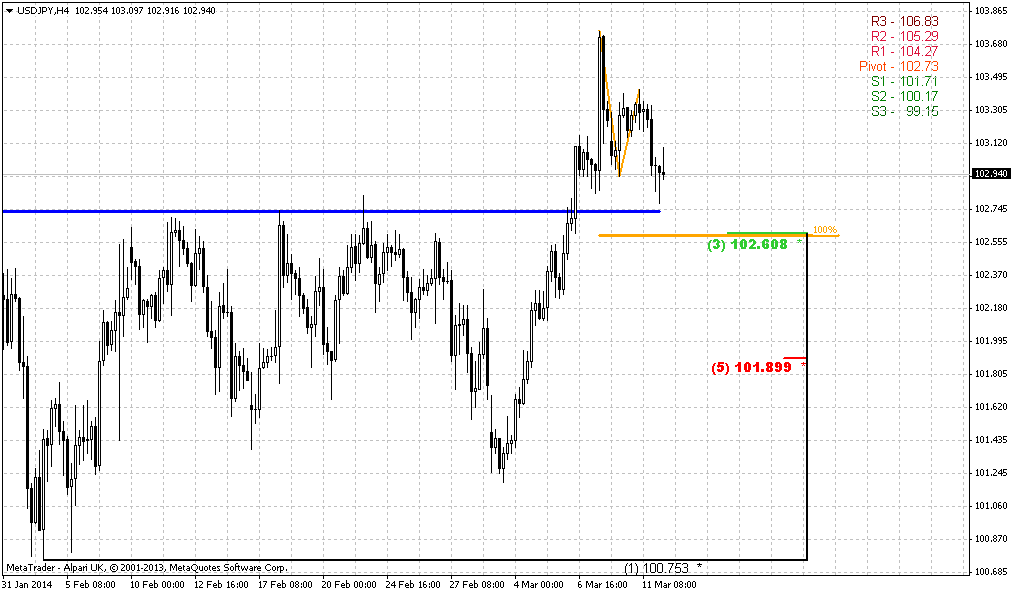
4-hour
Here I do not see any reversal patterns yet. WPR1 stands very close to next daily target around 104.50. Theoretically price could show retracement even to WPS1 and this will not be a tragedy. But, it will be better if retracement will end somewhere around WPP and nearest Fib levels, may be even around 102.17 support but not lower. This would be perfect. Since we have nice thrust up, reversal pattern here could be DRPO “Sell”. But let’s not turn to gambling – when week will start we probably will estimate this better. But major idea is clear – use pullback down for long entry.
Conclusion:
Our former suspicions concerning possible another leg up to 106-106.30 area have got logical continuation and market has formed monthly bullish stop grabber that suggests taking this area. Until it is valid our context holds bullish.
But as market has reached solid resistance on daily chart, our trading plan suggests waiting of downward retracement in the beginning of the week and taking long position with first target around 104.50.
The technical portion of Sive's analysis owes a great deal to Joe DiNapoli's methods, and uses a number of Joe's proprietary indicators. Please note that Sive's analysis is his own view of the market and is not endorsed by Joe DiNapoli or any related companies.
 Thanks