Sive Morten
Special Consultant to the FPA
- Messages
- 18,699
Monthly
The yen rose on Friday, poised for its biggest weekly gains in more than a month against the euro and the dollar as traders flocked to it on growing tension in Ukraine and fears about the health of the Chinese economy. The euro was also under pressure since hitting a 2-1/2-year high versus the greenback this week after European Central Bank President Mario Draghi raised concerns about the strength of the euro zone common currency. "I don't think anyone wants to hold any large risky positions going into the weekend," said Shaun Osborne, chief foreign exchange strategist at TD Securities in Toronto. Draghi said on Thursday that the strength of the euro was increasingly relevant to ECB's assessment of price stability - its central goal - because of the impact on inflation, which has strayed well below the official target. A strong currency reduces price pressure since it pares costs on imported goods and services. "We are finding good support on dips in the euro," TD's Osbourne said.
The euro's decline this week erased much of the gains made after the ECB held back from easing policy last Thursday despite projecting persistently low inflation. Draghi's comment then that the euro's strength had very little impact on imported inflation had helped it rally broadly. Traders said the euro is likely to keep drawing support from the ECB's decision to keep policy unchanged, higher money market rates, and the euro zone's large current account surplus.
NERVOUSNESS STOKES YEN DEMAND
Traders have favored the yen in the past 24 hours as fears about a war in Ukraine's Crimea peninsula and jitters over the Chinese economy in the wake of that country's first private bond default last week. Russia launched new military exercises near its border with Ukraine on Thursday, showing no sign of backing down on plans to annex its neighbour's Crimea region. U.S. Secretary of State John Kerry said serious steps would be imposed by the United States and Europe if the referendum on Crimea joining Russia takes place on Sunday as planned. After six hours of talks with Russian Foreign Minister Sergei Lavrov on Friday, Kerry said the Kremlin's next steps would depend on a final decision that Russian President Vladimir Putin would take after the referendum. Meanwhile, a record drop in U.S. Treasuries holdings by foreign governments with the Federal Reserve led some to speculate that Russia has been reducing its dollar reserves ahead of possible sanctions from the West.
"The risks to global growth both from China as well as from the Crimean situation are supporting yen," said Manuel Oliveri, FX strategist at Credit Agricole in London. Reflecting some of the nervousness, one-week implied volatilities in the dollar/yen pair - a gauge of how sharp currency swings will be - rose to 8.925 percent from a low of around 7.20 percent on Thursday. "In the near term more risk-averse trading conditions may continue to encourage a stronger yen," Lee Hardman, a currency analyst at Bank of Tokyo Mitsubishi, wrote in a note. "The Chinese economy appears to have downshifted to a slower pace of growth in the first quarter, as evident in the weak economic reports from February." Chinese Premier Li Keqiang warned on Thursday that the economy faced "severe challenges" in 2014 while expectations of more debt defaults kept alive worries about the state of its financial sector.
Technical
Well, guys, right now is not very suitable moment to prepare any technical forecasts and this could be a thankless job, as we’ve said on Friday, mostly due geopolitical tensions. Still let’s make our technical job, may be it will appear to be not as useless as we think now.Trend holds bullish on monthly time frame and EUR looks more bullish rather than bearish on monthly chart. Recent price action confirms our suggestion that until market stands above 1.33 we can’t tell that EUR has turned down. So, for us 1.33 is a crucial level. Currently investors have twofold thoughts on fundamental data. One group tells that recent poor data comes from tough winter and as spring is coming, situation should improve significantly and we’ve seen this improvement in March data already. Another group suggests that US economy situation stands as it is and winter has no relation to it They thought that it is too early to talk about any improvement. Let’s see what data we will get in March and in the beginning of April.
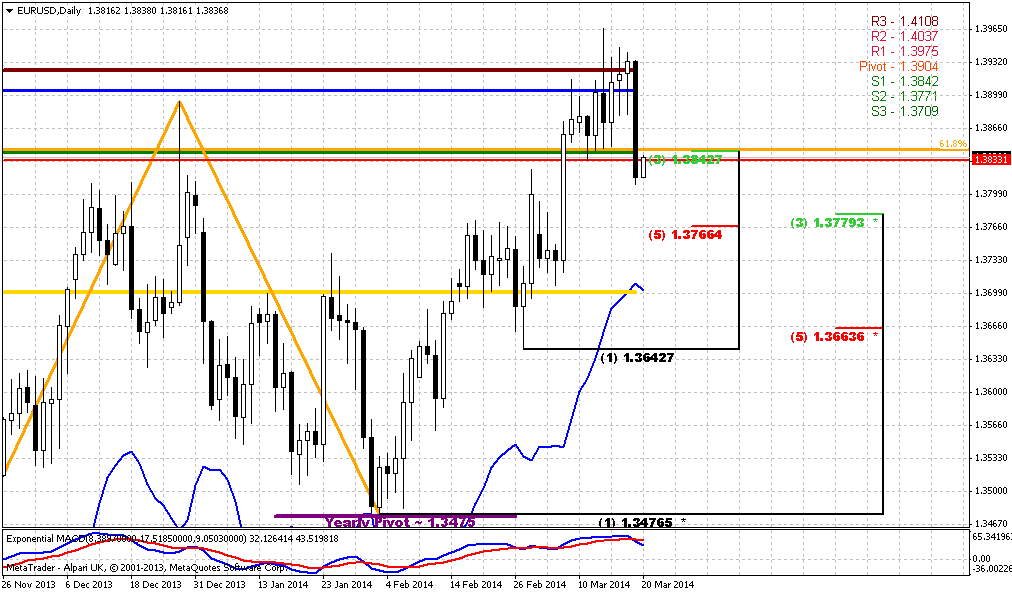
As we’ve noted in our previous EUR researches, YPP will play it’s role sooner or later, and that has happened. Take a look, that upward bounce has started precisely from 1.3475 level. Now the major question stands as follows – whether this upward action is a confirmation of long-term bullish sentiment or just a respect of YPP first touch.
Most important conclusion that we’ve made is based on market mechanics. If we will follow to it, we’ll see that currently market should not show any solid retracement down. Any move of this kind should be treated as market weakness and it will increase probability of reversal down. Take a look that as market has hit minor 0.618 AB-CD extension target right at rock hard resistance – Fib level and Agreement and former yearly PR1, it has shown reasonable bounce down to 1.33. As retracement after 0.618 target already has happened, it is unlogical and unreasonable to see another deep bounce and if it will happen - it will look suspicious. Right now market still stands on the edge here. From one point of view price has failed to break up in 2013, but from another one – it still stands very close to previous highs.
As we’ve suggested in previous research “market is forming flag consolidation right under significant resistance... In most cases this suggests attempt of upper breakout and EUR just accumulates energy for it.” And that has happened – market has passed above recent highs and monthly 5/8 Fib resistance, althuogh it has not passed too far yet.
Second moment – if this was true revresal down from AB-CD 0.618 target market should not return right back up to it and particularly should not form any bullish consolidation right below it. Now we already have got upward breakout. Another sign is that price has held above YPP. This tells that sentiment is still bullish here and currently overall situation on monthly chart has more bullish spirit rather than bearish.
Speaking about monthly targets... If this was real break through resistance, we have two major targets – AB=CD one around 1.44 and Yearly PR1 = 1.4205. During nearest couple of weeks our attention will be stick to weekly chart, mostly due to the pattern that has been formed here.
Weekly
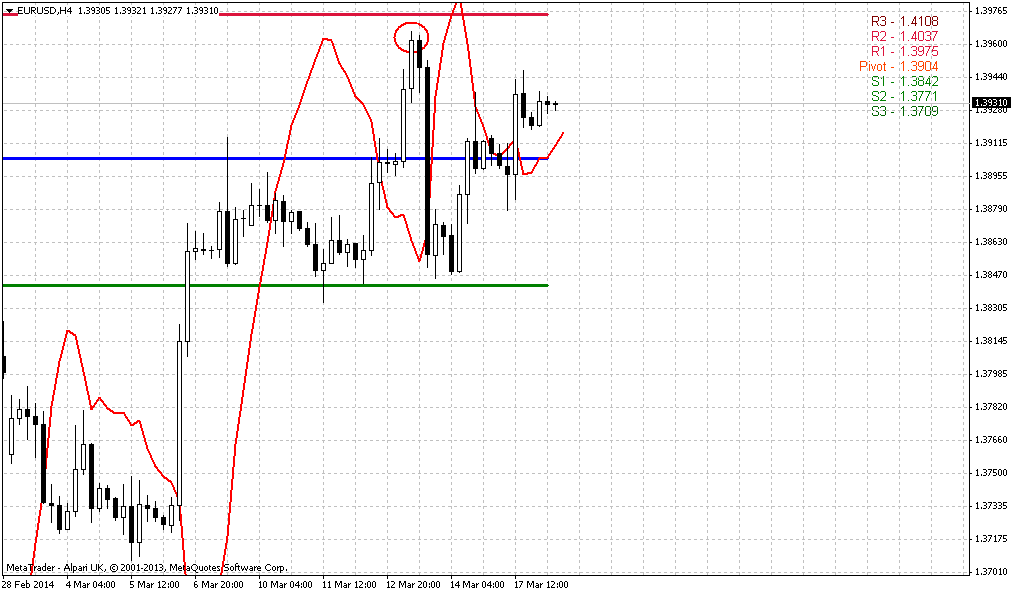
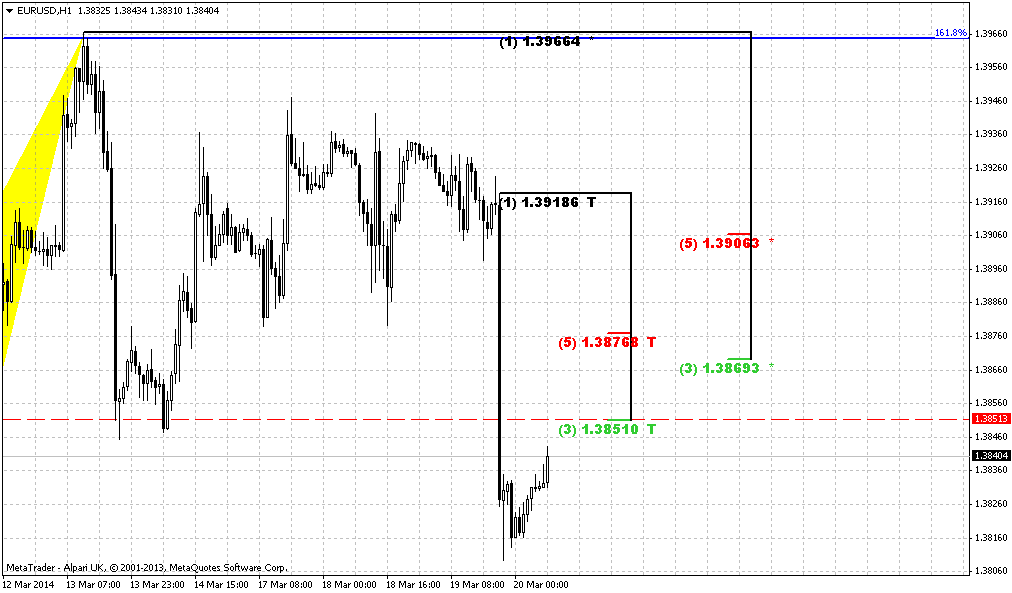
Trend has turned bullish here and on previous week we were focused on nearest butterfly target – 1.27 around 1.3960 area. If we would be precise to the letter, we can say that market has not reached the target for 8 pips, but this is not significant for weekly chart. Probably now we can say that market has accomplished butterfly target and has done it after 6 weeks upward rally.
Although situation on monthly chart looks bullish, market could turn to downward retracement during nearest month. Fundamentally the reason could be – sanctions against Russia that should be announced on Monday. But this will hurt EU as well and this could lead to decline of union currency.
Technically speaking, we have following bearish issues. First is butterfly itself. This is reversal pattern and should trigger at minimum 3/8 retracement down. As action to the 1.27 target was very smooth and gradual, even heavy, hardly market will easily continue move higher right now. Second issue is MPR1. Market has tested it, but MPR1 has held price action. Current AB-CD pattern has reached minor 0.618 target, but CD leg is much flatter than AB and this is the sign of weakness. Thus, some bounce down could happen in nearest future.
Speaking about bearish reversal criteria ideal peformance is to see butterfly completion and then – move below 1.33 lows. In this case we will get reversal swing on weekly chart that could become at least something that could confirm downward ambitions.
Speaking about bullish signs, we can point on some moments. Although we’ve got bearish patterns, say, engulfing, divergence previously, but market does not follow it as usual. Market has bounced up from YPP, moved above MPP and reached MPR1. Now trend has turned bullish again, vanishing potential bearish grabber. That’s being said, although we have some contradictive moments here, I would suggest that bullish signs have more value right now, mostly because they prevent further development of bearish patterns. They are not just opposite patterns that have been formed side-by-side. It looks like most recent bullish signs a kind of vanishing and preventing normal development of earlier bearish patterns. And now we also see upward breakout of flag consolidation.
Speaking about more extended action, if upward continuation will be long term – we need to see move above 1.3980 – butterfly 1.27 target first. In this case next target will be right around 1.43-1.44 – weekly AB-CD, Yearly PR1 and butterfly 1.618.
So, conclusion on weekly time frame stands as follows. Market has reached solid resistance level and the probability of retracement down increases significantly. Nearest level to watch for is 1.3710 – first Fib support and MPP. As market is not overbought it should not show too deep retracement, if it is still bullish. Any move below 1.35 K-support level could lead to bearish reversal confirmation. And our primary task in nearest future is to get signs whether this move just short-term retracement or this is really reversal down.
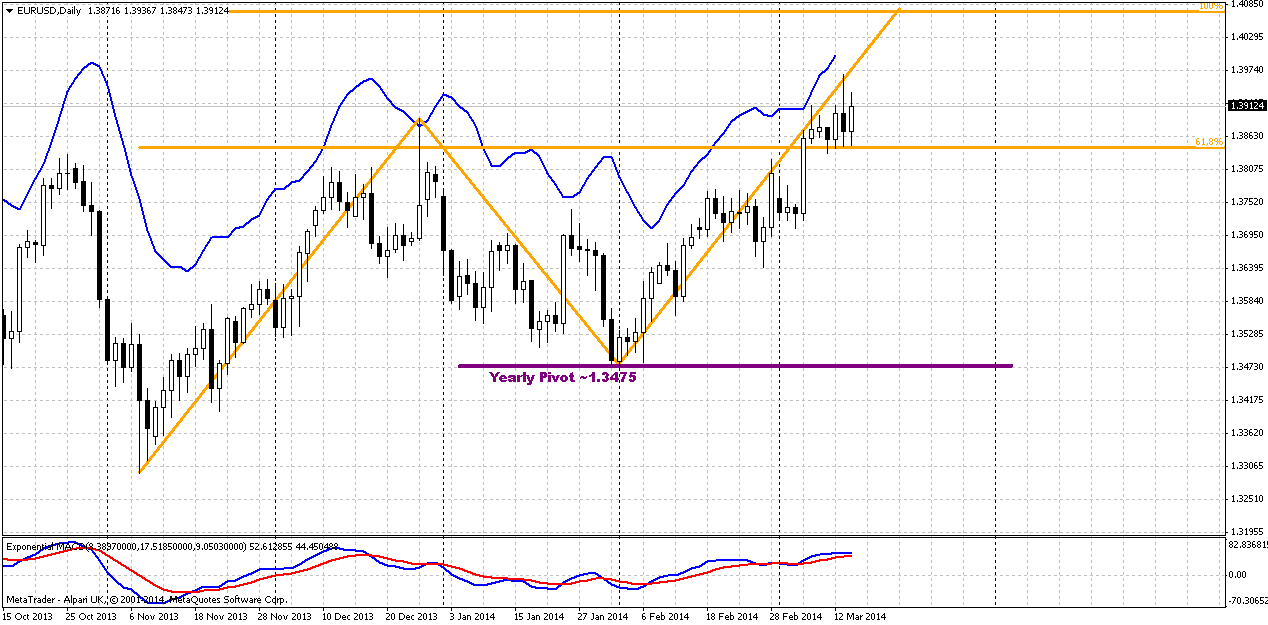
Daily
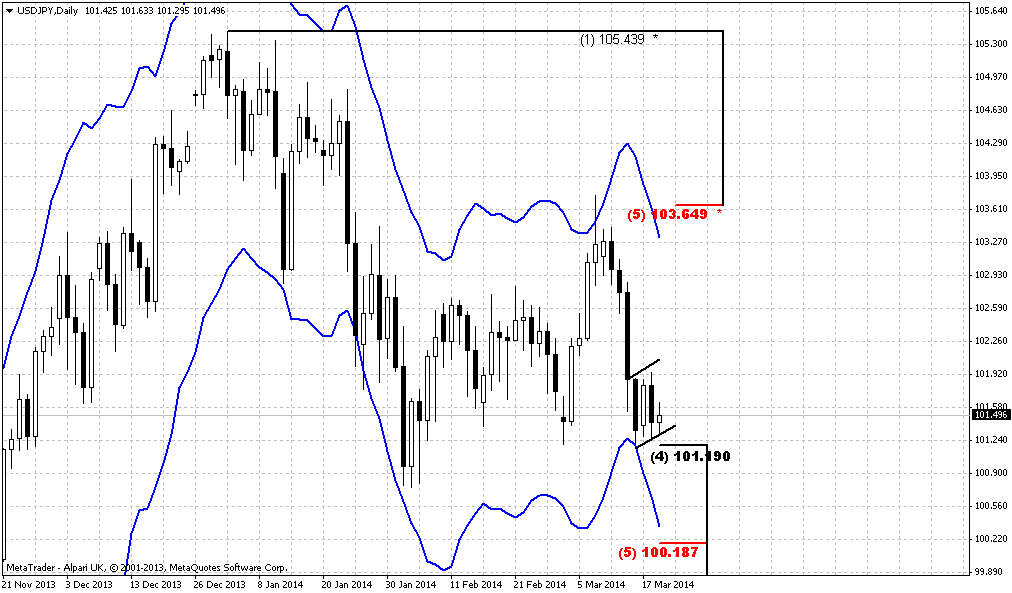
Here we do not see yet any patterns or setup that could confirm starting of retracement down. Even more – we have nicely looking AB=CD pattern and price now stands above 0.618 target. Although we see some barrier and that price feels some resistance during previous week, but quotes stand above previous highs and market does not show solid decline. Trend holds bullish as well here.
Since we’ve noted that market has not quite reached weekly butterfly target (to be point to the letter), may be particularly this moment lets market to show upward action for some time. Anyway –we know that market right now stands at resistance and have to be sensitive and aware of possible reversal patterns somewhere around.
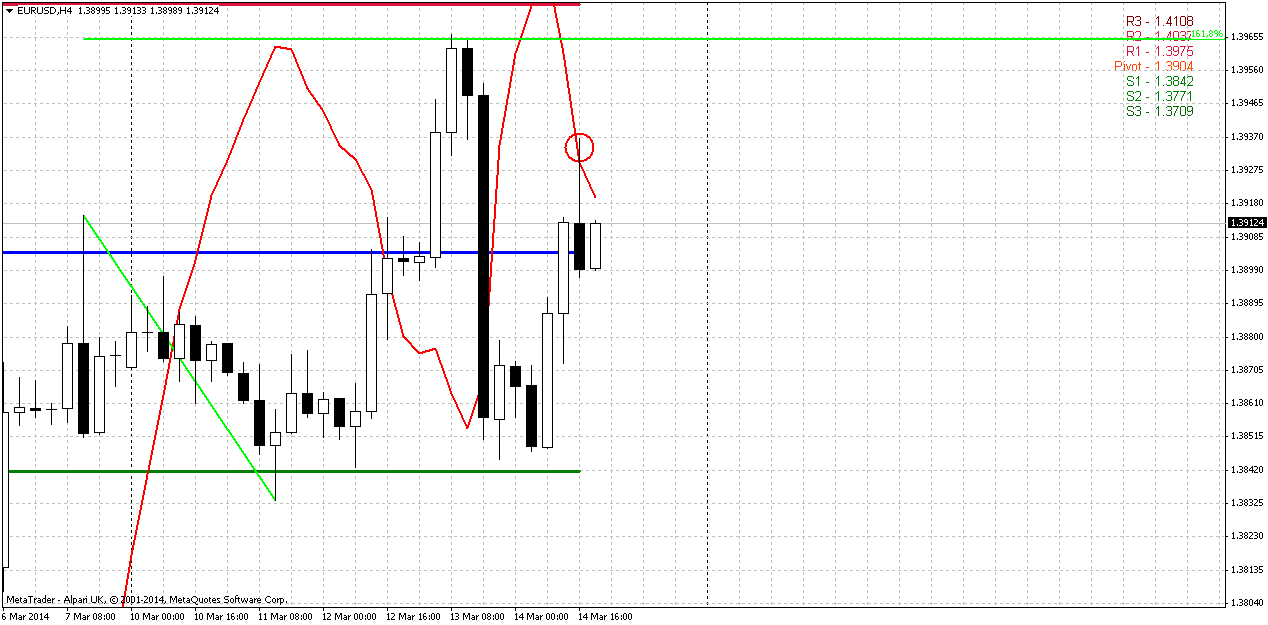
4-hour
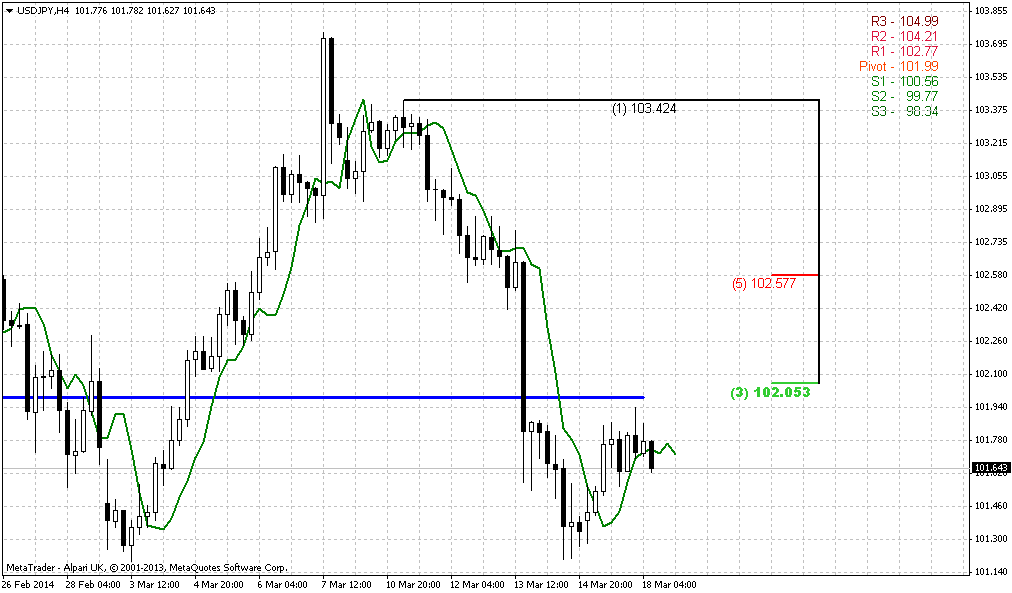
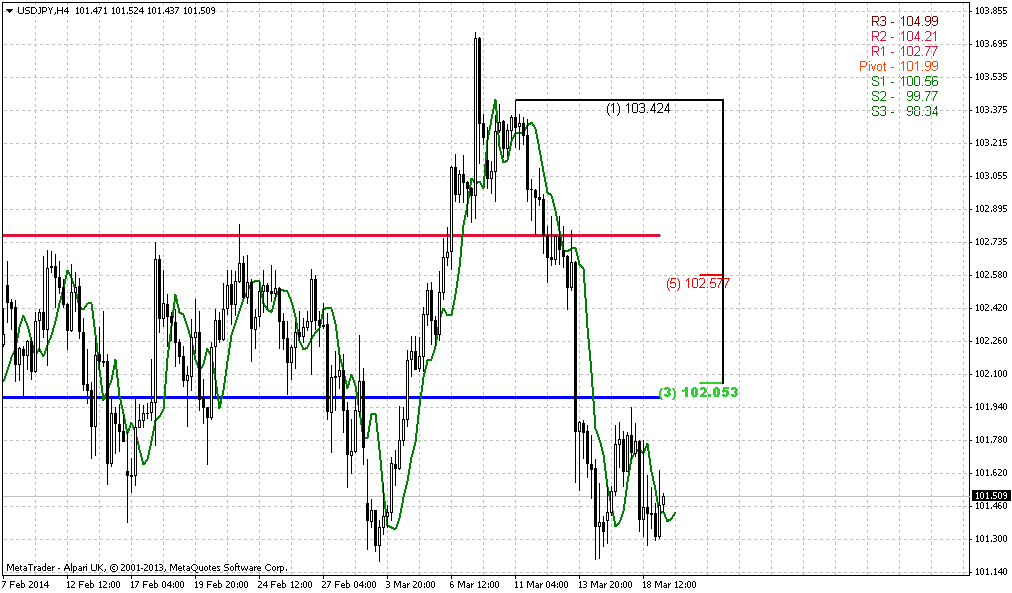
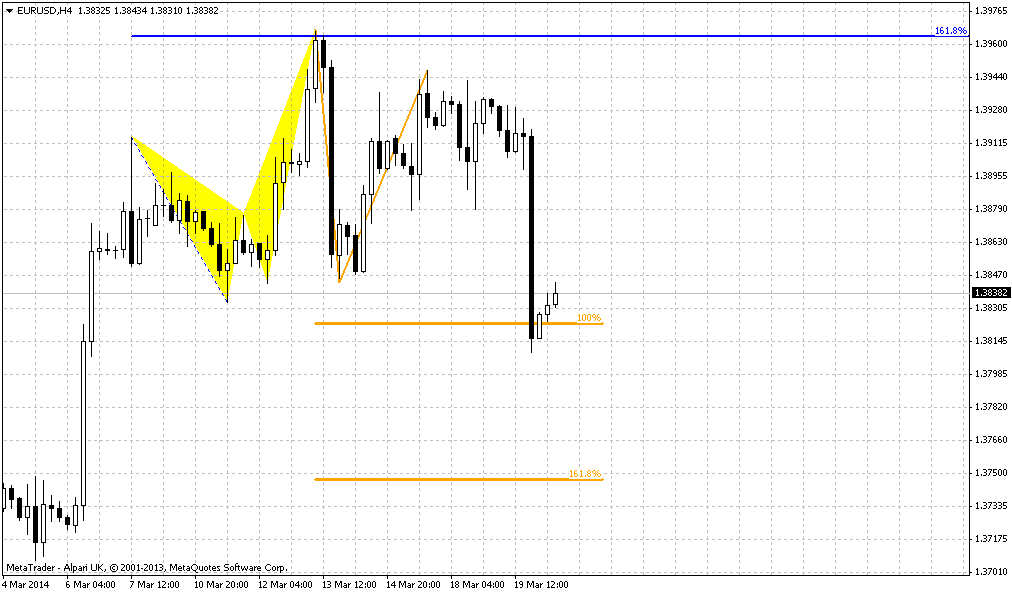
As we’ve not found anything interesting on daily, but here, on 4-hour chart we have something. In general, guys, if you take a look at this time frame – you’ll see that price stands in wide parallel channel. As usuall, lower border carries a lot of importance, since it indicates neccesary level to treat action as downward breakout, right?
But here we have another important level that could inform us about deep retracement a bit earlier than lower border of the channel. This is WPS1. Current situation is unique because WPS1 coincides with the previous highs on daily chart and simultaneously stands as indication of trend breakeven. We know that if price moves through WPS1, it means that new bear trend on the way.
Now we also have bearish stop grabber that has target right around WPS1 – previous lows should be taken out. And we could get H&S pattern here as well, especially taking into consideration recent plunge down. Anything could happen, of cause, but this setup could become a starting point of 1.3710 action.
Conclusion:
On long-term charts price action looks moderately bullish, but right now market has hit significant resistance and completed long-term reversal pattern. Retracement down in nearest 1-2 weeks has very high probability. Our task here is to understand whether it will be just retracement (and bullish context will hold) or we will have to change our mind and start to look south?
On coming week we could get action to 1.3710 if our analysis will be confirmed by price action. For that purpose market should not erase bearish stop grabber that has been formed on 4-hour chart recently.
The technical portion of Sive's analysis owes a great deal to Joe DiNapoli's methods, and uses a number of Joe's proprietary indicators. Please note that Sive's analysis is his own view of the market and is not endorsed by Joe DiNapoli or any related companies.
The yen rose on Friday, poised for its biggest weekly gains in more than a month against the euro and the dollar as traders flocked to it on growing tension in Ukraine and fears about the health of the Chinese economy. The euro was also under pressure since hitting a 2-1/2-year high versus the greenback this week after European Central Bank President Mario Draghi raised concerns about the strength of the euro zone common currency. "I don't think anyone wants to hold any large risky positions going into the weekend," said Shaun Osborne, chief foreign exchange strategist at TD Securities in Toronto. Draghi said on Thursday that the strength of the euro was increasingly relevant to ECB's assessment of price stability - its central goal - because of the impact on inflation, which has strayed well below the official target. A strong currency reduces price pressure since it pares costs on imported goods and services. "We are finding good support on dips in the euro," TD's Osbourne said.
The euro's decline this week erased much of the gains made after the ECB held back from easing policy last Thursday despite projecting persistently low inflation. Draghi's comment then that the euro's strength had very little impact on imported inflation had helped it rally broadly. Traders said the euro is likely to keep drawing support from the ECB's decision to keep policy unchanged, higher money market rates, and the euro zone's large current account surplus.
NERVOUSNESS STOKES YEN DEMAND
Traders have favored the yen in the past 24 hours as fears about a war in Ukraine's Crimea peninsula and jitters over the Chinese economy in the wake of that country's first private bond default last week. Russia launched new military exercises near its border with Ukraine on Thursday, showing no sign of backing down on plans to annex its neighbour's Crimea region. U.S. Secretary of State John Kerry said serious steps would be imposed by the United States and Europe if the referendum on Crimea joining Russia takes place on Sunday as planned. After six hours of talks with Russian Foreign Minister Sergei Lavrov on Friday, Kerry said the Kremlin's next steps would depend on a final decision that Russian President Vladimir Putin would take after the referendum. Meanwhile, a record drop in U.S. Treasuries holdings by foreign governments with the Federal Reserve led some to speculate that Russia has been reducing its dollar reserves ahead of possible sanctions from the West.
"The risks to global growth both from China as well as from the Crimean situation are supporting yen," said Manuel Oliveri, FX strategist at Credit Agricole in London. Reflecting some of the nervousness, one-week implied volatilities in the dollar/yen pair - a gauge of how sharp currency swings will be - rose to 8.925 percent from a low of around 7.20 percent on Thursday. "In the near term more risk-averse trading conditions may continue to encourage a stronger yen," Lee Hardman, a currency analyst at Bank of Tokyo Mitsubishi, wrote in a note. "The Chinese economy appears to have downshifted to a slower pace of growth in the first quarter, as evident in the weak economic reports from February." Chinese Premier Li Keqiang warned on Thursday that the economy faced "severe challenges" in 2014 while expectations of more debt defaults kept alive worries about the state of its financial sector.
Technical
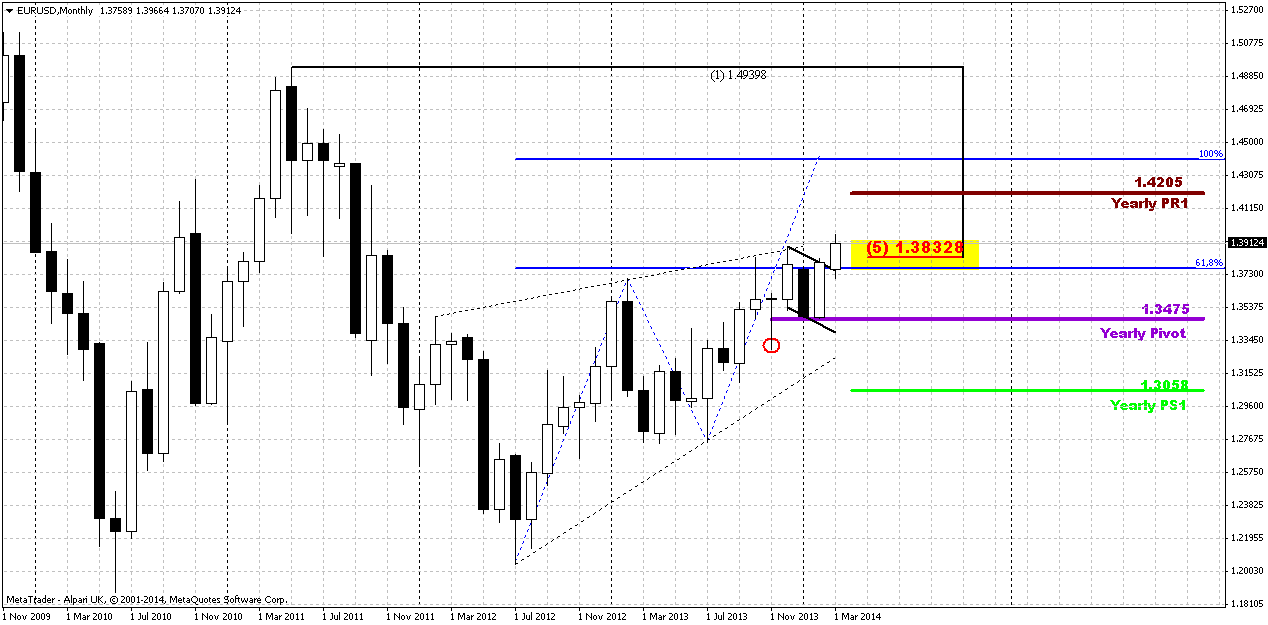
Well, guys, right now is not very suitable moment to prepare any technical forecasts and this could be a thankless job, as we’ve said on Friday, mostly due geopolitical tensions. Still let’s make our technical job, may be it will appear to be not as useless as we think now.Trend holds bullish on monthly time frame and EUR looks more bullish rather than bearish on monthly chart. Recent price action confirms our suggestion that until market stands above 1.33 we can’t tell that EUR has turned down. So, for us 1.33 is a crucial level. Currently investors have twofold thoughts on fundamental data. One group tells that recent poor data comes from tough winter and as spring is coming, situation should improve significantly and we’ve seen this improvement in March data already. Another group suggests that US economy situation stands as it is and winter has no relation to it They thought that it is too early to talk about any improvement. Let’s see what data we will get in March and in the beginning of April.
As we’ve noted in our previous EUR researches, YPP will play it’s role sooner or later, and that has happened. Take a look, that upward bounce has started precisely from 1.3475 level. Now the major question stands as follows – whether this upward action is a confirmation of long-term bullish sentiment or just a respect of YPP first touch.
Most important conclusion that we’ve made is based on market mechanics. If we will follow to it, we’ll see that currently market should not show any solid retracement down. Any move of this kind should be treated as market weakness and it will increase probability of reversal down. Take a look that as market has hit minor 0.618 AB-CD extension target right at rock hard resistance – Fib level and Agreement and former yearly PR1, it has shown reasonable bounce down to 1.33. As retracement after 0.618 target already has happened, it is unlogical and unreasonable to see another deep bounce and if it will happen - it will look suspicious. Right now market still stands on the edge here. From one point of view price has failed to break up in 2013, but from another one – it still stands very close to previous highs.
As we’ve suggested in previous research “market is forming flag consolidation right under significant resistance... In most cases this suggests attempt of upper breakout and EUR just accumulates energy for it.” And that has happened – market has passed above recent highs and monthly 5/8 Fib resistance, althuogh it has not passed too far yet.
Second moment – if this was true revresal down from AB-CD 0.618 target market should not return right back up to it and particularly should not form any bullish consolidation right below it. Now we already have got upward breakout. Another sign is that price has held above YPP. This tells that sentiment is still bullish here and currently overall situation on monthly chart has more bullish spirit rather than bearish.
Speaking about monthly targets... If this was real break through resistance, we have two major targets – AB=CD one around 1.44 and Yearly PR1 = 1.4205. During nearest couple of weeks our attention will be stick to weekly chart, mostly due to the pattern that has been formed here.
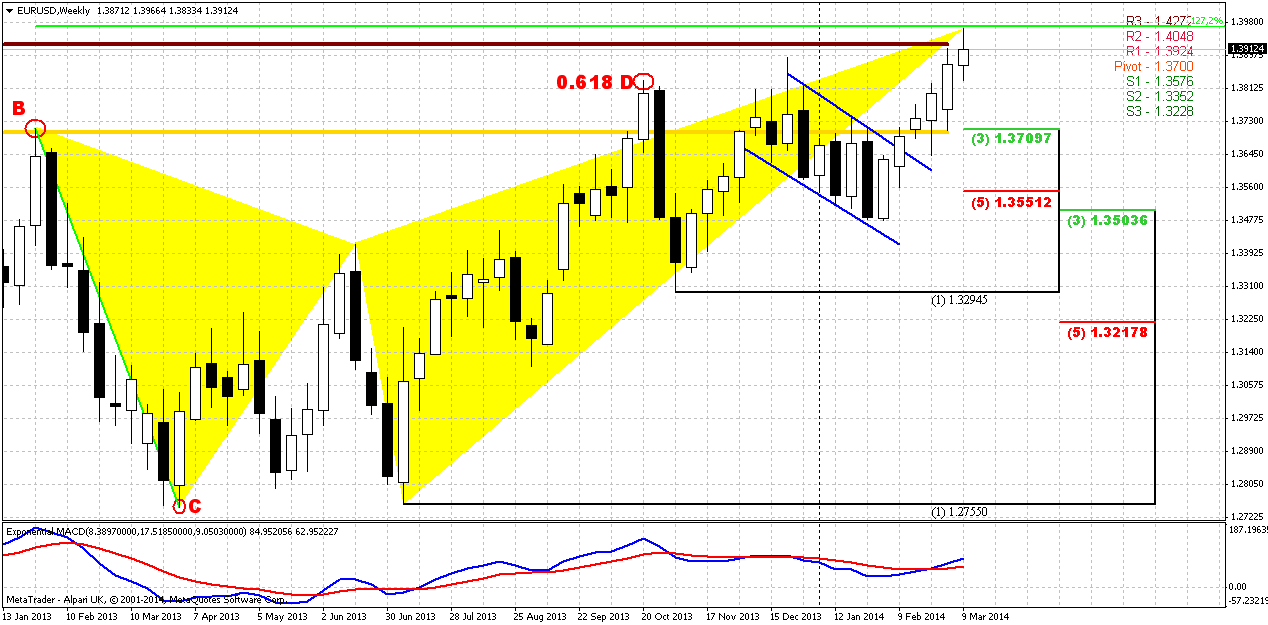
Weekly
Trend has turned bullish here and on previous week we were focused on nearest butterfly target – 1.27 around 1.3960 area. If we would be precise to the letter, we can say that market has not reached the target for 8 pips, but this is not significant for weekly chart. Probably now we can say that market has accomplished butterfly target and has done it after 6 weeks upward rally.
Although situation on monthly chart looks bullish, market could turn to downward retracement during nearest month. Fundamentally the reason could be – sanctions against Russia that should be announced on Monday. But this will hurt EU as well and this could lead to decline of union currency.
Technically speaking, we have following bearish issues. First is butterfly itself. This is reversal pattern and should trigger at minimum 3/8 retracement down. As action to the 1.27 target was very smooth and gradual, even heavy, hardly market will easily continue move higher right now. Second issue is MPR1. Market has tested it, but MPR1 has held price action. Current AB-CD pattern has reached minor 0.618 target, but CD leg is much flatter than AB and this is the sign of weakness. Thus, some bounce down could happen in nearest future.
Speaking about bearish reversal criteria ideal peformance is to see butterfly completion and then – move below 1.33 lows. In this case we will get reversal swing on weekly chart that could become at least something that could confirm downward ambitions.
Speaking about bullish signs, we can point on some moments. Although we’ve got bearish patterns, say, engulfing, divergence previously, but market does not follow it as usual. Market has bounced up from YPP, moved above MPP and reached MPR1. Now trend has turned bullish again, vanishing potential bearish grabber. That’s being said, although we have some contradictive moments here, I would suggest that bullish signs have more value right now, mostly because they prevent further development of bearish patterns. They are not just opposite patterns that have been formed side-by-side. It looks like most recent bullish signs a kind of vanishing and preventing normal development of earlier bearish patterns. And now we also see upward breakout of flag consolidation.
Speaking about more extended action, if upward continuation will be long term – we need to see move above 1.3980 – butterfly 1.27 target first. In this case next target will be right around 1.43-1.44 – weekly AB-CD, Yearly PR1 and butterfly 1.618.
So, conclusion on weekly time frame stands as follows. Market has reached solid resistance level and the probability of retracement down increases significantly. Nearest level to watch for is 1.3710 – first Fib support and MPP. As market is not overbought it should not show too deep retracement, if it is still bullish. Any move below 1.35 K-support level could lead to bearish reversal confirmation. And our primary task in nearest future is to get signs whether this move just short-term retracement or this is really reversal down.
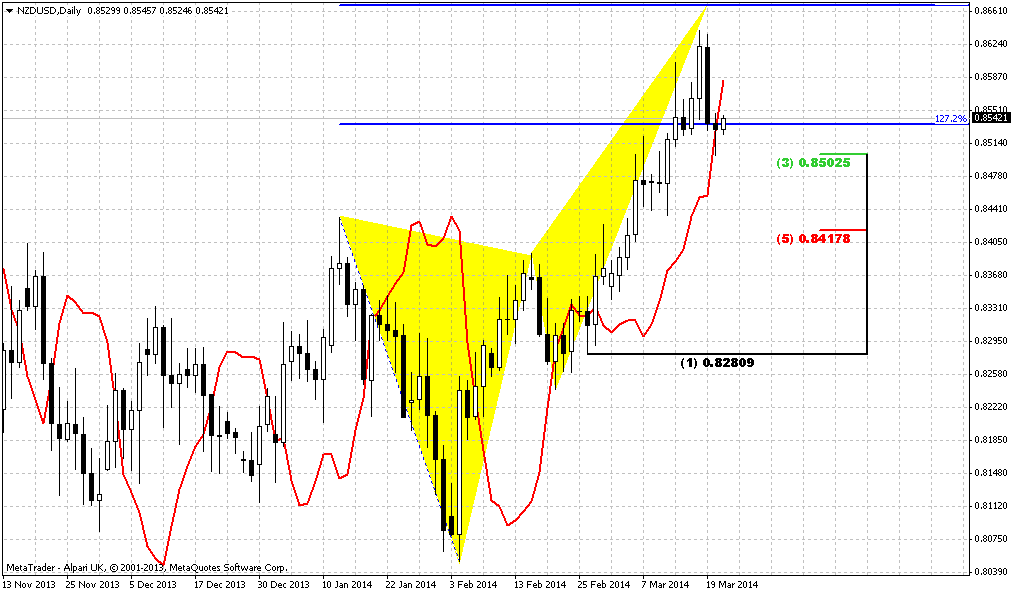
Daily
Here we do not see yet any patterns or setup that could confirm starting of retracement down. Even more – we have nicely looking AB=CD pattern and price now stands above 0.618 target. Although we see some barrier and that price feels some resistance during previous week, but quotes stand above previous highs and market does not show solid decline. Trend holds bullish as well here.
Since we’ve noted that market has not quite reached weekly butterfly target (to be point to the letter), may be particularly this moment lets market to show upward action for some time. Anyway –we know that market right now stands at resistance and have to be sensitive and aware of possible reversal patterns somewhere around.
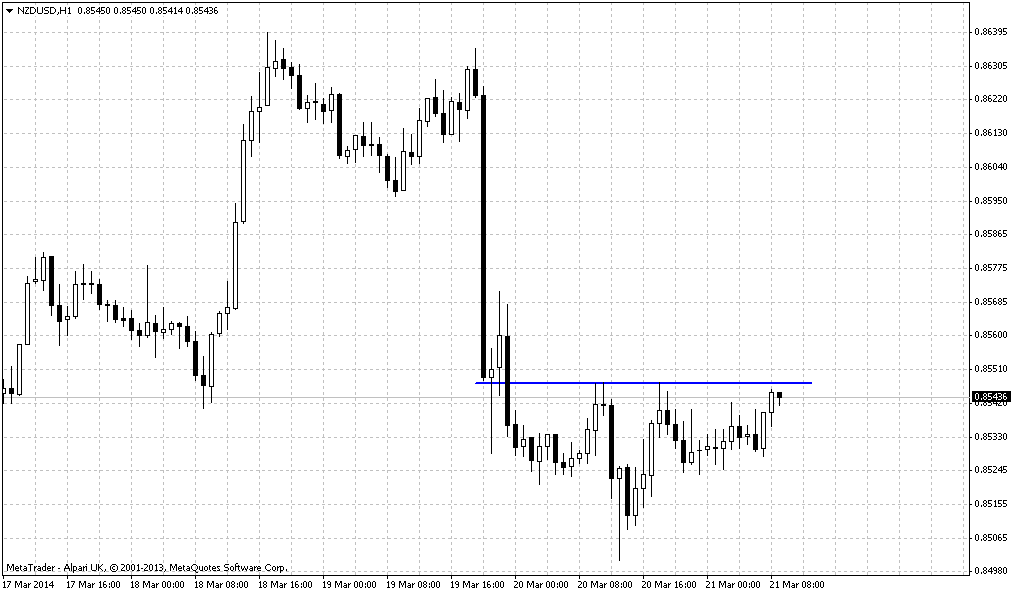
4-hour
As we’ve not found anything interesting on daily, but here, on 4-hour chart we have something. In general, guys, if you take a look at this time frame – you’ll see that price stands in wide parallel channel. As usuall, lower border carries a lot of importance, since it indicates neccesary level to treat action as downward breakout, right?
But here we have another important level that could inform us about deep retracement a bit earlier than lower border of the channel. This is WPS1. Current situation is unique because WPS1 coincides with the previous highs on daily chart and simultaneously stands as indication of trend breakeven. We know that if price moves through WPS1, it means that new bear trend on the way.
Now we also have bearish stop grabber that has target right around WPS1 – previous lows should be taken out. And we could get H&S pattern here as well, especially taking into consideration recent plunge down. Anything could happen, of cause, but this setup could become a starting point of 1.3710 action.
Conclusion:
On long-term charts price action looks moderately bullish, but right now market has hit significant resistance and completed long-term reversal pattern. Retracement down in nearest 1-2 weeks has very high probability. Our task here is to understand whether it will be just retracement (and bullish context will hold) or we will have to change our mind and start to look south?
On coming week we could get action to 1.3710 if our analysis will be confirmed by price action. For that purpose market should not erase bearish stop grabber that has been formed on 4-hour chart recently.
The technical portion of Sive's analysis owes a great deal to Joe DiNapoli's methods, and uses a number of Joe's proprietary indicators. Please note that Sive's analysis is his own view of the market and is not endorsed by Joe DiNapoli or any related companies.