Sive Morten
Special Consultant to the FPA
- Messages
- 18,690
Monthly
Currency traders briefly boosted the dollar on Friday on news of surprisingly strong hiring that took the U.S. unemployment rate in April to a 5-1/2-year low before surrendering the gains on data signalling many Americans were exiting the labor force. The dollar index, a composite of six currency pairs, was down 0.01 percent in late New York trade after rising about 0.40 percent on U.S. labor reports showing a big drop in the jobless rate. But the monthly jobs reports also showed a drop in the labor participation rate, a reflection of increasing numbers of Americans ending job hunting, and flat wage increases. "Initially, it looked to people that the Federal Reserve might speed up the normalization of interest rates but as they looked at details (of the labor reports) they changed their minds," said Joseph Trevisani, chief market strategist at WorldWideMarkets Online in Woodcliff Lake, New Jersey. The dollar will face headwinds in currency markets until the Fed clearly adopts a program of raising rates, Trevisani said.
The U.S. government data, including a nonfarm payrolls surge of 288,000 far above Wall Street forecasts of 210,000, bolstered optimism about the U.S. economy for many. "This keeps the Fed on track for tapering and for the first interest rate hikes in 2015," said Anthony Valeri, investment strategist at LPL Financial in San Diego.
Technical
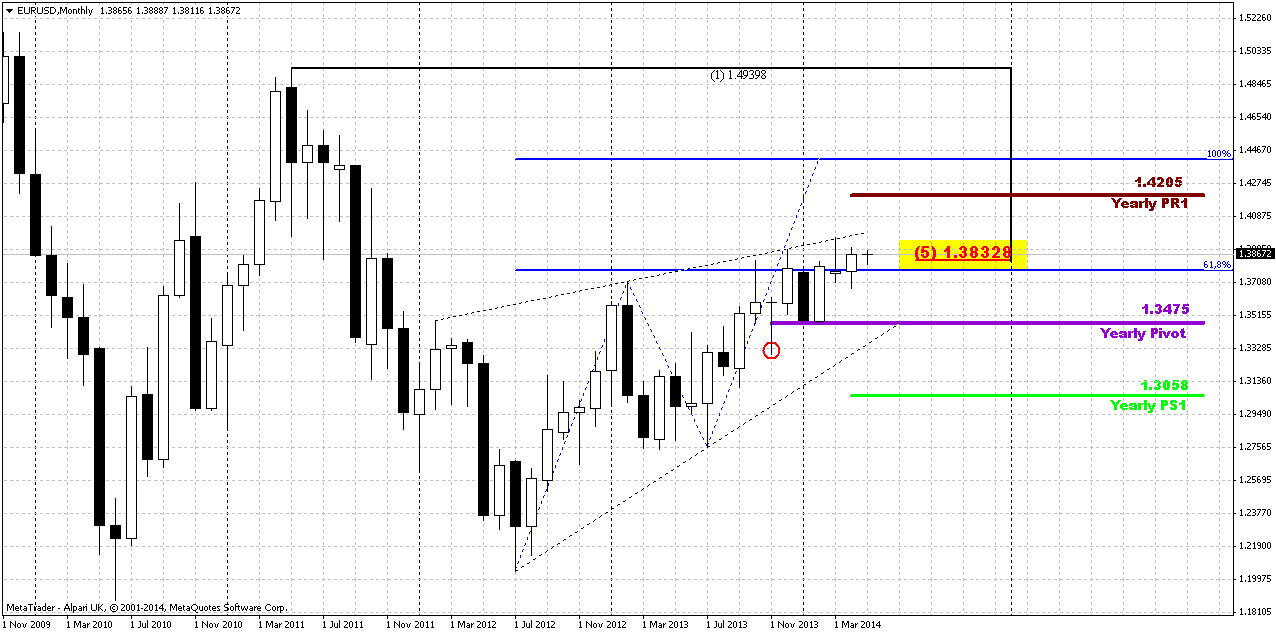
Although April was upward month, but overall action mostly should be classified as “inside” one to March range. Almost whole April price has spent in the same range.
In general recent price action is too shy to let us speak about any drastical changes in sentiment. To get sush issue, we need to see some breakout either to upside or to the downside. Our major concern here stands around breakout moment of 1.3830 Fib resistance and Agreement. Step by step, but in recent 6 months we can recognize some shy upside action. It looks like market is pressing up but still has not enough power for fast breakout.
In fact market stands in tight range since 2014. Thus, 1.33-1.3850 is an area of “indecision”. While market stands inside of it we can talk about neither upward breakout nor downward reversal. At least, reversal identification could be done with yearly pivot – if market will move below it, this could be early sign of changing sentiment. But, as you can see, nothing among this issues have happened yet. The same has happened on previous week. Only recently we’ve disccused, as it was seemed, downward bounce out from 1.3850 level. But today we see that price has returned right back up to it.
Returning to discussion of Yearly Pivot - we’ve noted that upward bounce has started precisely from 1.3475 level. Now the major question stands as follows – whether this upward action is a confirmation of long-term bullish sentiment or just a respect of YPP first touch. Following the chart we see very useful combination for us – YPP stands very close to 1.33 – our invalidation point. And if market will move below YPP this will become bearish moment by itself.
Speaking about upward continuation, market mechanics does not allow price to show any deep retracement any more. Any move of this kind should be treated as market weakness and it will increase probability of reversal down. Take a look that as market has hit minor 0.618 AB-CD extension target right at former rock hard resistance – Fib level and Agreement and former yearly PR1, it has shown reasonable bounce down to 1.33. As retracement after 0.618 target already has happened, it is unlogical and unreasonable to see another deep bounce and if it will happen - it will look suspicious.
So, speaking about monthly upside targets... If we will get finally real break through resistance, we have two major targets – AB=CD one around 1.44 and Yearly PR1 = 1.4205.
Thus, here we can make following conclusion – nothing drastical yet, market still coiling near resistance. Recent action has some upside direction, but it is rather blur. As market is challenging 1.3850 for the third time right now, let’s see what result of this testing will be...
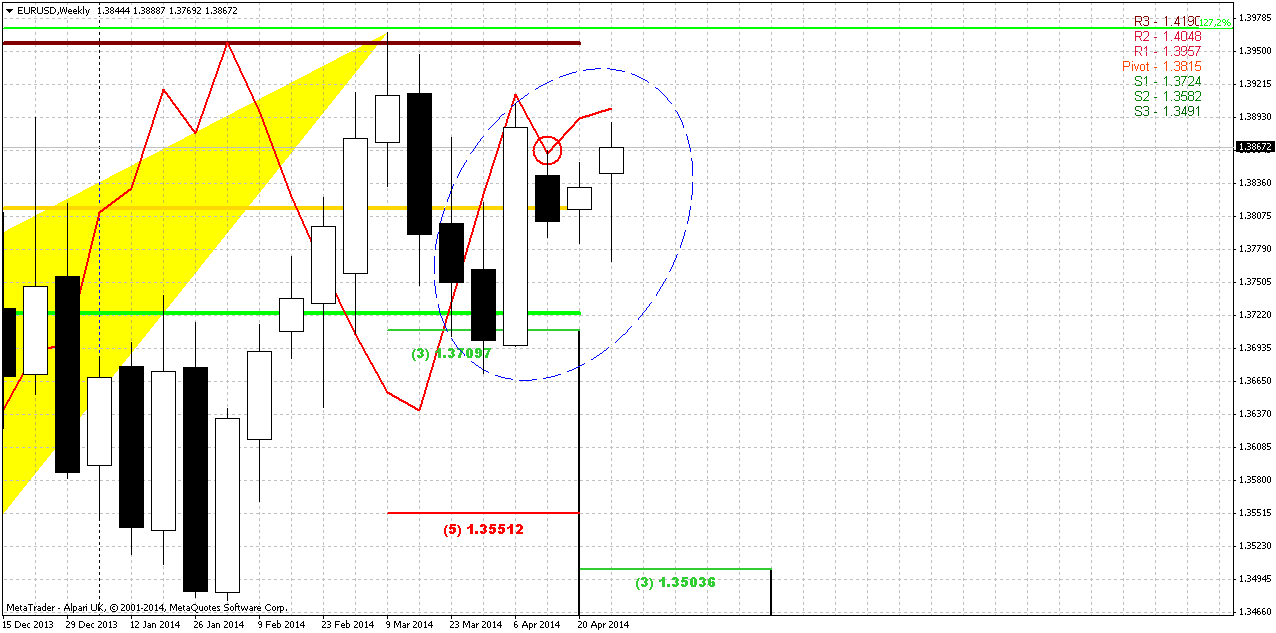
Weekly
Currently, guys, we have very significant price action on weekly chart that left very small chances on downward action. Butterfly “sell” has not led to corresponding retracement to 1.35 weekly 3/8 Fib support. Usually this moment could indicate butterfly’s failure, but since we have just 1.27 pattern – failure automatically could mean continuation to next 1.618 target. And this is 1.43 area... Still this is a bit brave suggestion and too extended view. Other signs include action around as April as May pivot points. EUR holds above both of them. Thus, price has tested May PP yesterday and has jumped up out of it. Third moment is a failure of bearish grabber. Again, yesterday price has closed above its high and this is means failure. And finally, major pattern that we have currently is bullish dynamic pressure. Take a look at trend by MACD (it’s bearish) and price action – it’s bullish. Despite trend direction market shows upward action, strongly holds as above MPP as above WPP. Pressure suggests at least taking out of recent highs around 1.3966 area, MPR1 and former 1.27 butterfly target.
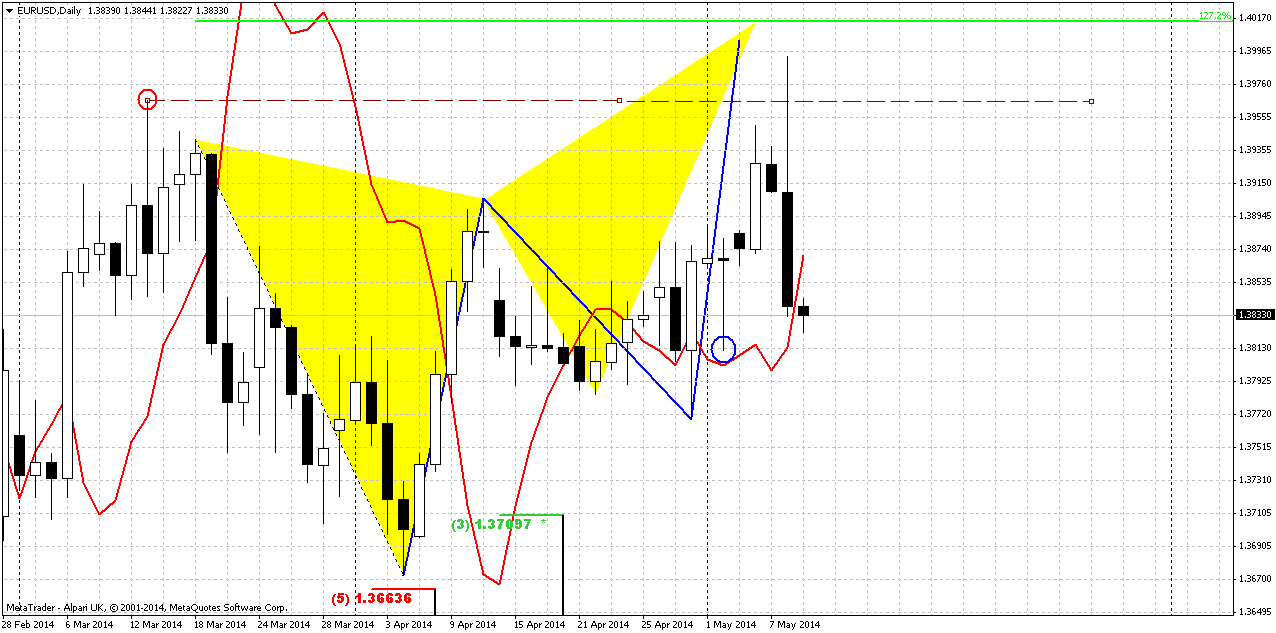
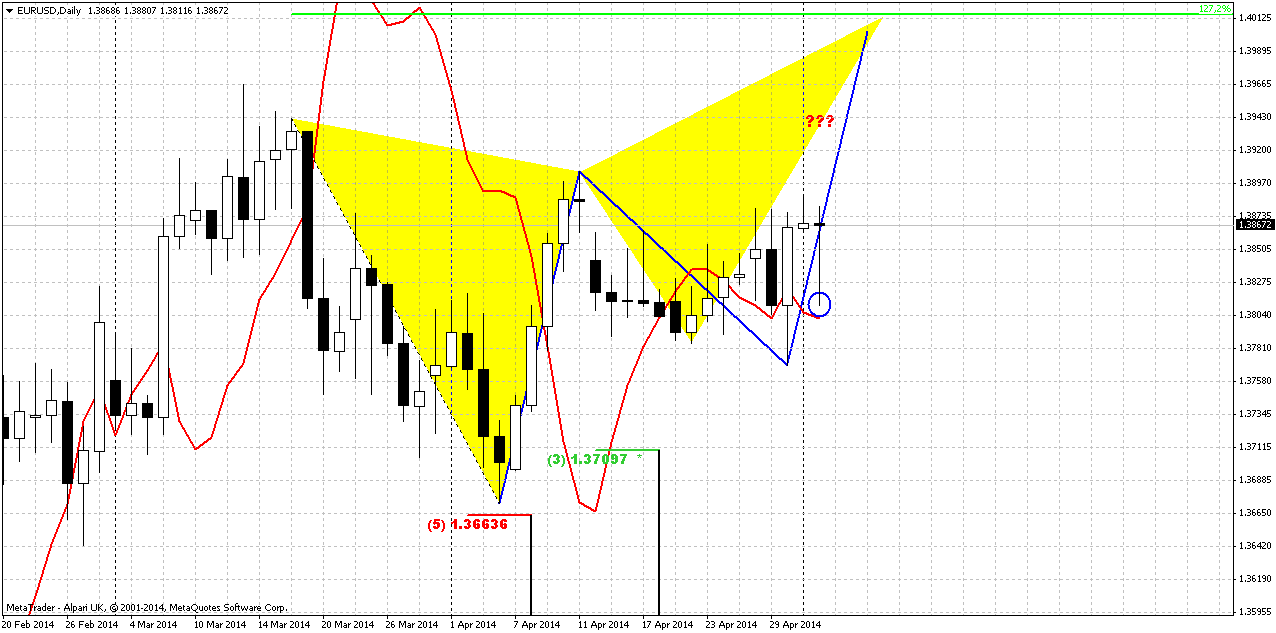
Daily
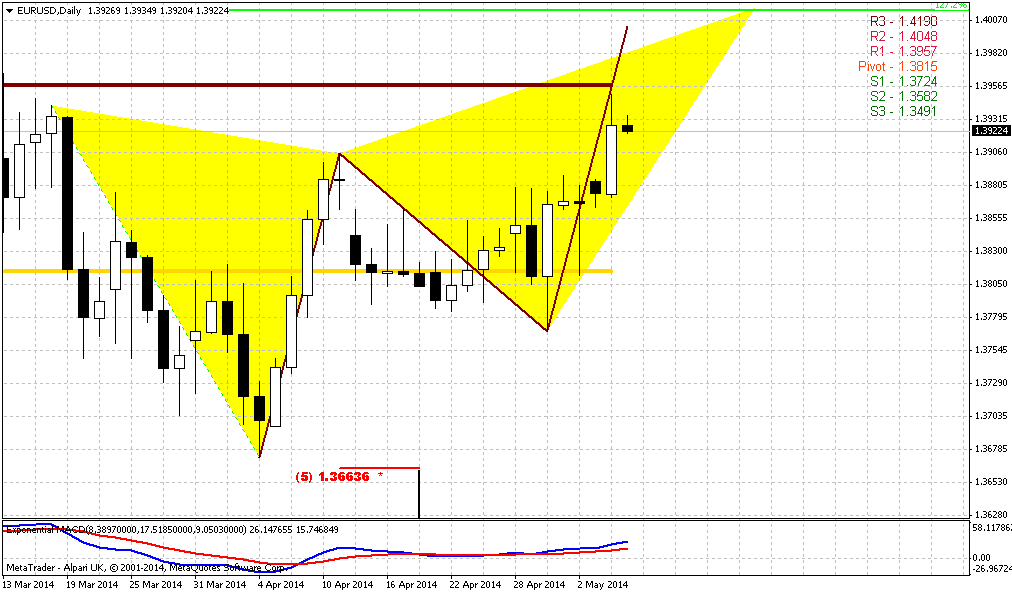
Trend here is bullish and market has not broken our bullish view yet. Yesterday we’ve said that it is better to move stops to breakeven around 1.3770-1.3780 – our entry point on Thursday. But even positive NFP release was not able to hold EUR at the bottom of Friday trading session and price has returned right back up. Precisely speaking, EUR has bounced up right from WPP and erased all USD appreciation due NFP numbers. This fact gives us hint on possible upward continuation on coming week. As a target we still use 1.40 area – 1.27 extension of Butterfly and inner AB=CD target. That is also MPR1=1.3955.
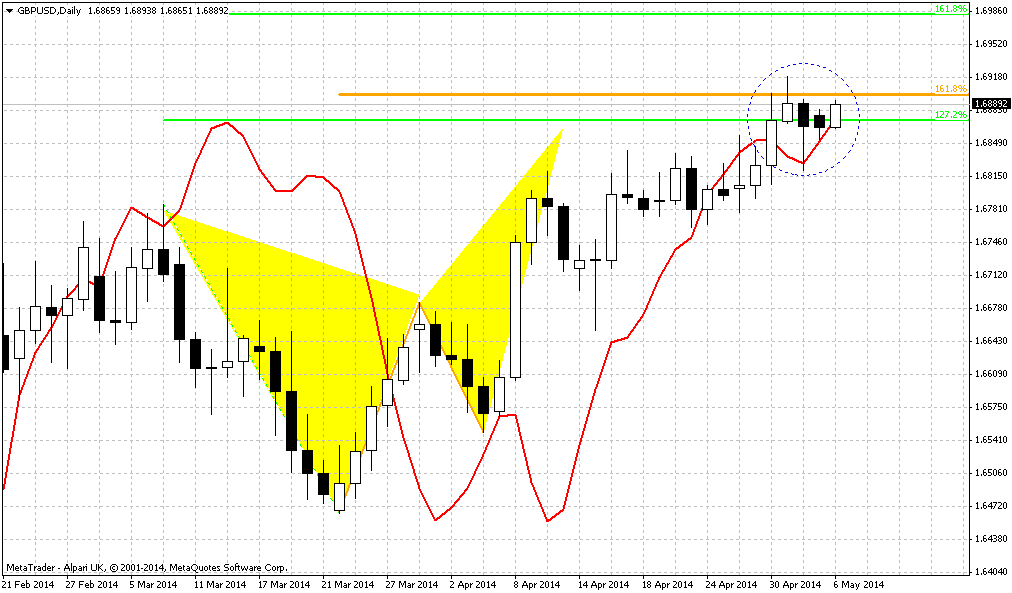
Besides, If you will take a look at GBP, CHF and weekly NZD – you will find confirmation of this possible upward action. Thus, daily GBP shows bullish grabber, USD/CHF shows bearish grabber (at the same point as EUR – marked by blue circle) accompanied by butterfly “buy” pattern, while weekly NZD shows bullish grabber as well. All of them hint on further dollar weakness on coming week. This gives us some confidence on further upward potential on EUR currency on coming week.
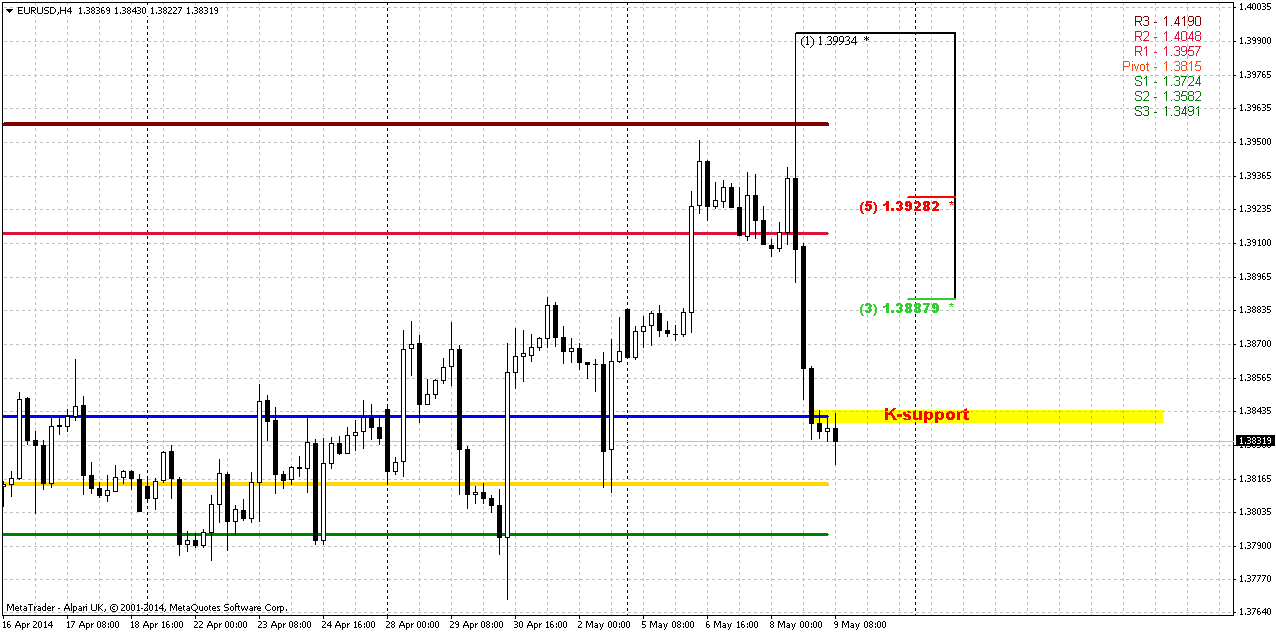
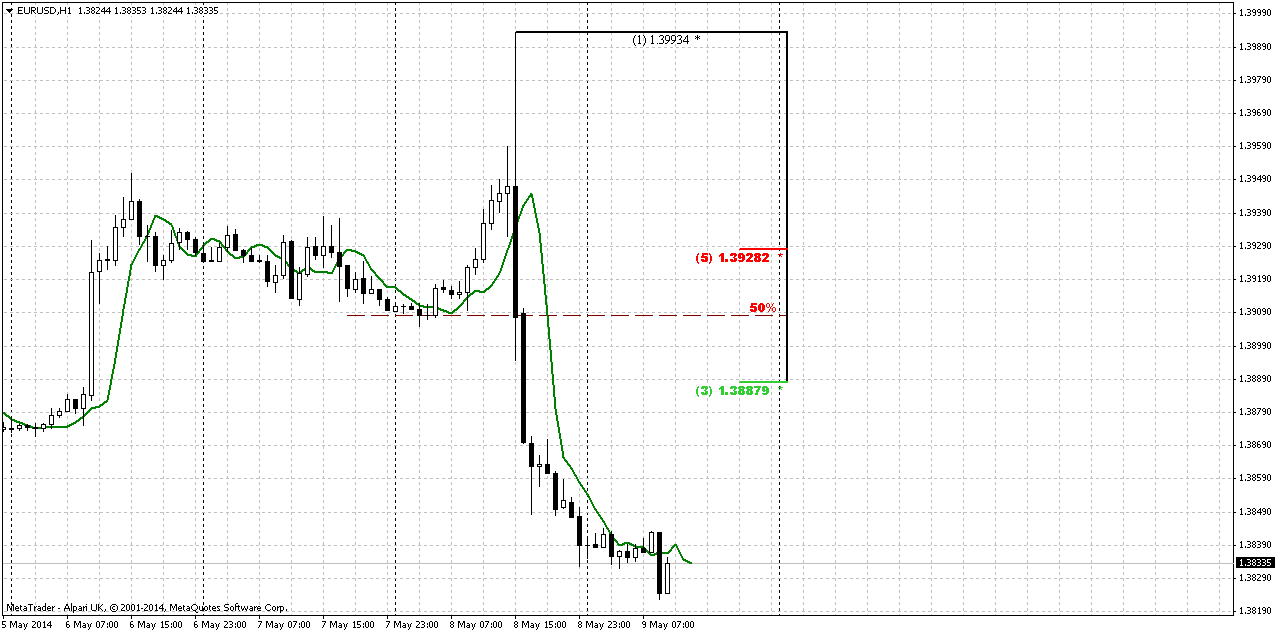
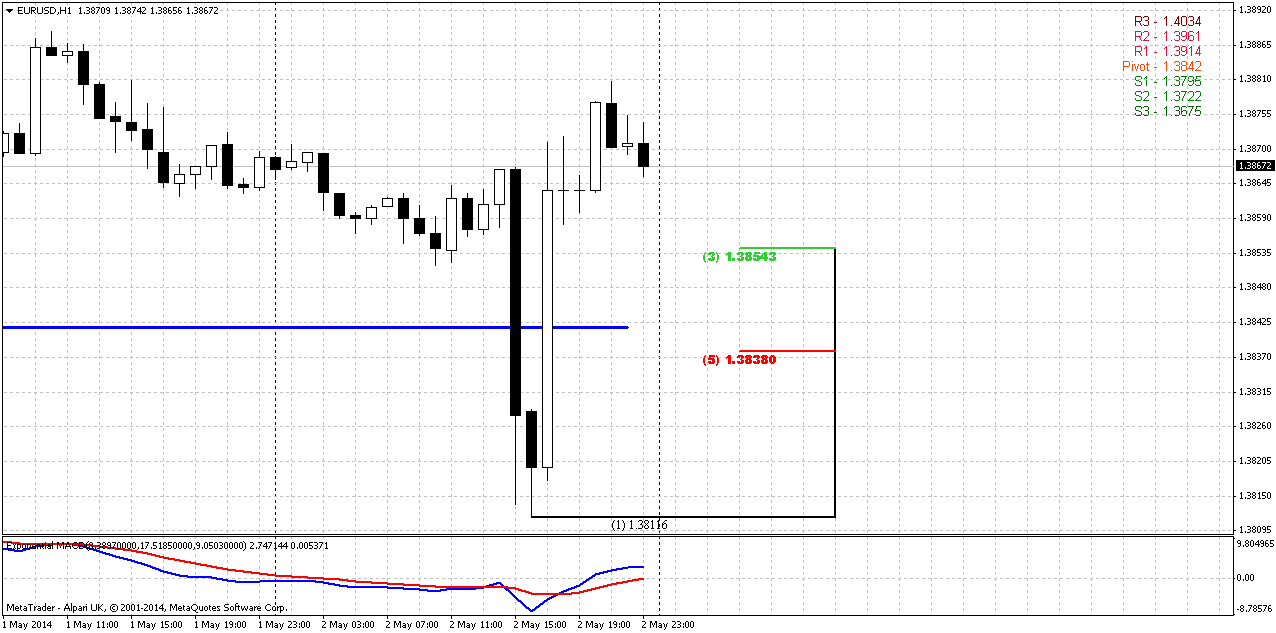
1-hour
Trend is bullish here. For us mostly interesting hourly chart but not a 4-hour, because we’re mostly interesting in recent swing up for searching of entry point. Since price has not created new high after Thursday’s top – 4-hour chart can’t give us necesary Fib levels, but hourly chart can. Thus, major level to watch for is a combination of 5/8 Fib support and WPP – 1.3840 area. If market has real intention to move higher and bullish potential – it probably will hold above this area. If not, then we, probably, will have to monitor situation for a while again to undertsand what is goin’ on...
Conclusion:
While price stands in 1.33-1.38 area we can’t speak either on upward or downward breakout. Market continues to coiling inside of this range and in recent time step by step, heavy but market shows some climbing - a kind of market is breaking and struggling against swamp resistance.
In short-term perspective EUR shows bullish signs – standing above MPP and WPP, erasing of bearish pattern and shy bearish reaction on excellent NFP data. These moments point on possible upward continuation as we’ve suggested on previous week. Thus, we could keep long positions that already are protected by breakeven stops. For those, who add more or would like to step in long trade – take a look on 1.3840 area. But if market will pass through it down – don’t take long position. If EUR is really bullish – it should not show too deep retracement right now, since daily 50% retracement already has happened but price has not reached yet any significant objective point to trigger any solid retracement.
The technical portion of Sive's analysis owes a great deal to Joe DiNapoli's methods, and uses a number of Joe's proprietary indicators. Please note that Sive's analysis is his own view of the market and is not endorsed by Joe DiNapoli or any related companies.
Currency traders briefly boosted the dollar on Friday on news of surprisingly strong hiring that took the U.S. unemployment rate in April to a 5-1/2-year low before surrendering the gains on data signalling many Americans were exiting the labor force. The dollar index, a composite of six currency pairs, was down 0.01 percent in late New York trade after rising about 0.40 percent on U.S. labor reports showing a big drop in the jobless rate. But the monthly jobs reports also showed a drop in the labor participation rate, a reflection of increasing numbers of Americans ending job hunting, and flat wage increases. "Initially, it looked to people that the Federal Reserve might speed up the normalization of interest rates but as they looked at details (of the labor reports) they changed their minds," said Joseph Trevisani, chief market strategist at WorldWideMarkets Online in Woodcliff Lake, New Jersey. The dollar will face headwinds in currency markets until the Fed clearly adopts a program of raising rates, Trevisani said.
The U.S. government data, including a nonfarm payrolls surge of 288,000 far above Wall Street forecasts of 210,000, bolstered optimism about the U.S. economy for many. "This keeps the Fed on track for tapering and for the first interest rate hikes in 2015," said Anthony Valeri, investment strategist at LPL Financial in San Diego.
Technical
Although April was upward month, but overall action mostly should be classified as “inside” one to March range. Almost whole April price has spent in the same range.
In general recent price action is too shy to let us speak about any drastical changes in sentiment. To get sush issue, we need to see some breakout either to upside or to the downside. Our major concern here stands around breakout moment of 1.3830 Fib resistance and Agreement. Step by step, but in recent 6 months we can recognize some shy upside action. It looks like market is pressing up but still has not enough power for fast breakout.
In fact market stands in tight range since 2014. Thus, 1.33-1.3850 is an area of “indecision”. While market stands inside of it we can talk about neither upward breakout nor downward reversal. At least, reversal identification could be done with yearly pivot – if market will move below it, this could be early sign of changing sentiment. But, as you can see, nothing among this issues have happened yet. The same has happened on previous week. Only recently we’ve disccused, as it was seemed, downward bounce out from 1.3850 level. But today we see that price has returned right back up to it.
Returning to discussion of Yearly Pivot - we’ve noted that upward bounce has started precisely from 1.3475 level. Now the major question stands as follows – whether this upward action is a confirmation of long-term bullish sentiment or just a respect of YPP first touch. Following the chart we see very useful combination for us – YPP stands very close to 1.33 – our invalidation point. And if market will move below YPP this will become bearish moment by itself.
Speaking about upward continuation, market mechanics does not allow price to show any deep retracement any more. Any move of this kind should be treated as market weakness and it will increase probability of reversal down. Take a look that as market has hit minor 0.618 AB-CD extension target right at former rock hard resistance – Fib level and Agreement and former yearly PR1, it has shown reasonable bounce down to 1.33. As retracement after 0.618 target already has happened, it is unlogical and unreasonable to see another deep bounce and if it will happen - it will look suspicious.
So, speaking about monthly upside targets... If we will get finally real break through resistance, we have two major targets – AB=CD one around 1.44 and Yearly PR1 = 1.4205.
Thus, here we can make following conclusion – nothing drastical yet, market still coiling near resistance. Recent action has some upside direction, but it is rather blur. As market is challenging 1.3850 for the third time right now, let’s see what result of this testing will be...
Weekly
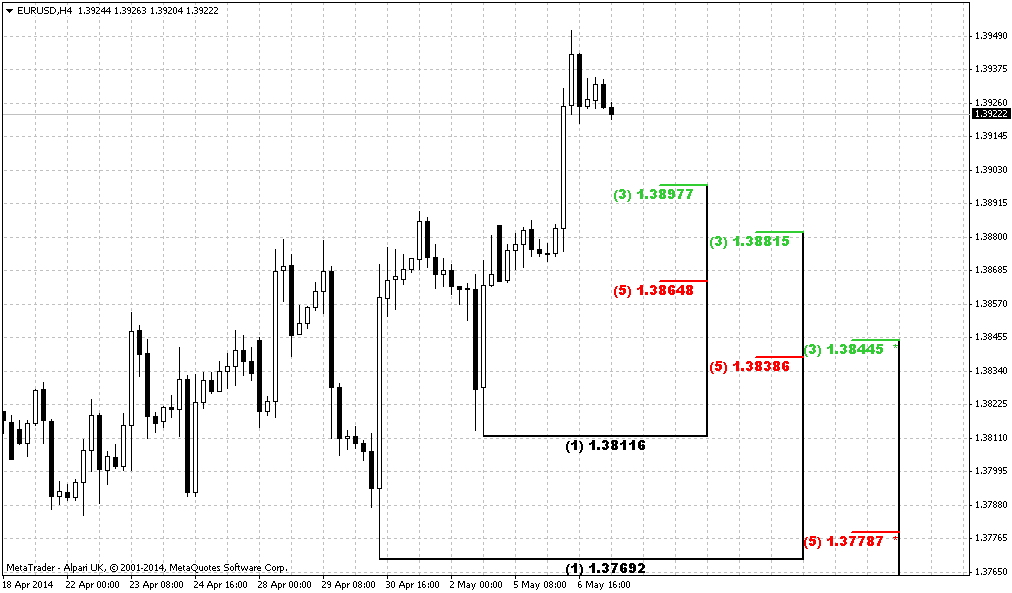
Currently, guys, we have very significant price action on weekly chart that left very small chances on downward action. Butterfly “sell” has not led to corresponding retracement to 1.35 weekly 3/8 Fib support. Usually this moment could indicate butterfly’s failure, but since we have just 1.27 pattern – failure automatically could mean continuation to next 1.618 target. And this is 1.43 area... Still this is a bit brave suggestion and too extended view. Other signs include action around as April as May pivot points. EUR holds above both of them. Thus, price has tested May PP yesterday and has jumped up out of it. Third moment is a failure of bearish grabber. Again, yesterday price has closed above its high and this is means failure. And finally, major pattern that we have currently is bullish dynamic pressure. Take a look at trend by MACD (it’s bearish) and price action – it’s bullish. Despite trend direction market shows upward action, strongly holds as above MPP as above WPP. Pressure suggests at least taking out of recent highs around 1.3966 area, MPR1 and former 1.27 butterfly target.
Daily
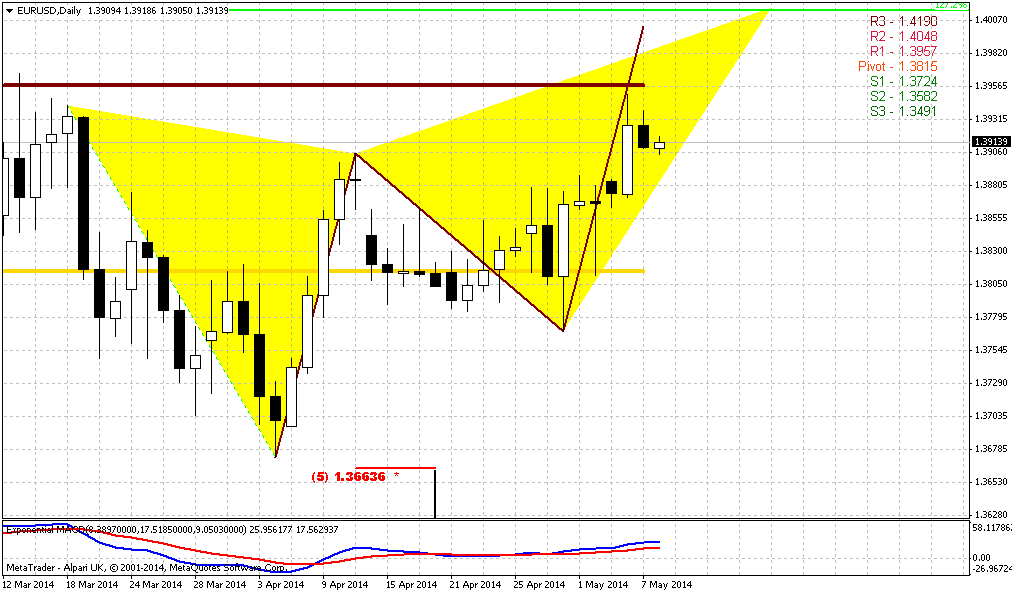
Trend here is bullish and market has not broken our bullish view yet. Yesterday we’ve said that it is better to move stops to breakeven around 1.3770-1.3780 – our entry point on Thursday. But even positive NFP release was not able to hold EUR at the bottom of Friday trading session and price has returned right back up. Precisely speaking, EUR has bounced up right from WPP and erased all USD appreciation due NFP numbers. This fact gives us hint on possible upward continuation on coming week. As a target we still use 1.40 area – 1.27 extension of Butterfly and inner AB=CD target. That is also MPR1=1.3955.
Besides, If you will take a look at GBP, CHF and weekly NZD – you will find confirmation of this possible upward action. Thus, daily GBP shows bullish grabber, USD/CHF shows bearish grabber (at the same point as EUR – marked by blue circle) accompanied by butterfly “buy” pattern, while weekly NZD shows bullish grabber as well. All of them hint on further dollar weakness on coming week. This gives us some confidence on further upward potential on EUR currency on coming week.
1-hour
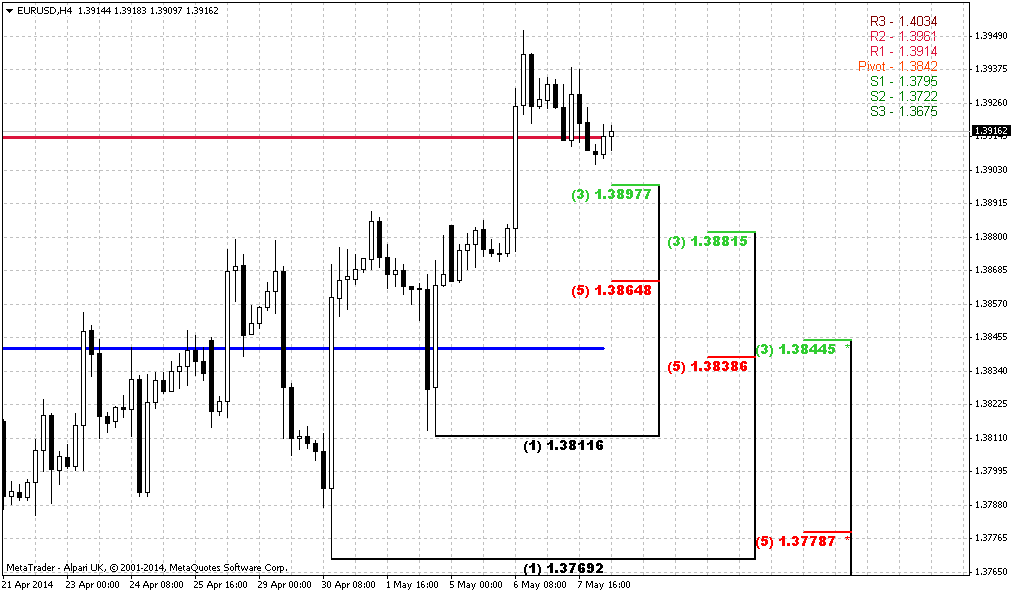
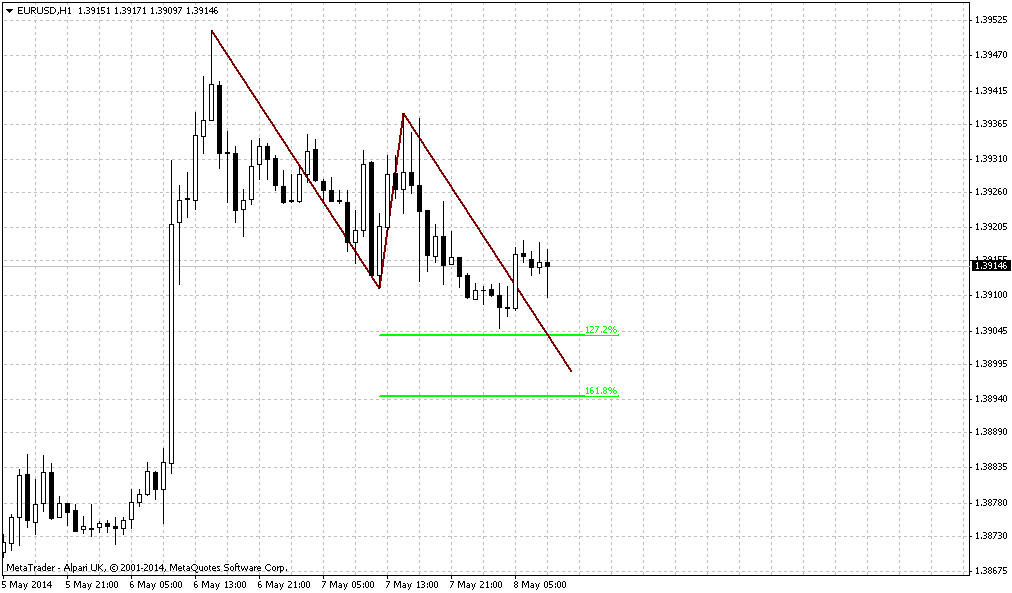
Trend is bullish here. For us mostly interesting hourly chart but not a 4-hour, because we’re mostly interesting in recent swing up for searching of entry point. Since price has not created new high after Thursday’s top – 4-hour chart can’t give us necesary Fib levels, but hourly chart can. Thus, major level to watch for is a combination of 5/8 Fib support and WPP – 1.3840 area. If market has real intention to move higher and bullish potential – it probably will hold above this area. If not, then we, probably, will have to monitor situation for a while again to undertsand what is goin’ on...
Conclusion:
While price stands in 1.33-1.38 area we can’t speak either on upward or downward breakout. Market continues to coiling inside of this range and in recent time step by step, heavy but market shows some climbing - a kind of market is breaking and struggling against swamp resistance.
In short-term perspective EUR shows bullish signs – standing above MPP and WPP, erasing of bearish pattern and shy bearish reaction on excellent NFP data. These moments point on possible upward continuation as we’ve suggested on previous week. Thus, we could keep long positions that already are protected by breakeven stops. For those, who add more or would like to step in long trade – take a look on 1.3840 area. But if market will pass through it down – don’t take long position. If EUR is really bullish – it should not show too deep retracement right now, since daily 50% retracement already has happened but price has not reached yet any significant objective point to trigger any solid retracement.
The technical portion of Sive's analysis owes a great deal to Joe DiNapoli's methods, and uses a number of Joe's proprietary indicators. Please note that Sive's analysis is his own view of the market and is not endorsed by Joe DiNapoli or any related companies.