Sive Morten
Special Consultant to the FPA
- Messages
- 18,673
Monthly
So, as Reuters reports The safe-haven dollar and yen fell on Friday after Federal Reserve Vice Chair Janet Yellen lifted investor appetite for riskier assets by defending the U.S. central bank's current stimulus measures.
Yellen, speaking at her confirmation hearing before the Senate Banking committee on Thursday to take over from Fed Chairman Ben Bernanke, said the Fed will keep its stimulus program intact until the U.S. economy shows more strength and stability. Her comments have dented the low-yielding yen, pushing the dollar to a two-month high against the Japanese currency. The yen typically falls when investors are looking to take on risk.
Data on Friday showed U.S. industrial production dipped unexpectedly in October as output at power plants and mines declined, but a third straight month of gains in manufacturing output suggested the economy remained on a moderate growth path.
"The moderate pace of growth in the U.S. economy no doubt exacerbated by the budget impasse and lack of progress in the job market may explain why the Fed will continue with the monthly purchases," said Sean Cotton, vice president and senior trader at Bank of the West in San Ramon, California. "As a result, the dollar is extending its decline and expectation is for weakness until the Fed indicates otherwise. This may be the trend until March."
Despite Friday's gains, analysts said the euro's overall prospects looked less upbeat than the dollar's given the disparity between the U.S. and European economies. Weak euro zone GDP numbers on Thursday have kept alive the possibility of more central bank action to stimulate growth. "We feel confident that the dollar will be trading higher than where it is now against the euro and yen in three months time and maybe even sooner if data is good," said Kathy Lien, managing director at BK Asset Management in New York. "U.S. rates are headed higher and as long as this prospect does not change, we can expect another 2 to 3 percent rally in the dollar."
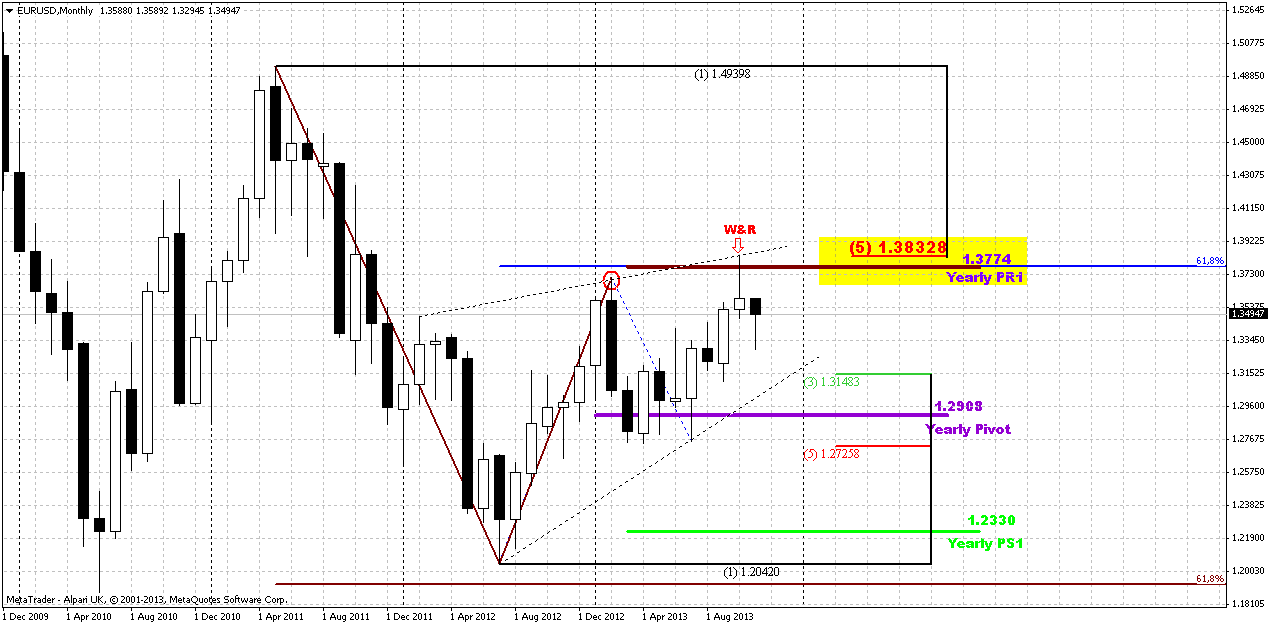
From the technical standpoint there are no much changes, at least on monthly chart. Previously we’ve discussed situation on big quarterly picture trying to understand whether current bearish signs are just retracement or this is starting point of downward trend.
As we’ve said at first glance and by looking just at monthly chart we can say – “well, market has hit resistance and Agreement, minor bounce is possible in this case”. Indeed, market has touched 0.618 AB=CD target right at Fib resistance. In this case retracement to 1.32-1.33 area will not be look as curious. And now take a look – market has hit this level, that we could accept as ultimate depth of pullback due respect to target and resistance. Thus, it turns out that price stands at some sort of an edge. If it will move lower, then we will not be able to treat this move as retracement anymore. This riddle probably will be resolved within 1-2 weeks. On passed week, market has not broken it and bounce up. Hence, standing at the edge will continue.
Second scenario, that is closer to my point of view, we could get “222” Sell pattern right from rock hard resistance – major 5/8 Fib level+Agreement and Yearly Pivot resistance 1. Take a look at AB-CD itself. CD leg is rather weak, especially it has become slow down even prior minor 0.618 target. This tells that upward momentum is not strong. CD leg itself is rather choppy with a lot of pullbacks. Currently we have October “Shooting star” pattern that simulteniously looks like W&R on previous swing high. This pattern suggests too deep retracement down that will be not acceptable for breakout of previous tops. In perspective, if November will become long black candle we could get Evening star pattern. And finally, we know that Pivot Resistance 1 holds retracement up if downward trend is still valid, right? That is what we see now. Finally, if you will draw trend lines, you’ll see that in fact, price action since April 2012 looks like rising wedge pattern. If we’re correct with our view, appearing of “222” Sell will lead price at minimum to 1.1950-1.20 area, it’s minor 0.618 extension. Now you can imagine where we could get if this will be Butterfly “Buy”, that we’ve discussed in previous research, dedicated to EUR. That’s right – 1.10. May be this is too pessimistic issue for EUR, and too far view, but anyway, right now I do not see valuable signs of EUR strength.
Weekly
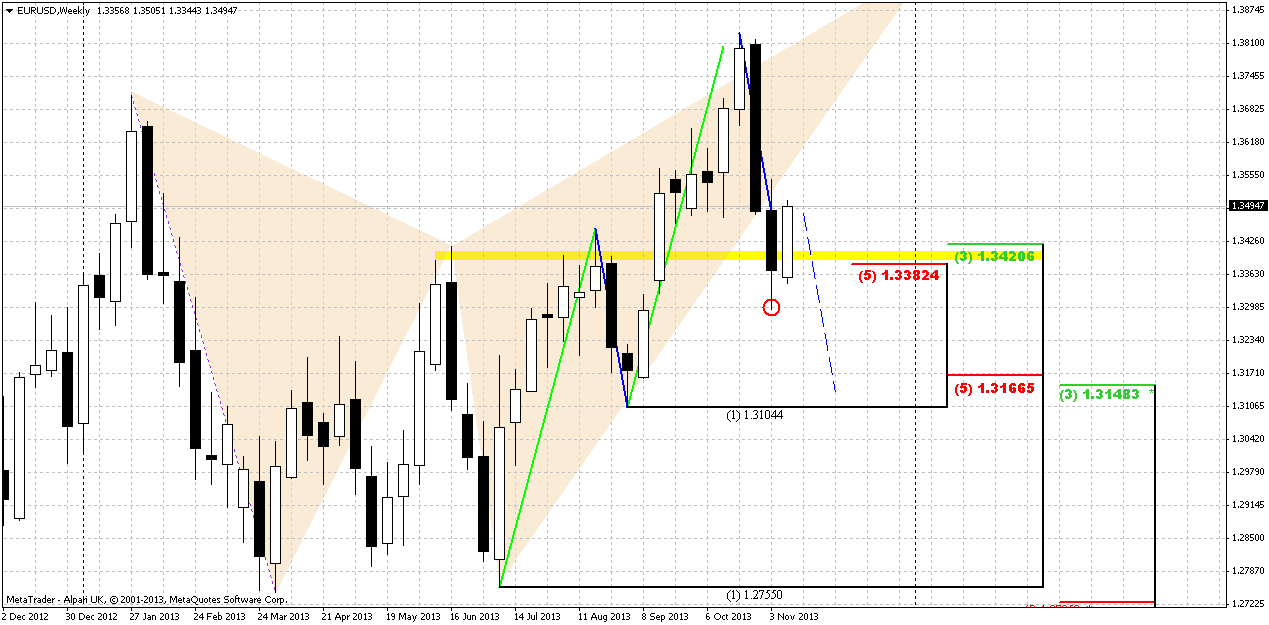
Trend is bearish on weekly chart. Market has tested first K-support area and take a look – shows the respect of it by bounce up and forming bullish engufling pattern. Previously we said that market shows some bearish signs, that makes downward continuation more probable. Thus, market has broken swing harmony and shows downward move greater than previous one, price has moved below MPS1 and this could be a sign of downward continuation and tells that current move down is not just retracement.
Our downward target is K-support area around 1.3150 and we said on previous week that we should use any rally on lower time frames for short entry. Now we see that this rally is in progress. Hence our major question – whether it has finisihed or not?
As we have bullish pattern, we can’t just enter blindly. We need to see either its cancelling by price action moving below its lows, or reaching of its target. Second variant assumes watching over lower time frames for reversal patterns. If this engulfing pattern will work, then we could get move to an area around 1.3650 – equal to length of the bars.
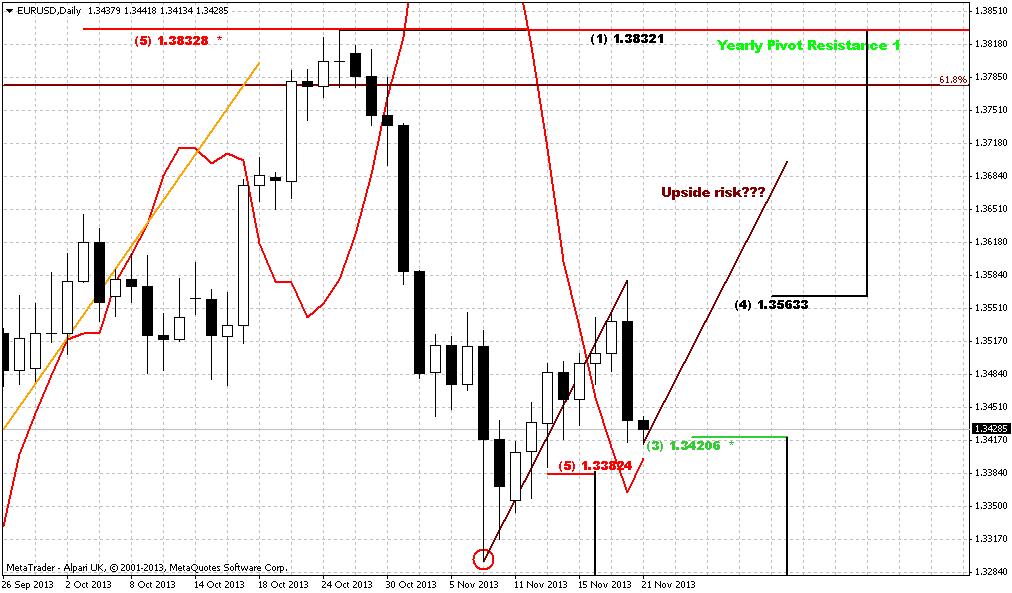
Daily
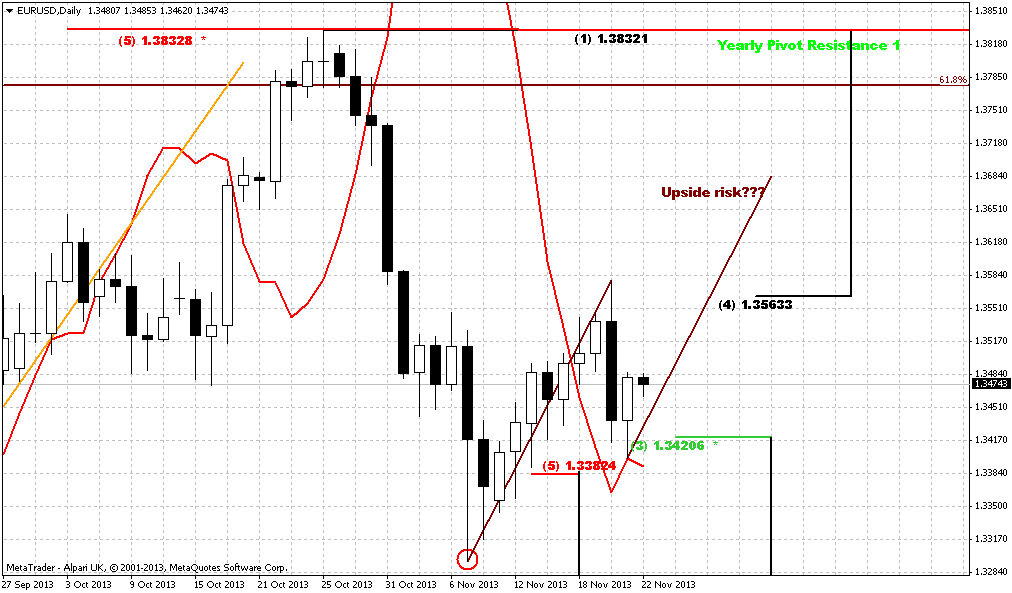
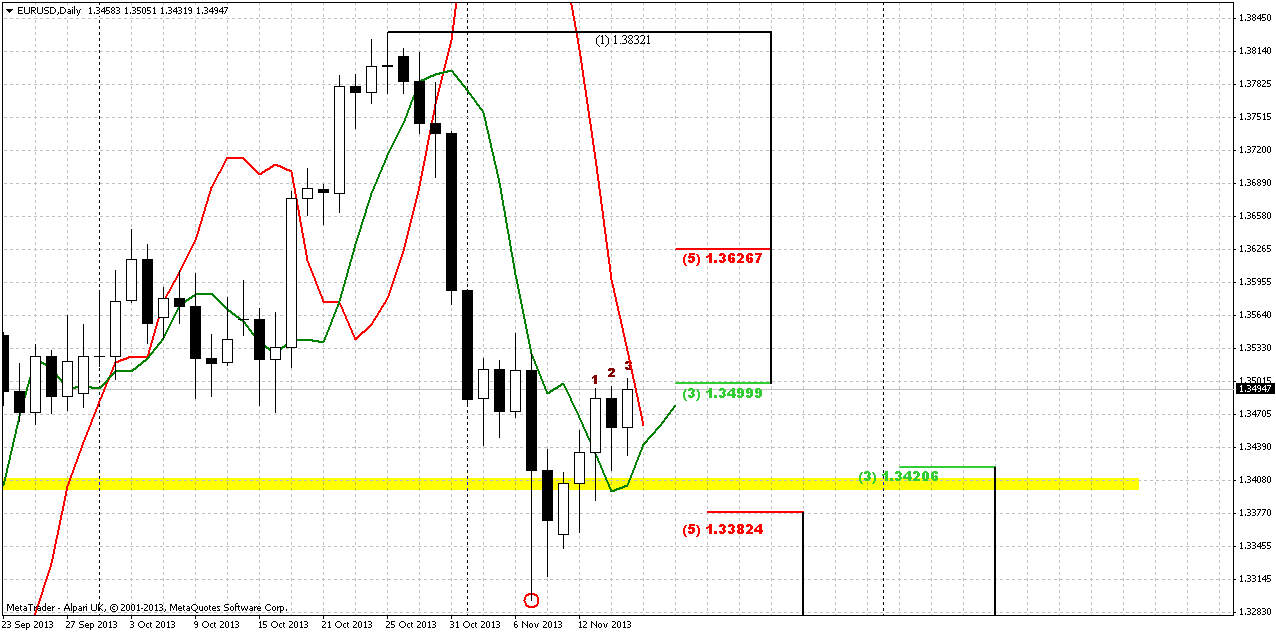
Well, looks like Monday will be very important day for EUR and for us, because probably right on Monday we will understand where market will go – to 1.3650 area or to 1.3150.
Here we have context for patterns that are contradictory to weekly bullish engulfing, at least one of them could be opposite. First is B&B “Sell”, that although does not suggest definite downward continuation, but its minimum target assumes move to an area around 1.3380. According to DiNapoli framework B&B has started within 1-3 days after crossing 3x3 DMA (green line) and after reaching significant Fib resistance. Both conditions were met, so this is some kind of “pain or gain” situation. B&B has to either start or fail.
Second is possible bearish stop grabber. Market stands close to MACDP line. If market will form it then its target will suggest taking out of previous lows around 1.3295 and simultaneously suggests vanishing of weekly engulfing, right? So, as you can see, here we have a lot to watch for on Monday.
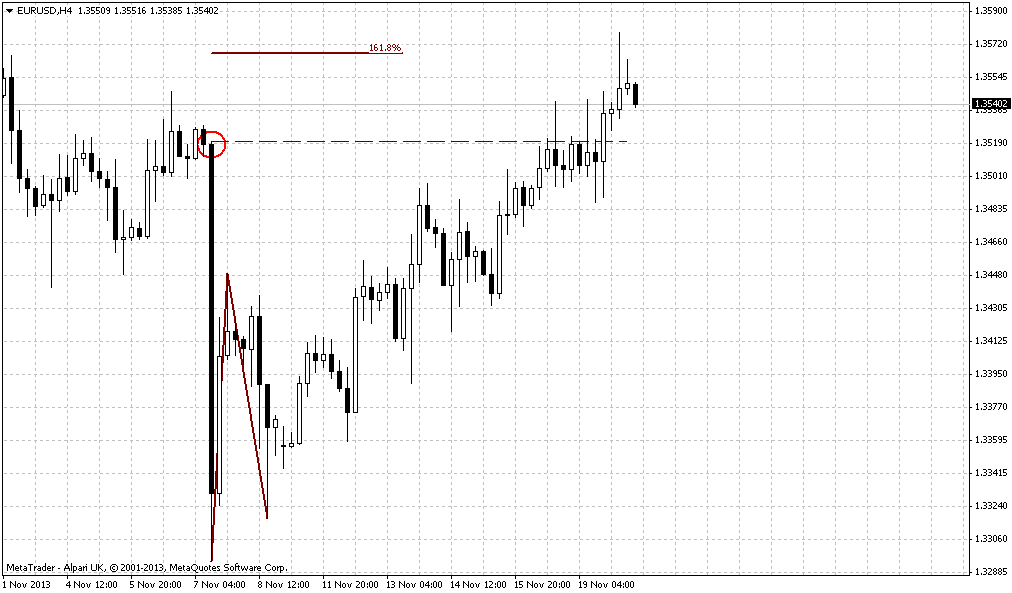
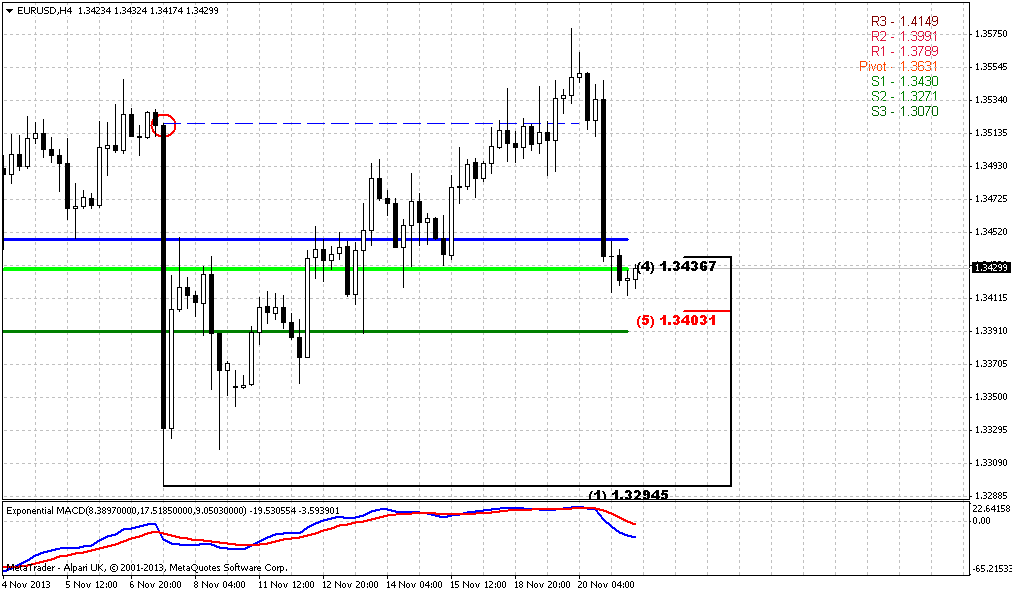
4-hour
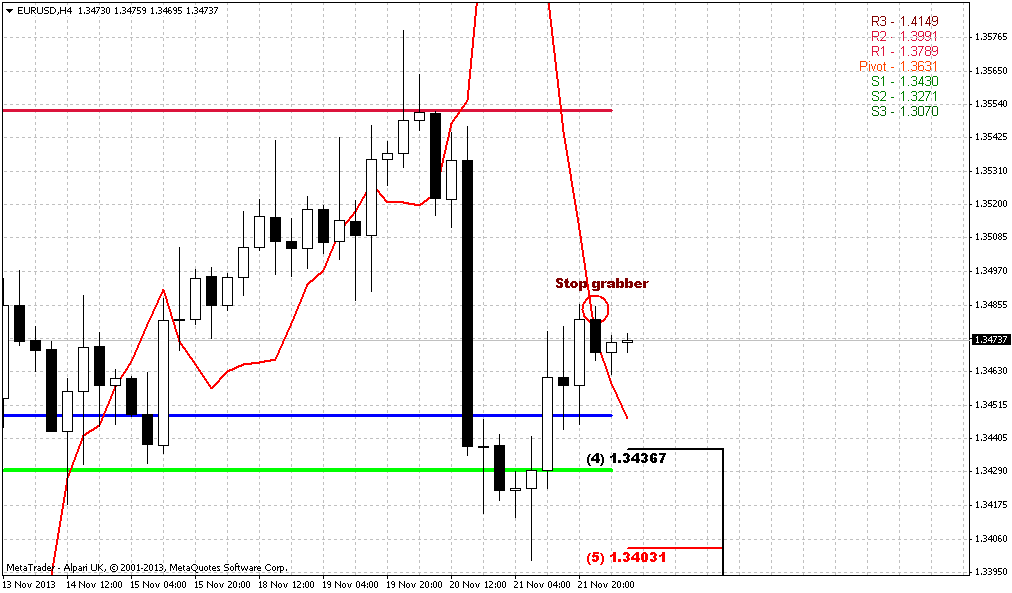
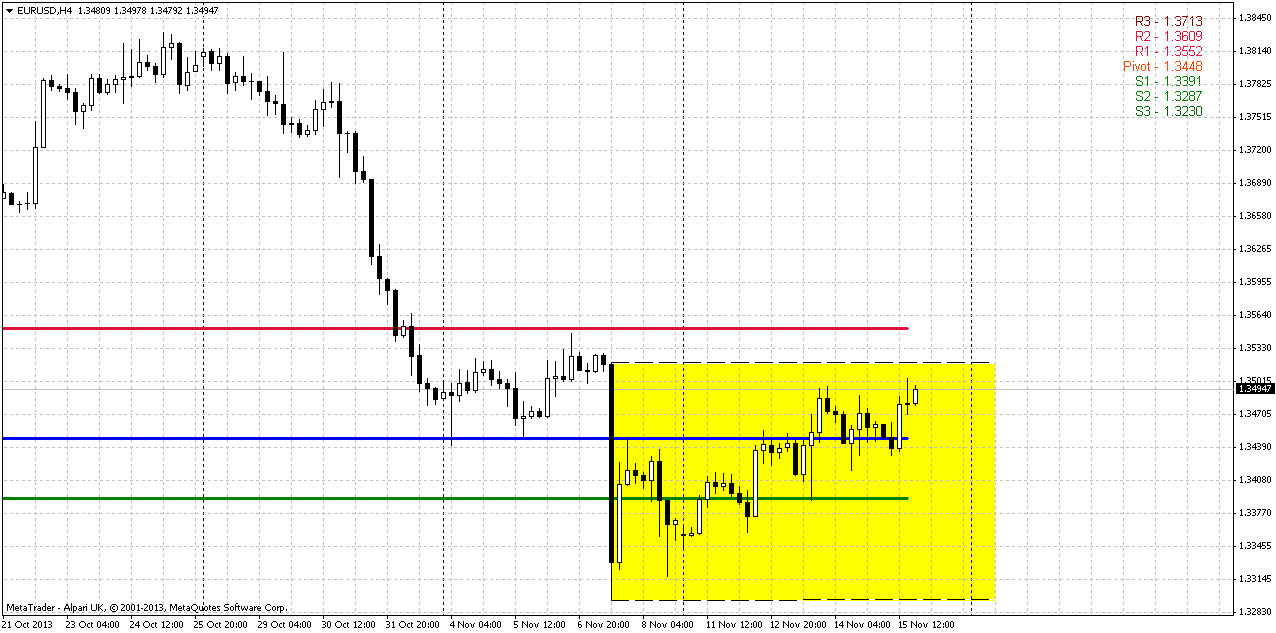
On this chart our major concern stands with long-ranged candles that holds all recent price action. This kind of candles could give nice assistance during breakouts, since its borders become some kind of indicator. Now market is approaching to upper border. Keeping in mind that we could get as grabber as B&B on daily we will have to look for breakout. For short entry we need to see it’s failure. When price fails to break long-ranged candle in this case it has chances not just reach opposite border but to double the range to the downside. May be market will hit WPR1 as well and turn down, we do not know by far, but failure breakout could become triggering moment for all bearish patterns that we potentially have now.
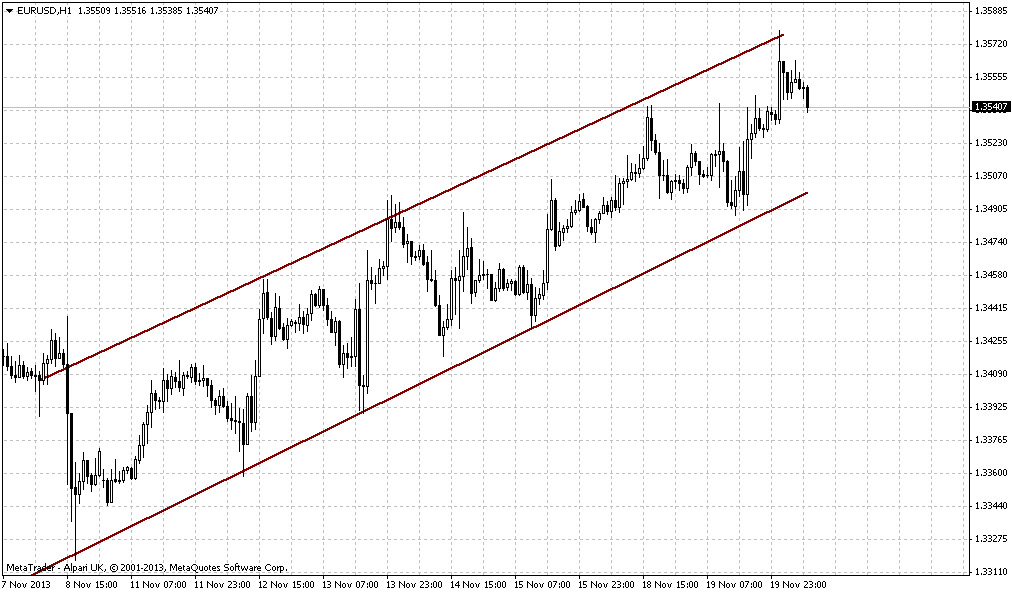
60-min
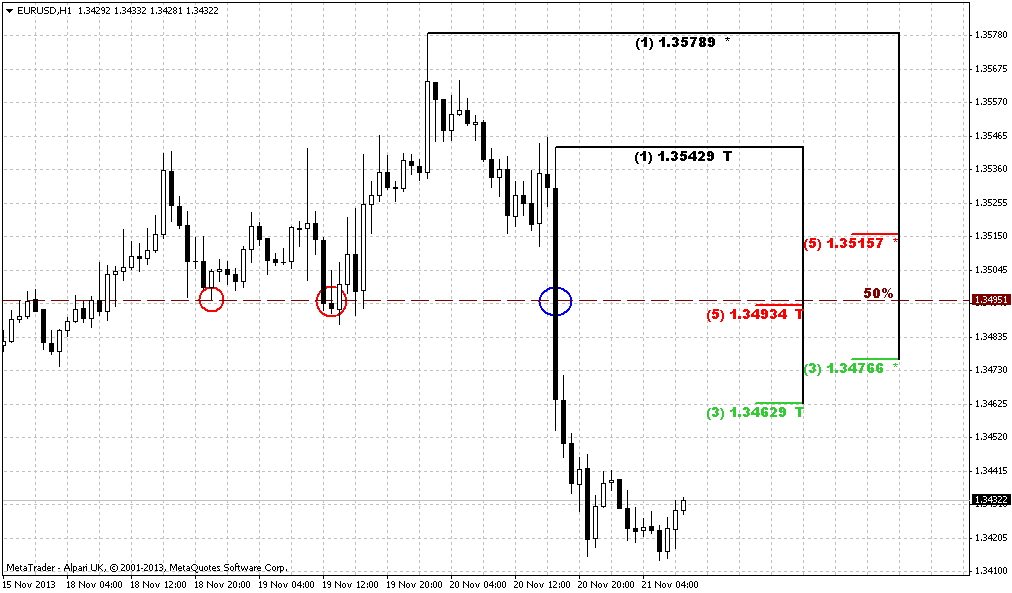
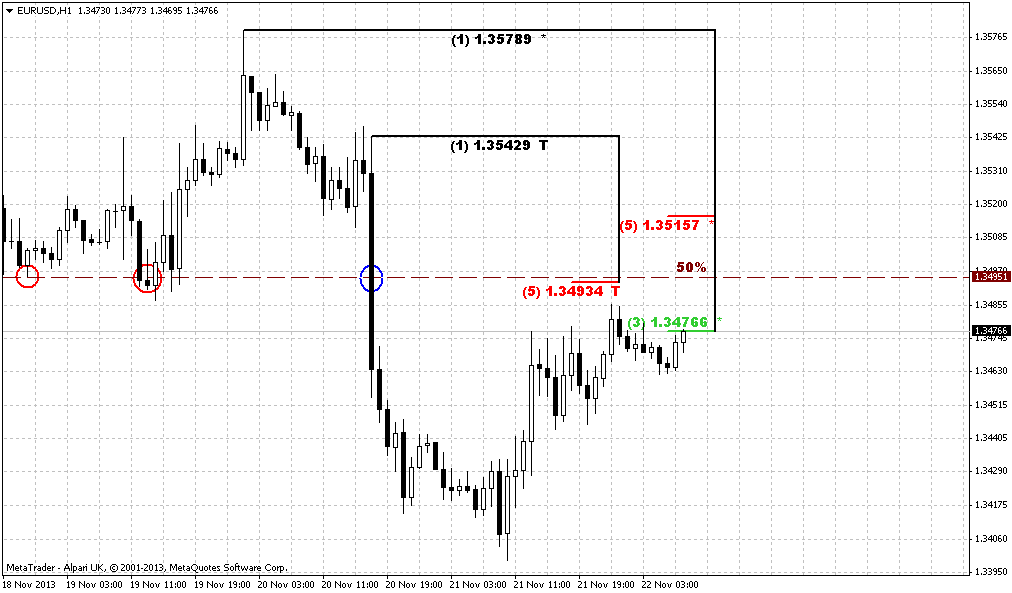
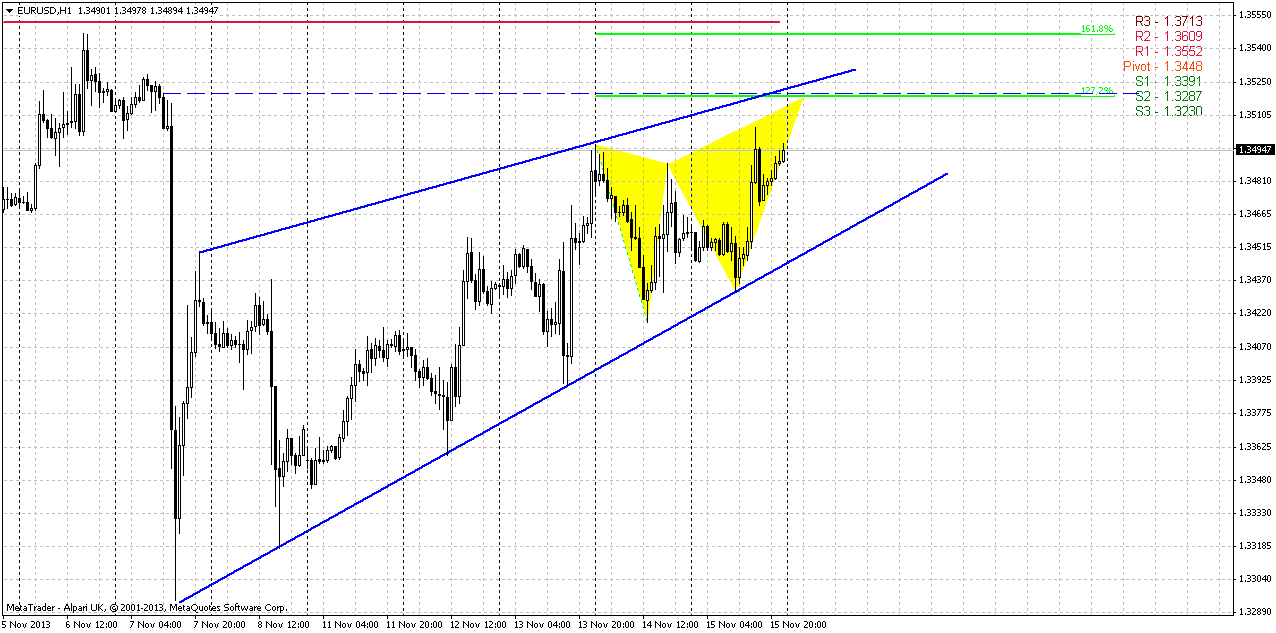
Hourly chart is very similar to those that we’ve discussed on Friday. Our butterfly still valid and nicely agrees with possible bearish development. Take a look that 1.27 possible reversal point stands right around upper border of 4-hour candle, while 1.618 agrees with WPR1.
In general, current price action looks choppy and heavy that is typical for any retracement. Market is forming rising wedge pattern. But sometimes, when price forms exhausting pattern and you already start to think that breakout is near, sometimes market could show sudden upward acceleration. This is in fact major risk for us here. Currently I do not see any signs of this, but who knows...
Conclusion:
In longer term perspective bearish signs could appear to be stronger than they seem right now and could lead market to serious consequences with ultimate move even to 1.10.
In short-term perspective bearish context holds, price stands with respect action of K-support area and showing bounce up. The choppiness of price action makes us think that this is more a retracement rather then upward continuation. Potentially we have bearish patterns that add-on each other. But to be absolutely sure, we need to see some signs of inability of the market to move higher and that is what we will be look for on Monday.
The technical portion of Sive's analysis owes a great deal to Joe DiNapoli's methods, and uses a number of Joe's proprietary indicators. Please note that Sive's analysis is his own view of the market and is not endorsed by Joe DiNapoli or any related companies.
So, as Reuters reports The safe-haven dollar and yen fell on Friday after Federal Reserve Vice Chair Janet Yellen lifted investor appetite for riskier assets by defending the U.S. central bank's current stimulus measures.
Yellen, speaking at her confirmation hearing before the Senate Banking committee on Thursday to take over from Fed Chairman Ben Bernanke, said the Fed will keep its stimulus program intact until the U.S. economy shows more strength and stability. Her comments have dented the low-yielding yen, pushing the dollar to a two-month high against the Japanese currency. The yen typically falls when investors are looking to take on risk.
Data on Friday showed U.S. industrial production dipped unexpectedly in October as output at power plants and mines declined, but a third straight month of gains in manufacturing output suggested the economy remained on a moderate growth path.
"The moderate pace of growth in the U.S. economy no doubt exacerbated by the budget impasse and lack of progress in the job market may explain why the Fed will continue with the monthly purchases," said Sean Cotton, vice president and senior trader at Bank of the West in San Ramon, California. "As a result, the dollar is extending its decline and expectation is for weakness until the Fed indicates otherwise. This may be the trend until March."
Despite Friday's gains, analysts said the euro's overall prospects looked less upbeat than the dollar's given the disparity between the U.S. and European economies. Weak euro zone GDP numbers on Thursday have kept alive the possibility of more central bank action to stimulate growth. "We feel confident that the dollar will be trading higher than where it is now against the euro and yen in three months time and maybe even sooner if data is good," said Kathy Lien, managing director at BK Asset Management in New York. "U.S. rates are headed higher and as long as this prospect does not change, we can expect another 2 to 3 percent rally in the dollar."
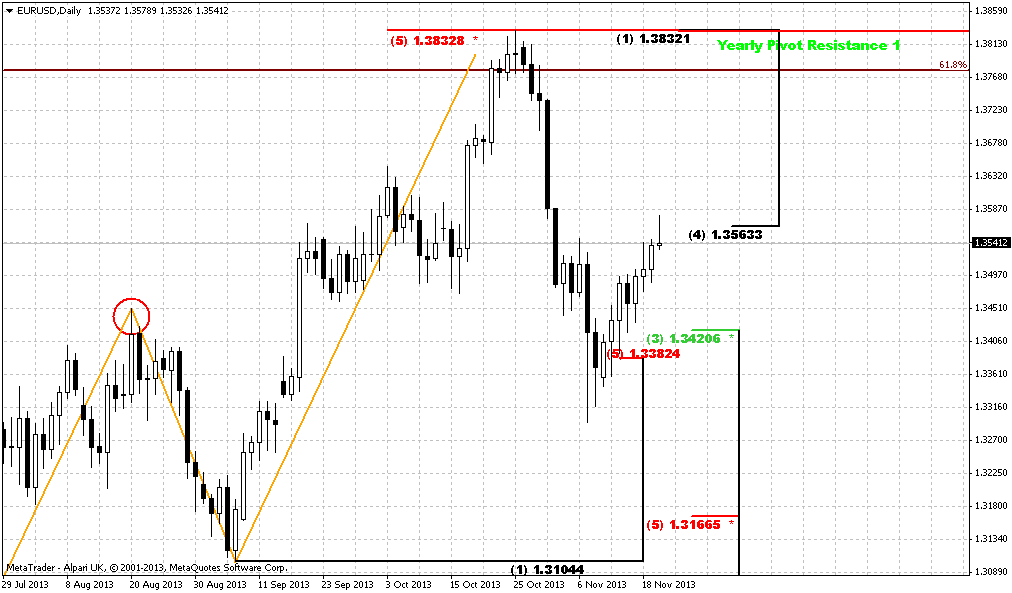
From the technical standpoint there are no much changes, at least on monthly chart. Previously we’ve discussed situation on big quarterly picture trying to understand whether current bearish signs are just retracement or this is starting point of downward trend.
As we’ve said at first glance and by looking just at monthly chart we can say – “well, market has hit resistance and Agreement, minor bounce is possible in this case”. Indeed, market has touched 0.618 AB=CD target right at Fib resistance. In this case retracement to 1.32-1.33 area will not be look as curious. And now take a look – market has hit this level, that we could accept as ultimate depth of pullback due respect to target and resistance. Thus, it turns out that price stands at some sort of an edge. If it will move lower, then we will not be able to treat this move as retracement anymore. This riddle probably will be resolved within 1-2 weeks. On passed week, market has not broken it and bounce up. Hence, standing at the edge will continue.
Second scenario, that is closer to my point of view, we could get “222” Sell pattern right from rock hard resistance – major 5/8 Fib level+Agreement and Yearly Pivot resistance 1. Take a look at AB-CD itself. CD leg is rather weak, especially it has become slow down even prior minor 0.618 target. This tells that upward momentum is not strong. CD leg itself is rather choppy with a lot of pullbacks. Currently we have October “Shooting star” pattern that simulteniously looks like W&R on previous swing high. This pattern suggests too deep retracement down that will be not acceptable for breakout of previous tops. In perspective, if November will become long black candle we could get Evening star pattern. And finally, we know that Pivot Resistance 1 holds retracement up if downward trend is still valid, right? That is what we see now. Finally, if you will draw trend lines, you’ll see that in fact, price action since April 2012 looks like rising wedge pattern. If we’re correct with our view, appearing of “222” Sell will lead price at minimum to 1.1950-1.20 area, it’s minor 0.618 extension. Now you can imagine where we could get if this will be Butterfly “Buy”, that we’ve discussed in previous research, dedicated to EUR. That’s right – 1.10. May be this is too pessimistic issue for EUR, and too far view, but anyway, right now I do not see valuable signs of EUR strength.
Weekly
Trend is bearish on weekly chart. Market has tested first K-support area and take a look – shows the respect of it by bounce up and forming bullish engufling pattern. Previously we said that market shows some bearish signs, that makes downward continuation more probable. Thus, market has broken swing harmony and shows downward move greater than previous one, price has moved below MPS1 and this could be a sign of downward continuation and tells that current move down is not just retracement.
Our downward target is K-support area around 1.3150 and we said on previous week that we should use any rally on lower time frames for short entry. Now we see that this rally is in progress. Hence our major question – whether it has finisihed or not?
As we have bullish pattern, we can’t just enter blindly. We need to see either its cancelling by price action moving below its lows, or reaching of its target. Second variant assumes watching over lower time frames for reversal patterns. If this engulfing pattern will work, then we could get move to an area around 1.3650 – equal to length of the bars.
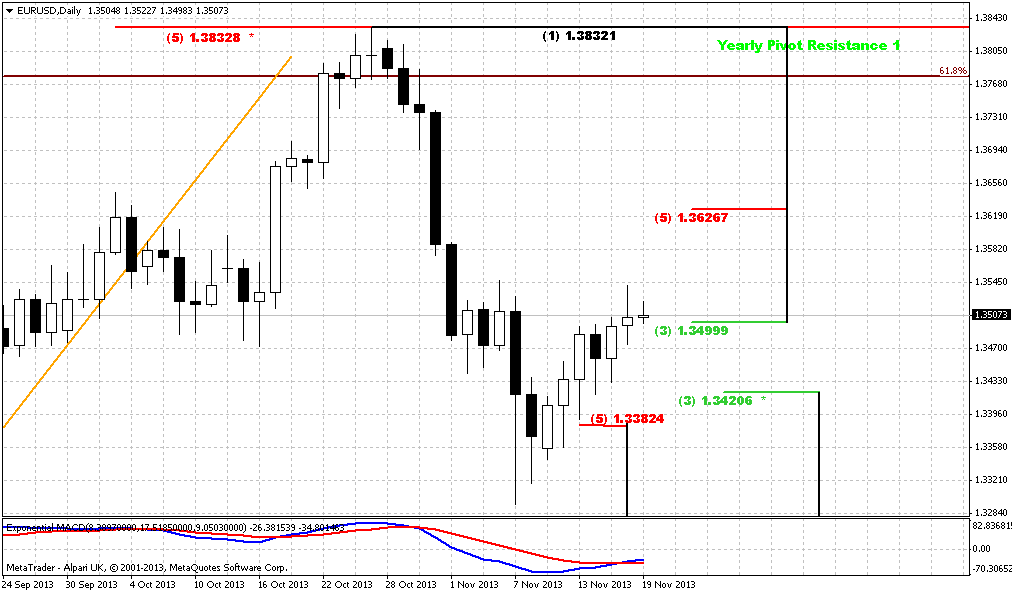
Daily
Well, looks like Monday will be very important day for EUR and for us, because probably right on Monday we will understand where market will go – to 1.3650 area or to 1.3150.
Here we have context for patterns that are contradictory to weekly bullish engulfing, at least one of them could be opposite. First is B&B “Sell”, that although does not suggest definite downward continuation, but its minimum target assumes move to an area around 1.3380. According to DiNapoli framework B&B has started within 1-3 days after crossing 3x3 DMA (green line) and after reaching significant Fib resistance. Both conditions were met, so this is some kind of “pain or gain” situation. B&B has to either start or fail.
Second is possible bearish stop grabber. Market stands close to MACDP line. If market will form it then its target will suggest taking out of previous lows around 1.3295 and simultaneously suggests vanishing of weekly engulfing, right? So, as you can see, here we have a lot to watch for on Monday.
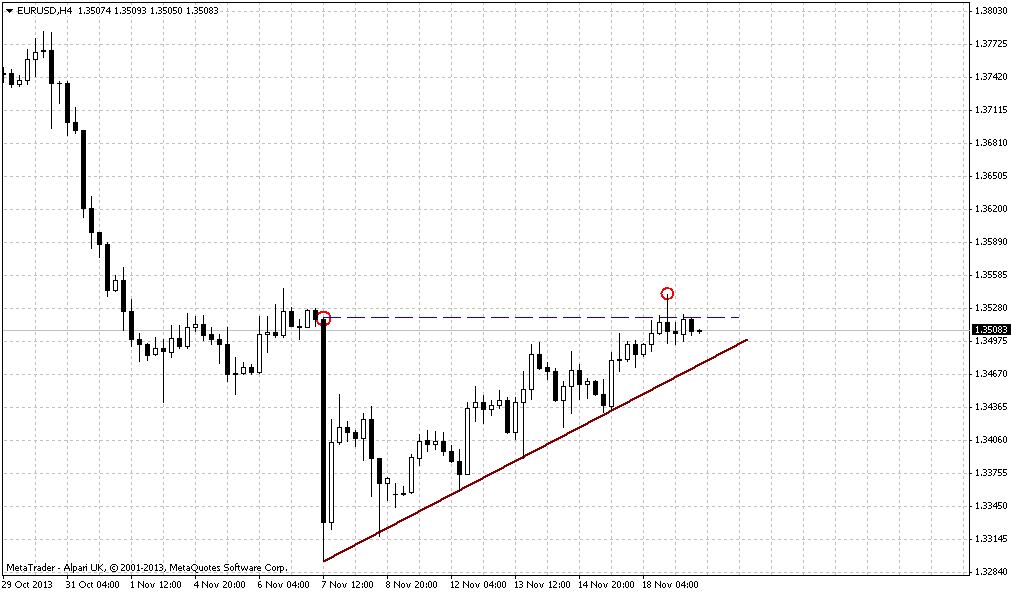
4-hour
On this chart our major concern stands with long-ranged candles that holds all recent price action. This kind of candles could give nice assistance during breakouts, since its borders become some kind of indicator. Now market is approaching to upper border. Keeping in mind that we could get as grabber as B&B on daily we will have to look for breakout. For short entry we need to see it’s failure. When price fails to break long-ranged candle in this case it has chances not just reach opposite border but to double the range to the downside. May be market will hit WPR1 as well and turn down, we do not know by far, but failure breakout could become triggering moment for all bearish patterns that we potentially have now.
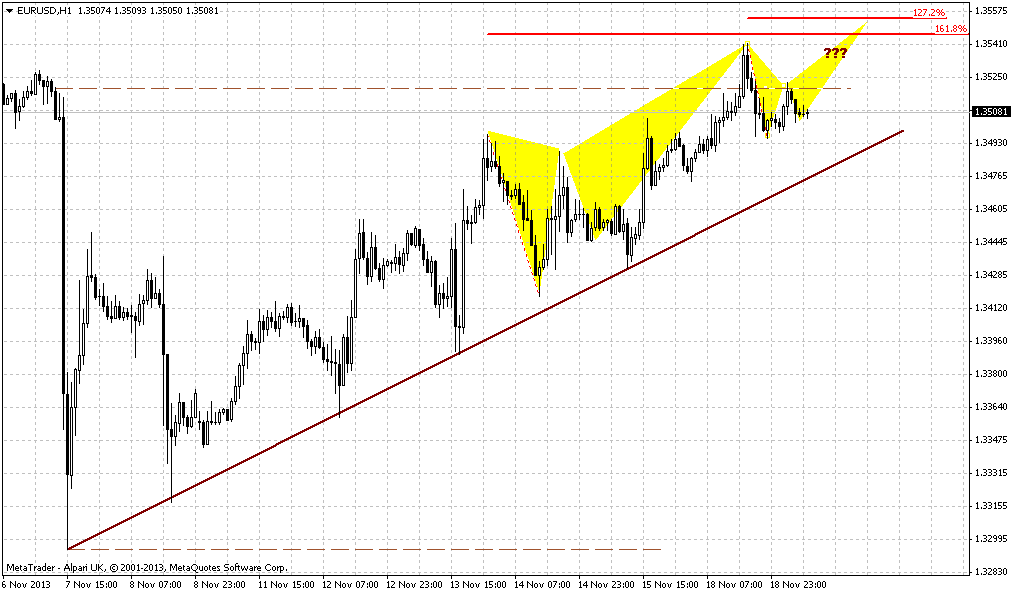
60-min
Hourly chart is very similar to those that we’ve discussed on Friday. Our butterfly still valid and nicely agrees with possible bearish development. Take a look that 1.27 possible reversal point stands right around upper border of 4-hour candle, while 1.618 agrees with WPR1.
In general, current price action looks choppy and heavy that is typical for any retracement. Market is forming rising wedge pattern. But sometimes, when price forms exhausting pattern and you already start to think that breakout is near, sometimes market could show sudden upward acceleration. This is in fact major risk for us here. Currently I do not see any signs of this, but who knows...
Conclusion:
In longer term perspective bearish signs could appear to be stronger than they seem right now and could lead market to serious consequences with ultimate move even to 1.10.
In short-term perspective bearish context holds, price stands with respect action of K-support area and showing bounce up. The choppiness of price action makes us think that this is more a retracement rather then upward continuation. Potentially we have bearish patterns that add-on each other. But to be absolutely sure, we need to see some signs of inability of the market to move higher and that is what we will be look for on Monday.
The technical portion of Sive's analysis owes a great deal to Joe DiNapoli's methods, and uses a number of Joe's proprietary indicators. Please note that Sive's analysis is his own view of the market and is not endorsed by Joe DiNapoli or any related companies.