Sive Morten
Special Consultant to the FPA
- Messages
- 18,673
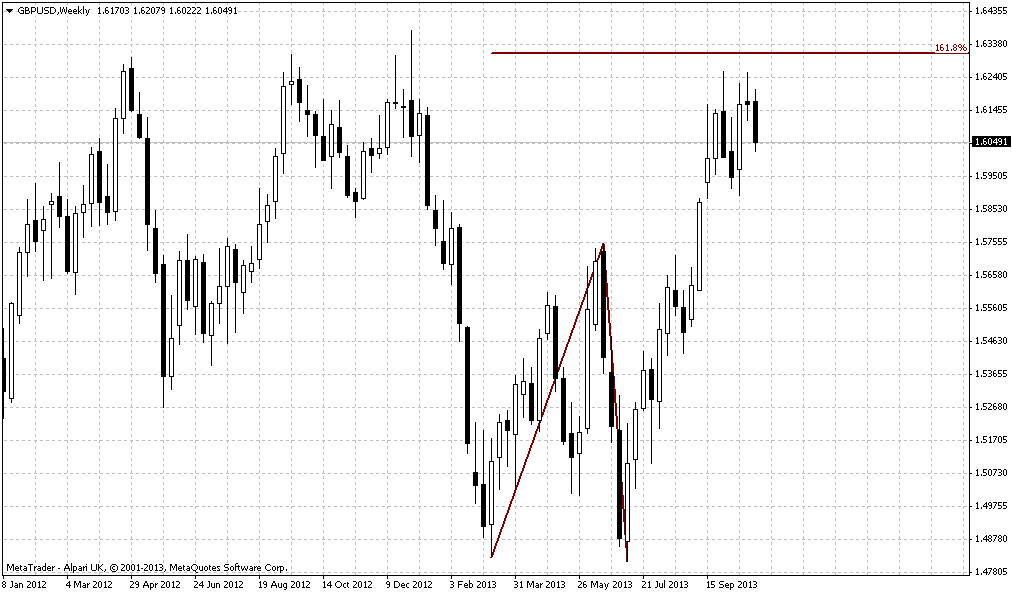
Monthly
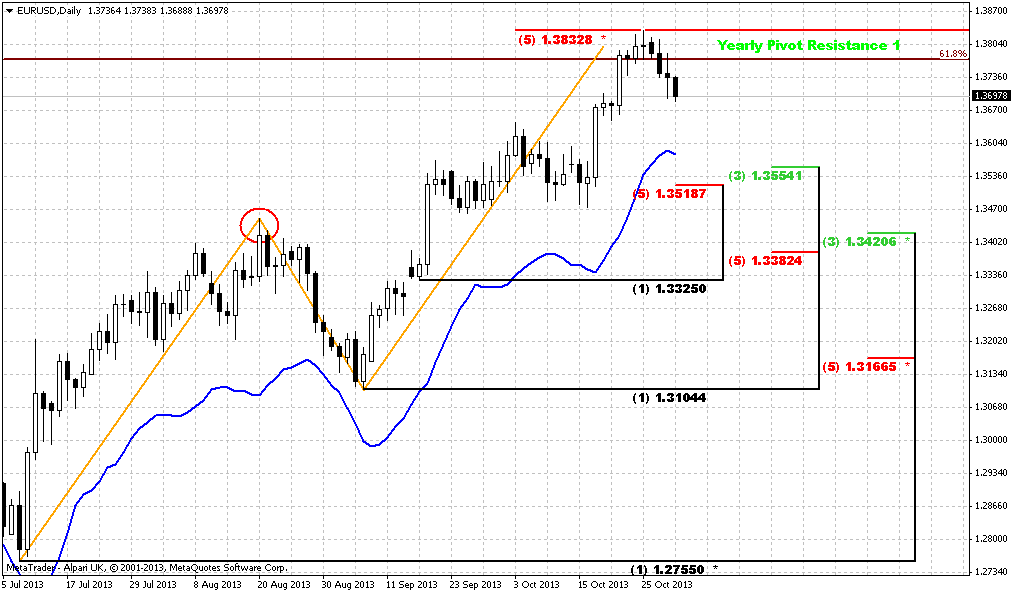
Today again, we will talk about NZD. Mostly because this is the one pair that has clear setup. We will not dive in New Zealand fundamentals because everybody undertsands that if any solid move will follow - it will follow due USD appreciation/depretiation, but probably not due NZD changes. Besides, since NZD also trades in relation to USD, and stands as a member of big family USD-related currency pairs, I can’t exclude that these patterns that now we see on NZD could become some sort of leading indicator for others. It is even more interesting, since particular these patterns have appeared on NZD right in the moment when EUR has hit monthly resistance cluster. Don’t be upset that we will not dedicate time to EUR. When you will read current research, you will understand why I have chosen NZD. Besides, we will track EUR in daily updates.
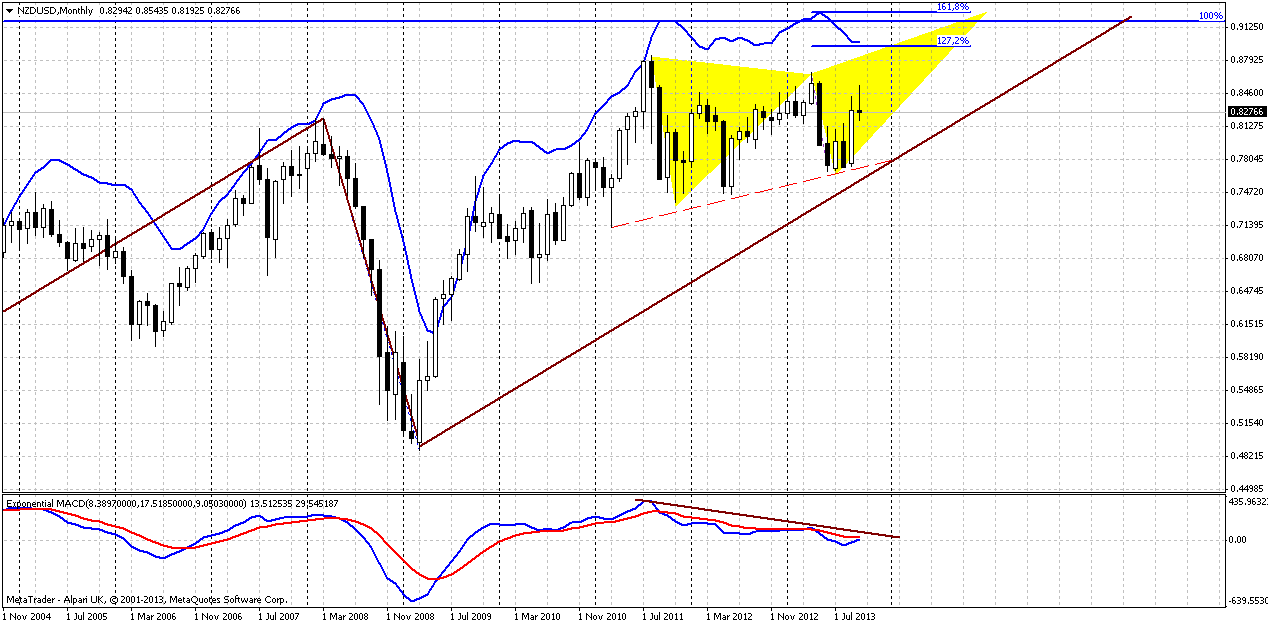
First, let’s recall what we’ve talked about previously. Our really big picture is based on big AB-CD pattern with target around 0.92. Market now stands above 0.618 and coiling slightly below 1.0 major objective point. When you see such situaiton this tells that it’s a great probability of upward move, since market just can’t remain in semi-position and gravitates to completion point of the pattern. Second our issue was bullish dynamic pressure. MACD shows bear trend, while market is forming the sequense of higher lows. Thus, I’ve drawn not a divergence, but just show you difference between trend and price action. Bullish dynamic pressure suggests taking out of previous highs at minimum. Finally here is obvious and nicely looking potential butterfly “Sell” pattern. The 1.618 extension stands slightly above AB=CD target and here is conclusion could be made that AB=CD target will be hit exactly by butterfly.
And finally Monthly Pivot. Market has tested it and moves above it, and in general – take a look that price more or less holds above broken highs. So current retracement looks like re-testing of broken 0.80 highs.
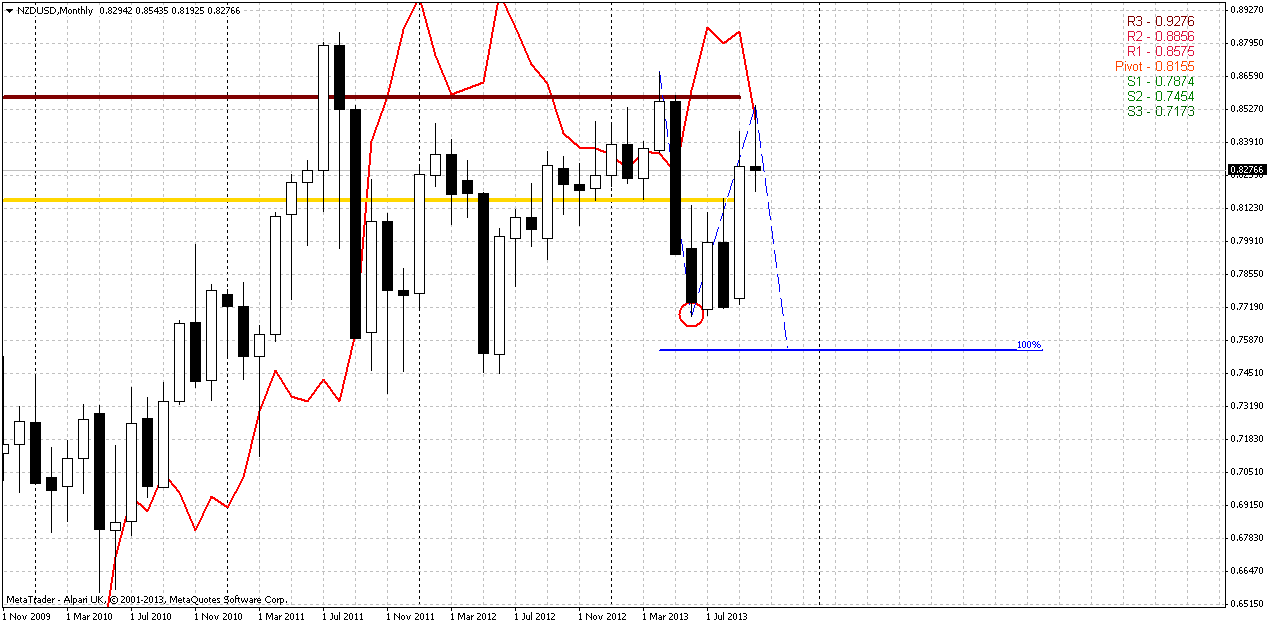
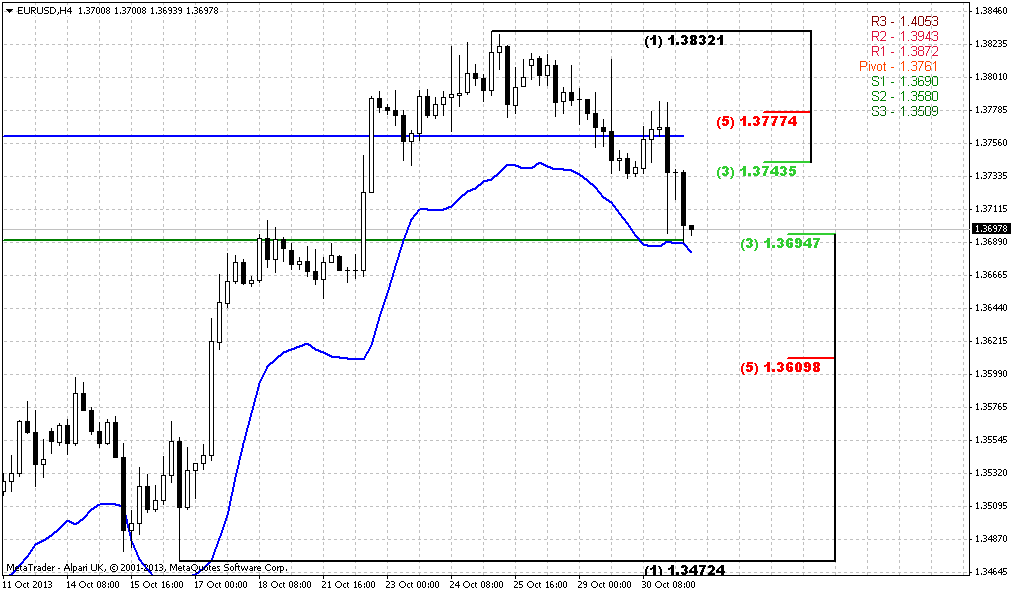
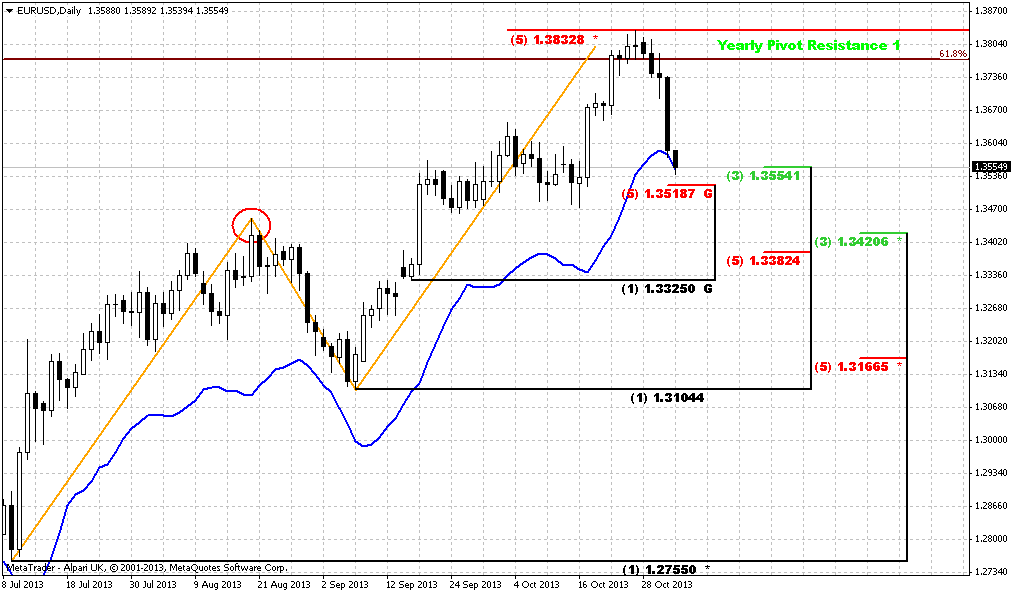
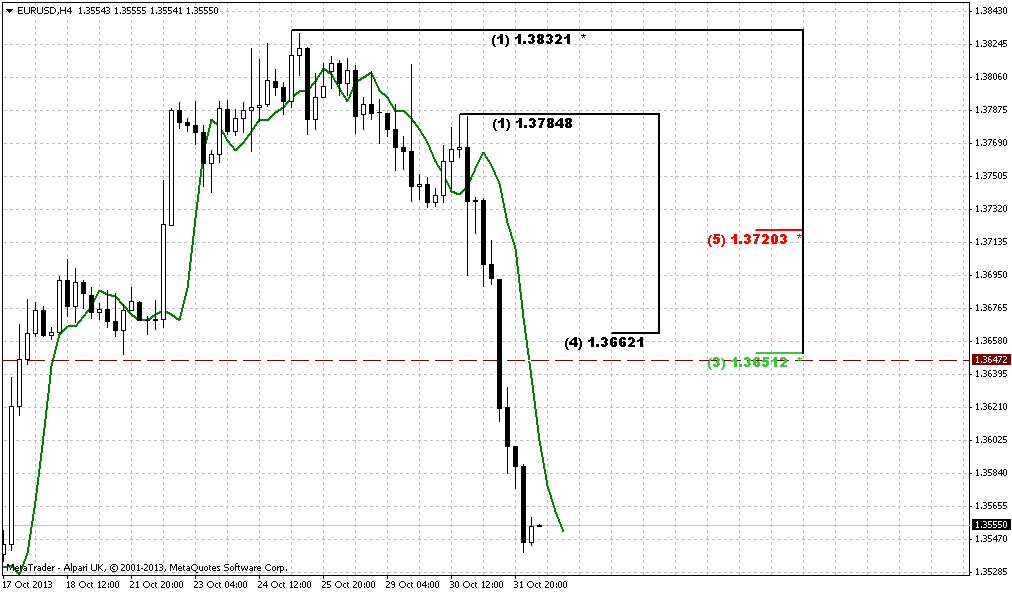
But this is really big picture. From tactical standpoint, we need to take a look at following chart. Actually here I mostly interesting with monthly stop grabber that has not been confirmed yet, since October is still lasting. But it is not significant probability that market will move right back above 0.8530 within next week. Minimum target is previous lows, i.e. 0.7680. Not bad hint, right? Now, combine this setup with those that we have on EUR – hard rock resistance around 1.38-1.39 and now reversal pattern on NZD. Also as I’ve read on forum, we have something bullish on dollar index.
But the magic of this issue is that if even price will take out these lows, our bullish setup could hold. By this potential move down, price could just accomplish downward AB=CD pattern and still hold the harmony of large AB-CD and even will not erase butterfly, we’ll see. Here market has reached MPR1, so we at resistance. Now let’s go further to weekly chart...
Weekly
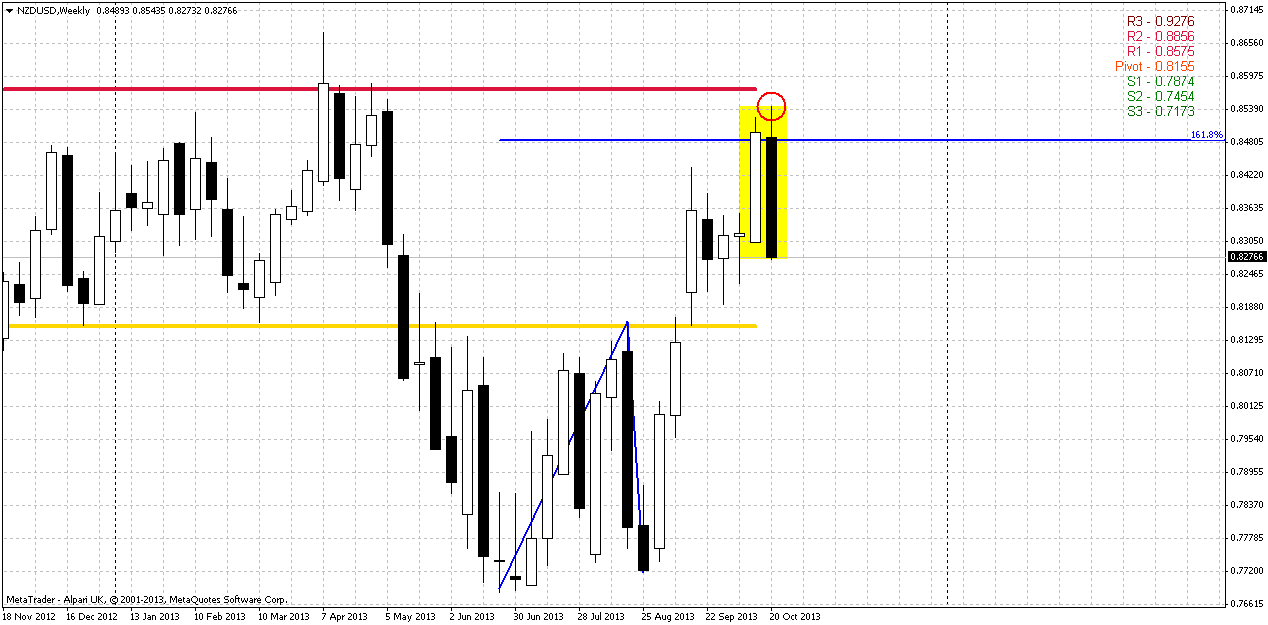
This chart gives a bit more details. Although trend holds bullish here still, but monthly grabber here takes the shape of perfect bearish engulfing pattern, that we like to deal with. Invalidation point obviously is the same – the high at 0.8543. Besides of MPR1 market also has accomplished upward ultimate 1.618 AB=CD target.
As we’ve estimated patterns and possible direction, we need to understand how to open position.
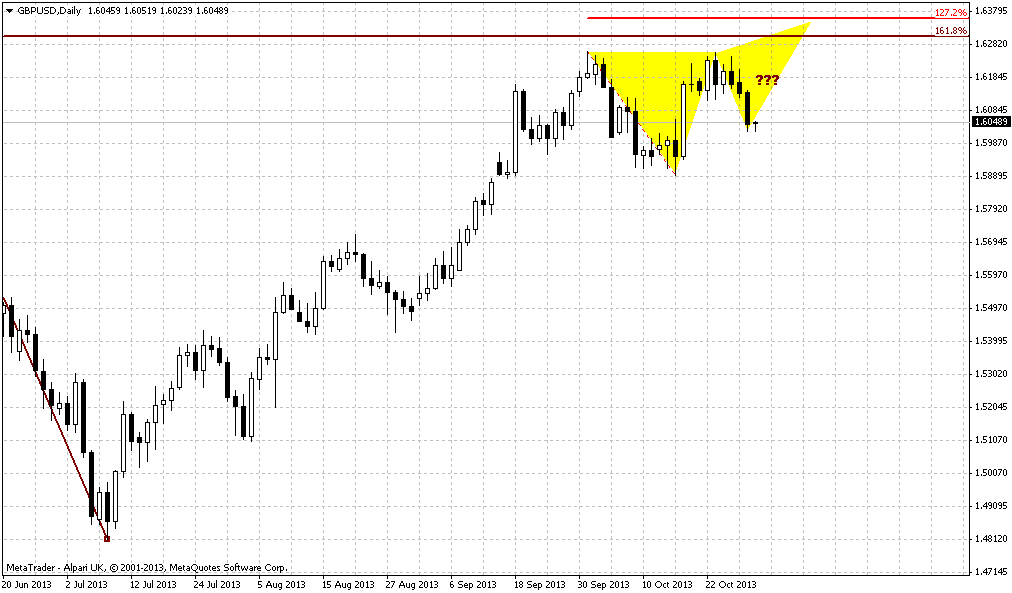
Daily
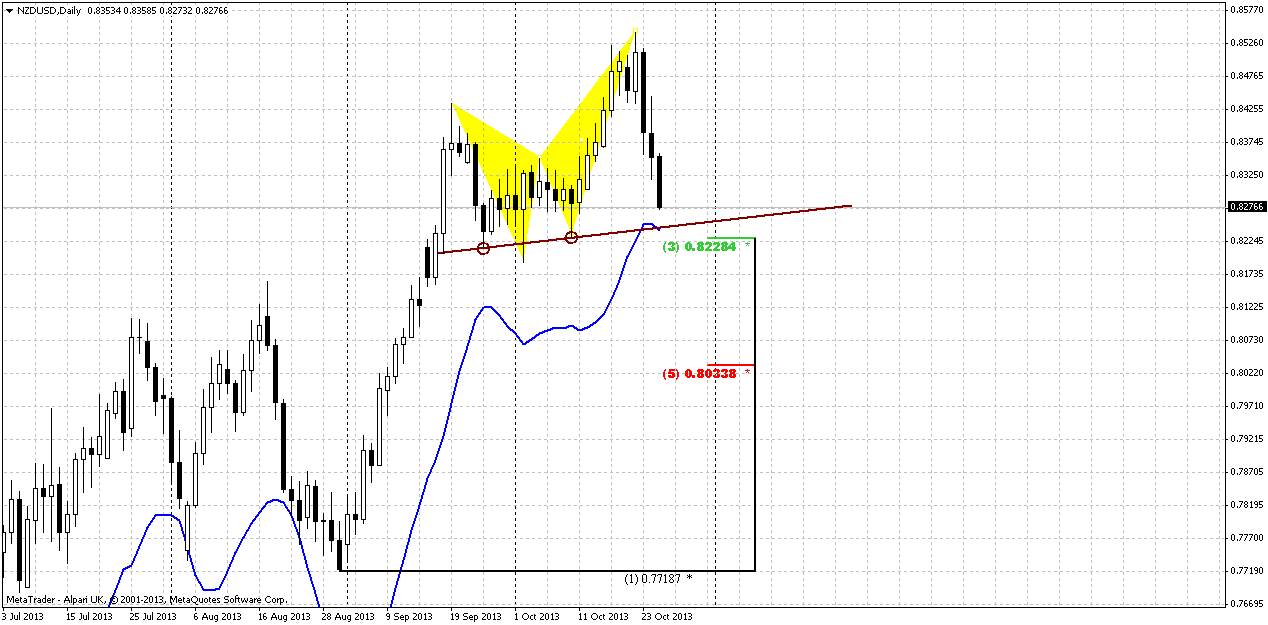
So, do you see here something guys? Beyond of what I’ve drawn. Engulfing pattern, butterfly – they are wonderful, but we need something more… Something that could let us better understand, where is optimal area for short entry, where will be our focus? I suspect that this should be somewhere around 0.8375-0.8425. Try to answer on this question before you will read an answer below. Let it will be your homework, since our part of forum is educational…
Recall, that butterflies very often become a part of larger patterns, as wedges, 3-Drives and… yes, H&S. And I suspect that we could get one here. Upward action was really strong and solid. Market probably should show deep retracement up before any reversal. Second, neckline stands at Fib support and oversold and if market will proceed to normal Stretch pattern target – they should be in the middle between Oscillator Predictor bands that stand precisely somewhere around 0.84. Later, on 4-hour chart you’ll see another reason. But now it will be enough to know that we should be ready for deep retracement up and our level to watch for is around 0.84.
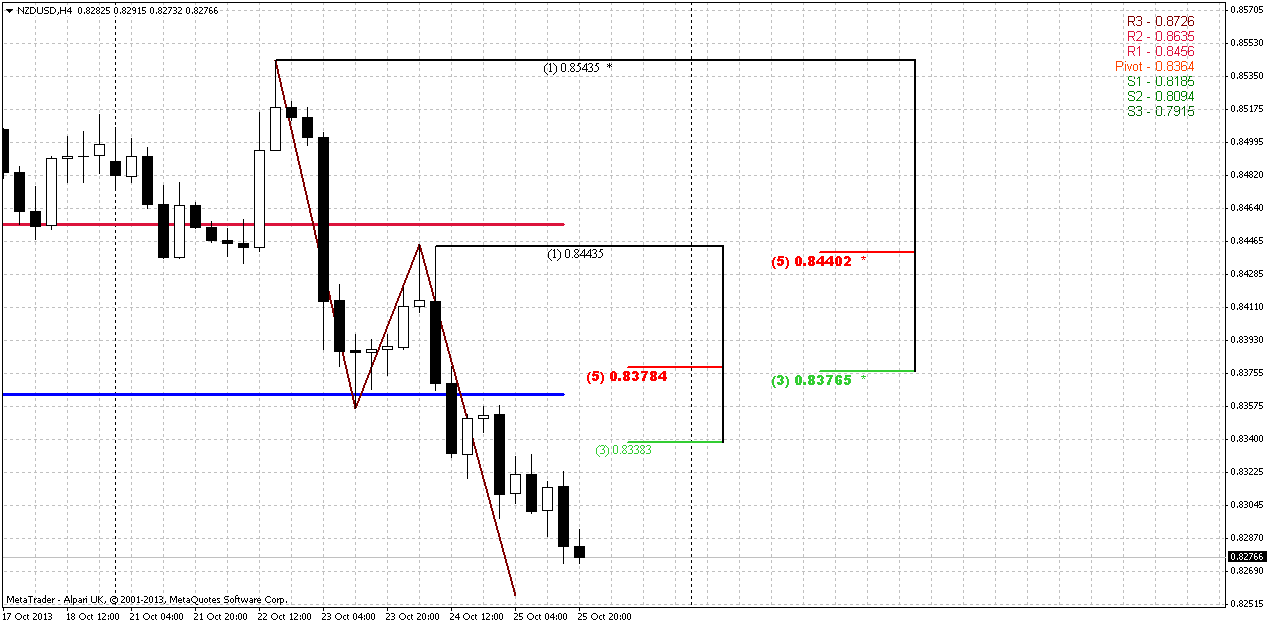
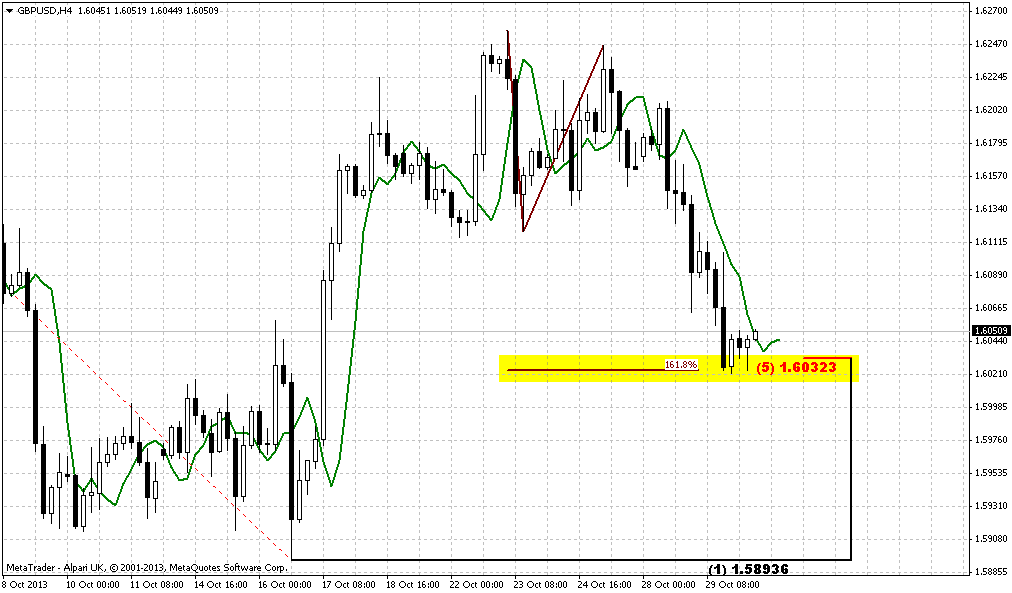
4-hour
Now just take a look at this magic. This is AB-CD that we’ve traded on previous week. Honestly speaking I’ve traded only once, till 0.618 target, but our assumption that market could continue move lower looks like was correct... Anyway, price is approaching to objective point. Interestingly that AB-CD target stands in Agreement with daily major 3/8 Support and oversold area. Hence this will be hard rock support. Since we will be at oversold, we’re not very interesting with 0.8340 resistance. Next resistance stands right at the lower level of our area – 0.8375-0.8425 and coincides with WPP of next week. But this is not all yet. We know that when market completes AB-CD, especially on oversold, retracement could be as far as to 0.618 level, i.e. - to 0.8440 Fib resistance and this is normal. This level coincides with WPR1, but should drift slightly lower, since market still has room till AB-CD target. I suspect that retracement up could be compounded and take shape of AB=CD, since we have K-resistance on the way up and hardly price will pass through it during first touch. Anyway, if we will have suspisions where to enter, as usual, we can apply scale-in. Take small short around K-resistance and if market will pass through it – major part of position around 0.618 Fib resistance.
Conclusion:
That’s being said, as you probably see now, NZD has clearest setup among other majors. By some reason solid reversal pattern here has appeared right at the moment when EUR has hit outstanding resistance range. Could it be some early hint on dollar appreciation? We’ll see…
The technical portion of Sive's analysis owes a great deal to Joe DiNapoli's methods, and uses a number of Joe's proprietary indicators. Please note that Sive's analysis is his own view of the market and is not endorsed by Joe DiNapoli or any related companies.
Today again, we will talk about NZD. Mostly because this is the one pair that has clear setup. We will not dive in New Zealand fundamentals because everybody undertsands that if any solid move will follow - it will follow due USD appreciation/depretiation, but probably not due NZD changes. Besides, since NZD also trades in relation to USD, and stands as a member of big family USD-related currency pairs, I can’t exclude that these patterns that now we see on NZD could become some sort of leading indicator for others. It is even more interesting, since particular these patterns have appeared on NZD right in the moment when EUR has hit monthly resistance cluster. Don’t be upset that we will not dedicate time to EUR. When you will read current research, you will understand why I have chosen NZD. Besides, we will track EUR in daily updates.
First, let’s recall what we’ve talked about previously. Our really big picture is based on big AB-CD pattern with target around 0.92. Market now stands above 0.618 and coiling slightly below 1.0 major objective point. When you see such situaiton this tells that it’s a great probability of upward move, since market just can’t remain in semi-position and gravitates to completion point of the pattern. Second our issue was bullish dynamic pressure. MACD shows bear trend, while market is forming the sequense of higher lows. Thus, I’ve drawn not a divergence, but just show you difference between trend and price action. Bullish dynamic pressure suggests taking out of previous highs at minimum. Finally here is obvious and nicely looking potential butterfly “Sell” pattern. The 1.618 extension stands slightly above AB=CD target and here is conclusion could be made that AB=CD target will be hit exactly by butterfly.
And finally Monthly Pivot. Market has tested it and moves above it, and in general – take a look that price more or less holds above broken highs. So current retracement looks like re-testing of broken 0.80 highs.
But this is really big picture. From tactical standpoint, we need to take a look at following chart. Actually here I mostly interesting with monthly stop grabber that has not been confirmed yet, since October is still lasting. But it is not significant probability that market will move right back above 0.8530 within next week. Minimum target is previous lows, i.e. 0.7680. Not bad hint, right? Now, combine this setup with those that we have on EUR – hard rock resistance around 1.38-1.39 and now reversal pattern on NZD. Also as I’ve read on forum, we have something bullish on dollar index.
But the magic of this issue is that if even price will take out these lows, our bullish setup could hold. By this potential move down, price could just accomplish downward AB=CD pattern and still hold the harmony of large AB-CD and even will not erase butterfly, we’ll see. Here market has reached MPR1, so we at resistance. Now let’s go further to weekly chart...
Weekly
This chart gives a bit more details. Although trend holds bullish here still, but monthly grabber here takes the shape of perfect bearish engulfing pattern, that we like to deal with. Invalidation point obviously is the same – the high at 0.8543. Besides of MPR1 market also has accomplished upward ultimate 1.618 AB=CD target.
As we’ve estimated patterns and possible direction, we need to understand how to open position.
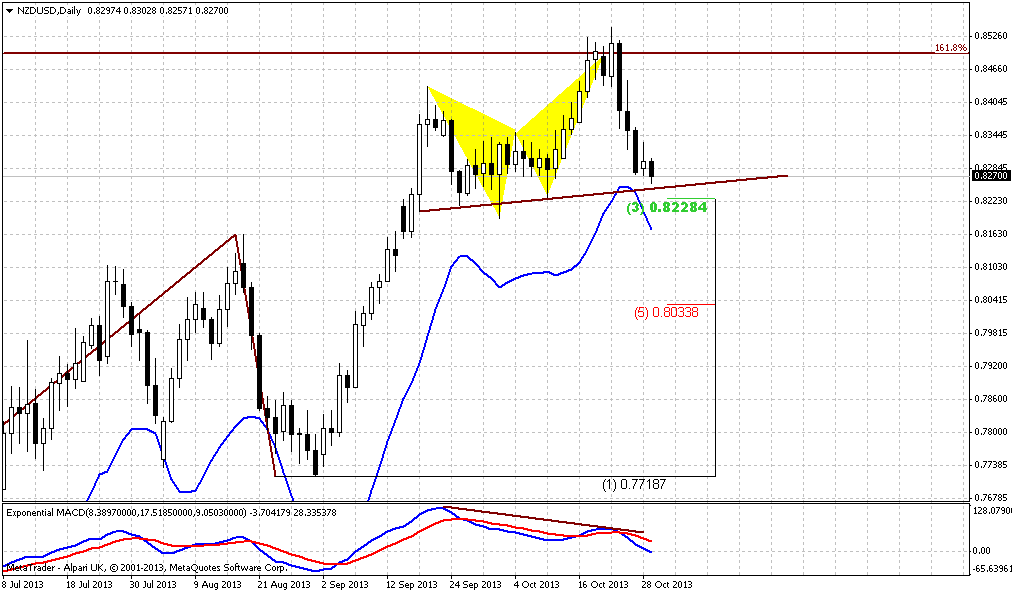
Daily
So, do you see here something guys? Beyond of what I’ve drawn. Engulfing pattern, butterfly – they are wonderful, but we need something more… Something that could let us better understand, where is optimal area for short entry, where will be our focus? I suspect that this should be somewhere around 0.8375-0.8425. Try to answer on this question before you will read an answer below. Let it will be your homework, since our part of forum is educational…
Recall, that butterflies very often become a part of larger patterns, as wedges, 3-Drives and… yes, H&S. And I suspect that we could get one here. Upward action was really strong and solid. Market probably should show deep retracement up before any reversal. Second, neckline stands at Fib support and oversold and if market will proceed to normal Stretch pattern target – they should be in the middle between Oscillator Predictor bands that stand precisely somewhere around 0.84. Later, on 4-hour chart you’ll see another reason. But now it will be enough to know that we should be ready for deep retracement up and our level to watch for is around 0.84.
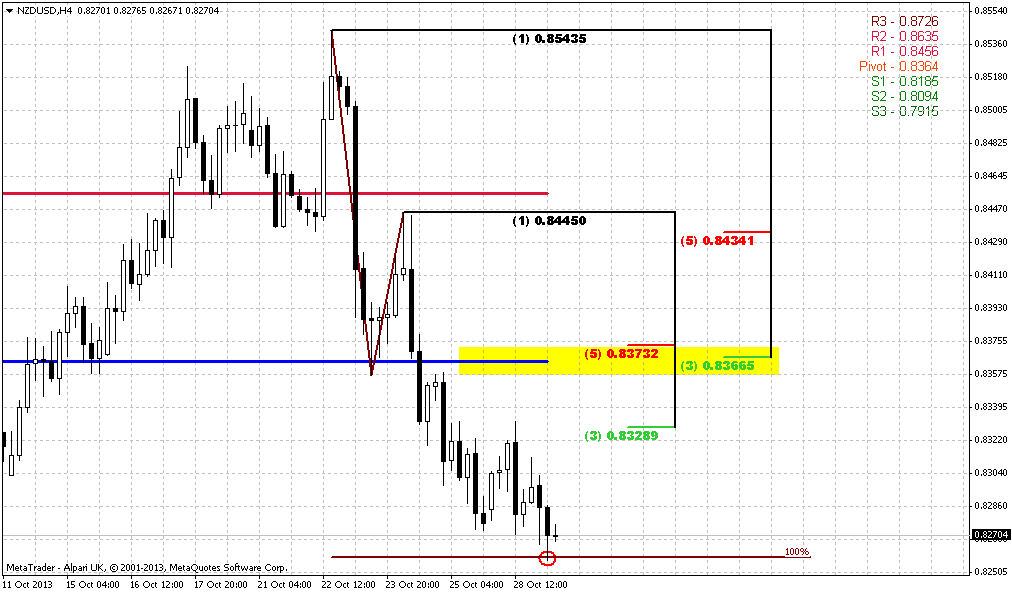
4-hour
Now just take a look at this magic. This is AB-CD that we’ve traded on previous week. Honestly speaking I’ve traded only once, till 0.618 target, but our assumption that market could continue move lower looks like was correct... Anyway, price is approaching to objective point. Interestingly that AB-CD target stands in Agreement with daily major 3/8 Support and oversold area. Hence this will be hard rock support. Since we will be at oversold, we’re not very interesting with 0.8340 resistance. Next resistance stands right at the lower level of our area – 0.8375-0.8425 and coincides with WPP of next week. But this is not all yet. We know that when market completes AB-CD, especially on oversold, retracement could be as far as to 0.618 level, i.e. - to 0.8440 Fib resistance and this is normal. This level coincides with WPR1, but should drift slightly lower, since market still has room till AB-CD target. I suspect that retracement up could be compounded and take shape of AB=CD, since we have K-resistance on the way up and hardly price will pass through it during first touch. Anyway, if we will have suspisions where to enter, as usual, we can apply scale-in. Take small short around K-resistance and if market will pass through it – major part of position around 0.618 Fib resistance.
Conclusion:
That’s being said, as you probably see now, NZD has clearest setup among other majors. By some reason solid reversal pattern here has appeared right at the moment when EUR has hit outstanding resistance range. Could it be some early hint on dollar appreciation? We’ll see…
The technical portion of Sive's analysis owes a great deal to Joe DiNapoli's methods, and uses a number of Joe's proprietary indicators. Please note that Sive's analysis is his own view of the market and is not endorsed by Joe DiNapoli or any related companies.

")

