Sive Morten
Special Consultant to the FPA
- Messages
- 18,664
Fundamentals
Technical picture as on EUR as on GBP stands boring a bit, as volatility has dropped significantly, long-term charts stand without a changing more than 4 weeks in a row. Right now fundamental background is important as never and sooner rather than later charts will show the picture of new fundamental situation on the markets.
Now recent Fed statement stands in focus and here we have some moments, that match to our fundamental view but a bit surprising to the market.
As Reuters reports - The dollar stood tall on Thursday after the U.S. Federal Reserve cut rates by 25 basis points, as expected, but its chairman signalled a higher bar for future rate cuts.
The U.S. central bank, on a 7-3 vote, lowered the Fed funds target rate on Wednesday to a range of 1.75% to 2.00% “in light of the implications of global developments for the economic outlook.”
Here is what we talked about in our recent weekly report:
However, Fed Chairman Jerome Powell described U.S. prospects as “favourable” and the rate move as “insurance.” He did not rule out future cuts, but his remarks were not as dovish as markets had hoped for which lifted bond yields and the dollar.
Projections published by the Fed showed policymakers, at the median, expected rates to stay within the new range through 2020, while futures markets have priced in at least another cut.
Fed Chair Jerome Powell said that “what we think we are facing here is a situation which can be addressed, which should be addressed, with moderate adjustments to the federal funds rate.” Powell noted that the U.S. labor market was strong and inflation was likely to return to the Fed’s 2% annual goal.
“In the short term, this hawkish cut should still see the dollar well-bid, given that the path of interest rates outlined by the Fed is not close to that priced into the markets,” said John Veils, Americas FX and macro strategist at BNY Mellon.
“The USD is still the highest-yielding currency in the G10 world, a sign that it is also the least unattractive house in an increasingly blighted neighbourhood.”
Subsequently, the Swiss National Bank, the Bank of England and the Bank of Japan all kept their policies on hold. Norges Bank increased its key policy rate, moving its rates in the opposite direction of the United States and European Union.
Central banks “came off a really bad month of August for risk and for sentiment,” said Brian Daingerfield, macro strategist at RBS Securities in Stamford, Connecticut.
“But as September dawned, some of the worst U.S.-China trade escalation has pulled back, the market has been pricing out the possibility of a near-term no-deal Brexit as we prepared for elections in the UK. Some of the economic data have brightened a bit,” he added.
The central banks are generally “kind of holding their breath and holding their fire in terms of fully acknowledging that further easing could come down the road but not moving in a proactive way towards additional easing,” said Daingerfield.
“What we’re looking at is brewing central-bank divergence,” said Chris Weston, head of research at brokerage Pepperstone Group in Melbourne. “We’re starting to see signs of that resonating in currency markets.”
Sterling hit a two-month high of $1.2566 against the greenback, after European Commission President Jean-Claude Juncker said he thought Brussels could reach a deal with Britain to leave the European Union.
“Other central banks are not in easing mode as the Fed has been this week and hopes of a breakthrough in trade talks between the United States and China is also dampening some of the safe-haven appeal of the dollar,” said Thu Lan Nguyen, a foreign exchange analyst at Commerzbank.
Investors are also focused on U.S.-China trade talks in Washington, aimed at laying the groundwork for high-level discussions next month.
However, most traders are cautious. Few signs of progress have emerged and with a wide gulf between both sides remaining, the issue is weighing on the recent risk-on mood.
“If you look at the Aussie dollar or renminbi it’s faded,” said Joe Capurso, senior currency strategist at the Commonwealth Bank of Australia in Sydney.
“”I think market participants are going to need something concrete to really rally... at the moment there’s just not enough.”
The U.S. dollar erased earlier losses and rose on Friday after investors cut back short positions in the greenback as concerns about slower global growth prospects and political tensions boosted its safe-haven appeal.
But market watchers say the slowdown in global growth and increased tensions following the weekend attacks on Saudi oil facilities were making the dollar more attractive, despite a dovish policy stance from policymakers.
“As long as the outlook for global growth remains uncertain and geopolitical tensions don’t ease, we expect the current trends in the FX market will continue,” said Richard Falkenhall, a senior FX strategist at SEB. “Our forecasts point to further USD strength, while smaller currencies remain weak this year.”
Indeed, U.S.-China trade deal appeared elusive on Friday after Chinese officials unexpectedly canceled a visit to farms in Montana and Nebraska as deputy trade negotiators wrapped up two days of negotiations in Washington.
Chinese officials were expected to visit U.S. farmers next week as a goodwill gesture, but canceled to return to China sooner than originally scheduled, agriculture organizations from Montana and Nebraska said.
The United States had removed tariffs overnight from over 400 Chinese products in response to requests from U.S. companies.
Trade experts, executives and government officials in both countries say that even if the September and October talks produced an interim deal, the U.S.-China trade war has hardened into a political and ideological battle that runs far deeper than tariffs and could take years to resolve.
The Chinese delegation did not present any new proposals on core structural issues including intellectual property protections, forced technology transfers, industrial subsidies and other trade barriers, said a person briefed on the talks.
“The conclusion from the U.S. side was that we’re not close to an agreement,” the person said.
Speaking on GBP performance - Sterling hit a two-month high of $1.2566 against the greenback, after European Commission President Jean-Claude Juncker said he thought Brussels could reach a deal with Britain to leave the European Union.
Thus, this is shortly events that we've got this week. Let's take a look what has changed on the markets.
First is - expectations on rate change in 2019 has changed and chances that Fed will hold the rate at current level increases.

Source: cmegroup.com
But what is more important is recent CFTC report that gives us very important answer on investors' attitude to recent Fed statement. As you can see, net short position has been increased almost for 20K contracts. As no progress stands in US/Sino negotiations, demand for US dollar could return next week.

Source: cftc.gov
Charting by Investing.com
That's being said, it seems that recent week was mostly bearish for EUR rather than bullish, despite that EUR/USD has not shown any major breakout and spent all time in tight range.
Still, on a background of relatively positive Fed view on US economy perspectives, blur chances on another rate cut this year and failure of positive breakout in US/China negotiations keeps small room for EUR growth on next week. Recent CFTC data on EUR net position just confirms this theory. And, in general - speculators boosted their net long bets on the U.S. dollar in the latest week to a five-week high, according to calculations by Reuters and Commodity Futures Trading Commission data released on Friday.
In a wider measure of dollar positioning that includes net contracts on the New Zealand dollar, Mexican peso, Brazilian real and Russian ruble, the greenback posted a net long position of $15.40 billion in the week ended Sept. 17, compared with $12.58 billion the previous week.
The strength of the U.S. economy relative to the rest of the world and low interest rates around the globe have led investors to favor the U.S. dollar.
Also we have to keep in mind all important moments that we've discussed in previous two reports, such as ECB statement and EU bankers disagreement on QE new round, big difference in EU and US economy statistics and other stuff. In addition to the subjects that we discuss today, it creates the whole picture around EUR/USD.
Technicals
Monthly
Due very tight trading range we do not have the break of major tendency here, which is moderately bearish, as by price action as by MACD trend. As we've expected market hits YPS1 at 1.0950 and shows normal pullback after first touch.
August performance by long upper spike shows existing of pretty sufficient amount of offers above the market .September is almost an inside month by far. As we've said earlier, here we could recognize downside narrow channel and market stands accurately inside of it.
In longer-term view, take a look that EUR stands for a long time below upper border of rectangle, while normally, bullish market has to jump up after re-testing it. Dropping back inside rectangle and standing there, although near the border, is a sign of weakness. Besides, neither big support nor oversold levels stand around and it is free space till 1.03 lows. The only support is YPS1 where market stands right now. Once market will drop below it - automatically it will mean that road to 1.03 lows will be open.

Weekly
We keep weekly chart comments without a change as well. Market has to break out from current range to add something new as to monthly as to weekly time frames.
This week data has not enough power to complete the breakout and price holds inside the channel by far, despite breakout of major 5/8 Fib support of 1.1185.
Technically previous upward action was reaction on COP target, and downside action that we see right now should be continuation of major tendency to the next target, which is OP at 1.05 area. Now downward action is held by Yearly Pivot Support 1 and channel's border. Once response will be over, we will keep an eye on downside continuation. EUR has pretty much room to fluctuate inside the channel as upper border stands around 1.13 area. To break the bearish context EUR has to climb above 1.14 top.

Daily
On Friday bullish sentiment was supported by expectation some positive breakout in US - China negotiations, but nevertheless market was not able to keep the tendency and breakthrough daily resistance, as we've suggested. Although vital level of 1.10 area has not been broken yet, but probably it will happen on Monday morning, when news will be priced-in.
By recent drop, EUR almost has erased the engulfing pattern, showing second downside deeper pullback after major one. This is bad sign for the pattern because of irrational price action.
Too long flat standing below major K-area is starting look like bearish dynamic pressure. Trend has turned bullish rather long time ago but price action still stands flat without continuation. On dollar index this looks even brighter.
We do not want to run ahead of the train and do not hurry with taking short position as 1.10 area is still holds the market. But, at the same time, we cancel our bullish intraday setups. in fact, on Friday market almost has formed bearish reversal session. Trying to catch some trade inside this consolidation becomes too risky journey.

Intraday
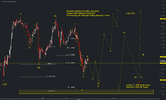
Taking in consideration new inputs discussed above, we should consider deeper targets first. Trend stands bearish on 4H chart and you can see why I call this action "irrational". Take a look at circle lows - that was a retracement after engulfing has been formed. Once it has been completed, bullish market should had to show upside breakout and continuation. But instead of that EUR has dropped deeper. This is not normal.
Thus, as it is long run to the 1.09 lows, we consider first AB-CD targets. Market has hit COP on Friday, next one is OP, it stands around 1.0956:

On 1H chart market indeed has shown upside action on Friday morning, as we've suggested but only to recent tops and no breakout has followed. Result of this action was "222" Sell pattern that has triggered massive sell-off and Reversal candle.
Thus, here we have smaller "222" Buy, but it's minimum target already has been reached at 3/8 Fib resistance area. Recent sell-off was rather fast and it has not bad momentum. Thus, for intraday traders, it is possible to consider short entry at some resistance levels if market will get there.
P.S. Here, by the way we have puny B&B "Sell", based on recent thrust down. But it is very shot-term setup.

Conclusion:
Fundamental events of last week add new bearish notes. EUR inability to break daily K-resistance has become a bad surprise and week probably will start on negative mood. Although theoretically vital levels are still hold and on daily chart we're still waiting of 1.10 breakout - overall situation doesn't inspire to take new longs as well. On intraday charts it is even possible to consider short-positions at resistance levels.
The technical portion of Sive's analysis owes a great deal to Joe DiNapoli's methods, and uses a number of Joe's proprietary indicators. Please note that Sive's analysis is his own view of the market and is not endorsed by Joe DiNapoli or any related companies.
Technical picture as on EUR as on GBP stands boring a bit, as volatility has dropped significantly, long-term charts stand without a changing more than 4 weeks in a row. Right now fundamental background is important as never and sooner rather than later charts will show the picture of new fundamental situation on the markets.
Now recent Fed statement stands in focus and here we have some moments, that match to our fundamental view but a bit surprising to the market.
As Reuters reports - The dollar stood tall on Thursday after the U.S. Federal Reserve cut rates by 25 basis points, as expected, but its chairman signalled a higher bar for future rate cuts.
The U.S. central bank, on a 7-3 vote, lowered the Fed funds target rate on Wednesday to a range of 1.75% to 2.00% “in light of the implications of global developments for the economic outlook.”
Here is what we talked about in our recent weekly report:
However, Fed Chairman Jerome Powell described U.S. prospects as “favourable” and the rate move as “insurance.” He did not rule out future cuts, but his remarks were not as dovish as markets had hoped for which lifted bond yields and the dollar.
Projections published by the Fed showed policymakers, at the median, expected rates to stay within the new range through 2020, while futures markets have priced in at least another cut.
Fed Chair Jerome Powell said that “what we think we are facing here is a situation which can be addressed, which should be addressed, with moderate adjustments to the federal funds rate.” Powell noted that the U.S. labor market was strong and inflation was likely to return to the Fed’s 2% annual goal.
“In the short term, this hawkish cut should still see the dollar well-bid, given that the path of interest rates outlined by the Fed is not close to that priced into the markets,” said John Veils, Americas FX and macro strategist at BNY Mellon.
“The USD is still the highest-yielding currency in the G10 world, a sign that it is also the least unattractive house in an increasingly blighted neighbourhood.”
Subsequently, the Swiss National Bank, the Bank of England and the Bank of Japan all kept their policies on hold. Norges Bank increased its key policy rate, moving its rates in the opposite direction of the United States and European Union.
Central banks “came off a really bad month of August for risk and for sentiment,” said Brian Daingerfield, macro strategist at RBS Securities in Stamford, Connecticut.
“But as September dawned, some of the worst U.S.-China trade escalation has pulled back, the market has been pricing out the possibility of a near-term no-deal Brexit as we prepared for elections in the UK. Some of the economic data have brightened a bit,” he added.
The central banks are generally “kind of holding their breath and holding their fire in terms of fully acknowledging that further easing could come down the road but not moving in a proactive way towards additional easing,” said Daingerfield.
“What we’re looking at is brewing central-bank divergence,” said Chris Weston, head of research at brokerage Pepperstone Group in Melbourne. “We’re starting to see signs of that resonating in currency markets.”
Sterling hit a two-month high of $1.2566 against the greenback, after European Commission President Jean-Claude Juncker said he thought Brussels could reach a deal with Britain to leave the European Union.
“Other central banks are not in easing mode as the Fed has been this week and hopes of a breakthrough in trade talks between the United States and China is also dampening some of the safe-haven appeal of the dollar,” said Thu Lan Nguyen, a foreign exchange analyst at Commerzbank.
Investors are also focused on U.S.-China trade talks in Washington, aimed at laying the groundwork for high-level discussions next month.
However, most traders are cautious. Few signs of progress have emerged and with a wide gulf between both sides remaining, the issue is weighing on the recent risk-on mood.
“If you look at the Aussie dollar or renminbi it’s faded,” said Joe Capurso, senior currency strategist at the Commonwealth Bank of Australia in Sydney.
“”I think market participants are going to need something concrete to really rally... at the moment there’s just not enough.”
The U.S. dollar erased earlier losses and rose on Friday after investors cut back short positions in the greenback as concerns about slower global growth prospects and political tensions boosted its safe-haven appeal.
But market watchers say the slowdown in global growth and increased tensions following the weekend attacks on Saudi oil facilities were making the dollar more attractive, despite a dovish policy stance from policymakers.
“As long as the outlook for global growth remains uncertain and geopolitical tensions don’t ease, we expect the current trends in the FX market will continue,” said Richard Falkenhall, a senior FX strategist at SEB. “Our forecasts point to further USD strength, while smaller currencies remain weak this year.”
Indeed, U.S.-China trade deal appeared elusive on Friday after Chinese officials unexpectedly canceled a visit to farms in Montana and Nebraska as deputy trade negotiators wrapped up two days of negotiations in Washington.
Chinese officials were expected to visit U.S. farmers next week as a goodwill gesture, but canceled to return to China sooner than originally scheduled, agriculture organizations from Montana and Nebraska said.
The United States had removed tariffs overnight from over 400 Chinese products in response to requests from U.S. companies.
Trade experts, executives and government officials in both countries say that even if the September and October talks produced an interim deal, the U.S.-China trade war has hardened into a political and ideological battle that runs far deeper than tariffs and could take years to resolve.
The Chinese delegation did not present any new proposals on core structural issues including intellectual property protections, forced technology transfers, industrial subsidies and other trade barriers, said a person briefed on the talks.
“The conclusion from the U.S. side was that we’re not close to an agreement,” the person said.
Speaking on GBP performance - Sterling hit a two-month high of $1.2566 against the greenback, after European Commission President Jean-Claude Juncker said he thought Brussels could reach a deal with Britain to leave the European Union.
Thus, this is shortly events that we've got this week. Let's take a look what has changed on the markets.
First is - expectations on rate change in 2019 has changed and chances that Fed will hold the rate at current level increases.
Source: cmegroup.com
But what is more important is recent CFTC report that gives us very important answer on investors' attitude to recent Fed statement. As you can see, net short position has been increased almost for 20K contracts. As no progress stands in US/Sino negotiations, demand for US dollar could return next week.
Source: cftc.gov
Charting by Investing.com
That's being said, it seems that recent week was mostly bearish for EUR rather than bullish, despite that EUR/USD has not shown any major breakout and spent all time in tight range.
Still, on a background of relatively positive Fed view on US economy perspectives, blur chances on another rate cut this year and failure of positive breakout in US/China negotiations keeps small room for EUR growth on next week. Recent CFTC data on EUR net position just confirms this theory. And, in general - speculators boosted their net long bets on the U.S. dollar in the latest week to a five-week high, according to calculations by Reuters and Commodity Futures Trading Commission data released on Friday.
In a wider measure of dollar positioning that includes net contracts on the New Zealand dollar, Mexican peso, Brazilian real and Russian ruble, the greenback posted a net long position of $15.40 billion in the week ended Sept. 17, compared with $12.58 billion the previous week.
The strength of the U.S. economy relative to the rest of the world and low interest rates around the globe have led investors to favor the U.S. dollar.
Also we have to keep in mind all important moments that we've discussed in previous two reports, such as ECB statement and EU bankers disagreement on QE new round, big difference in EU and US economy statistics and other stuff. In addition to the subjects that we discuss today, it creates the whole picture around EUR/USD.
Technicals
Monthly
Due very tight trading range we do not have the break of major tendency here, which is moderately bearish, as by price action as by MACD trend. As we've expected market hits YPS1 at 1.0950 and shows normal pullback after first touch.
August performance by long upper spike shows existing of pretty sufficient amount of offers above the market .September is almost an inside month by far. As we've said earlier, here we could recognize downside narrow channel and market stands accurately inside of it.
In longer-term view, take a look that EUR stands for a long time below upper border of rectangle, while normally, bullish market has to jump up after re-testing it. Dropping back inside rectangle and standing there, although near the border, is a sign of weakness. Besides, neither big support nor oversold levels stand around and it is free space till 1.03 lows. The only support is YPS1 where market stands right now. Once market will drop below it - automatically it will mean that road to 1.03 lows will be open.
Weekly
We keep weekly chart comments without a change as well. Market has to break out from current range to add something new as to monthly as to weekly time frames.
This week data has not enough power to complete the breakout and price holds inside the channel by far, despite breakout of major 5/8 Fib support of 1.1185.
Technically previous upward action was reaction on COP target, and downside action that we see right now should be continuation of major tendency to the next target, which is OP at 1.05 area. Now downward action is held by Yearly Pivot Support 1 and channel's border. Once response will be over, we will keep an eye on downside continuation. EUR has pretty much room to fluctuate inside the channel as upper border stands around 1.13 area. To break the bearish context EUR has to climb above 1.14 top.
Daily
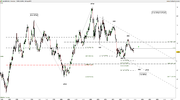
On Friday bullish sentiment was supported by expectation some positive breakout in US - China negotiations, but nevertheless market was not able to keep the tendency and breakthrough daily resistance, as we've suggested. Although vital level of 1.10 area has not been broken yet, but probably it will happen on Monday morning, when news will be priced-in.
By recent drop, EUR almost has erased the engulfing pattern, showing second downside deeper pullback after major one. This is bad sign for the pattern because of irrational price action.
Too long flat standing below major K-area is starting look like bearish dynamic pressure. Trend has turned bullish rather long time ago but price action still stands flat without continuation. On dollar index this looks even brighter.
We do not want to run ahead of the train and do not hurry with taking short position as 1.10 area is still holds the market. But, at the same time, we cancel our bullish intraday setups. in fact, on Friday market almost has formed bearish reversal session. Trying to catch some trade inside this consolidation becomes too risky journey.
Intraday
Taking in consideration new inputs discussed above, we should consider deeper targets first. Trend stands bearish on 4H chart and you can see why I call this action "irrational". Take a look at circle lows - that was a retracement after engulfing has been formed. Once it has been completed, bullish market should had to show upside breakout and continuation. But instead of that EUR has dropped deeper. This is not normal.
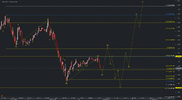
Thus, as it is long run to the 1.09 lows, we consider first AB-CD targets. Market has hit COP on Friday, next one is OP, it stands around 1.0956:
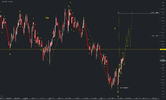
On 1H chart market indeed has shown upside action on Friday morning, as we've suggested but only to recent tops and no breakout has followed. Result of this action was "222" Sell pattern that has triggered massive sell-off and Reversal candle.
Thus, here we have smaller "222" Buy, but it's minimum target already has been reached at 3/8 Fib resistance area. Recent sell-off was rather fast and it has not bad momentum. Thus, for intraday traders, it is possible to consider short entry at some resistance levels if market will get there.
P.S. Here, by the way we have puny B&B "Sell", based on recent thrust down. But it is very shot-term setup.
Conclusion:
Fundamental events of last week add new bearish notes. EUR inability to break daily K-resistance has become a bad surprise and week probably will start on negative mood. Although theoretically vital levels are still hold and on daily chart we're still waiting of 1.10 breakout - overall situation doesn't inspire to take new longs as well. On intraday charts it is even possible to consider short-positions at resistance levels.
The technical portion of Sive's analysis owes a great deal to Joe DiNapoli's methods, and uses a number of Joe's proprietary indicators. Please note that Sive's analysis is his own view of the market and is not endorsed by Joe DiNapoli or any related companies.
Last edited: