FOREX PRO Weekly September 24-28, 2012

how the hell did i miss this,
its pinned off the 382 so it may continue back up?
fgpa101.PNG
So the lesson here is how much of a previous swing do i use as the xa leg
?
 
Last edited:
update
View attachment 6753
but evrythng looks sooo bearish

I strongly believe market will hit 1.28 area coz at least 3 patterns targeting this area. Butterfly on H1, 3 Drive and ABCD on H4. Moreover, SMA 200 day also around 1.28 area. So now it will depend on market to behave accordingly. But for me, I'm bearish till 1.28 area.
 
Last edited:
well that spike down wss lower thasn my c point so i guess my harmonic shape becomes invalid for target prediction, even tho its now just below my PRZ?
as confused as ever!!!!
 
ok, there was a spanish government budget announcement at 16:26 saying they met or exceeded all EU recommendations. this announcement does not appear on economic calendar!, apart from a related one at 13:00. the dip must be a knee jerk reaction?
so, can you answer two questions for me Sir Sive?
1) does this quick dip invalidate the structure shown in my post 42¬ with the c point being undermined for a moment-i can see why it would invalidate, yet i could also argue that such a brief moment does not count against the structure!!
2) how can we prepare for a dip like this? does it mean we can only realistically take positions with much larger stop loss?
much appreciated!
 
Hey everyone,

Looks like market once again touched 161.8 extension last night but failed to touch 100% expansion of AB-CD pattern.

Market showed a bit of thrust move on intraday charts??

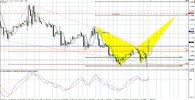
Sive, could this be the Butterfly "SELL" pattern on the hourly chart? I am skeptical of this pattern because as you can see, the second wing of the butterfly once again touched 161.8 extension and even went lower than the first wing of the butterfly!

My question is if this is a valid Butterfly "SELL" pattern? Would this pattern be negated since the second wing went lower than the first wing but DIDN'T close below it? It simply just touched it and went back up so I am just confused if it is a valid pattern since the candle DID NOT close below the first wing of the butterfly?

Thanks a lot, Sive. I appreciate it..

Best,
Brandon

butterfly.jpg
 
ok, there was a spanish government budget announcement at 16:26 saying they met or exceeded all EU recommendations. this announcement does not appear on economic calendar!, apart from a related one at 13:00. the dip must be a knee jerk reaction?
so, can you answer two questions for me Sir Sive?
1) does this quick dip invalidate the structure shown in my post 42¬ with the c point being undermined for a moment-i can see why it would invalidate, yet i could also argue that such a brief moment does not count against the structure!!
2) how can we prepare for a dip like this? does it mean we can only realistically take positions with much larger stop loss?
much appreciated!

Hi Quinch, well I'm sorry but I'm a bit confused what chart do you mean. If you're speaking about upside AB-CD, then, probably this is not the best pattern right now, since we have C point below A. Sometimes this could be used, but mostly for Resistance calculation, but not for targets.
Would you post the chart again, that you would like to discuss. And another request - could you please add more transparency on your charts, since it's very difficult to read it. Shift it to black and white probably, and delete all unnesessary tools - indicators, lines etc...

Hey everyone,

Looks like market once again touched 161.8 extension last night but failed to touch 100% expansion of AB-CD pattern.

Market showed a bit of thrust move on intraday charts??

Sive, could this be the Butterfly "SELL" pattern on the hourly chart? I am skeptical of this pattern because as you can see, the second wing of the butterfly once again touched 161.8 extension and even went lower than the first wing of the butterfly!

My question is if this is a valid Butterfly "SELL" pattern? Would this pattern be negated since the second wing went lower than the first wing but DIDN'T close below it? It simply just touched it and went back up so I am just confused if it is a valid pattern since the candle DID NOT close below the first wing of the butterfly?

Thanks a lot, Sive. I appreciate it..

Best,
Brandon

Hi Brandon,
Although some traders apply such butterflies, but I prefer to look for butterfly "Sell" on tops, since butterfly is mostly reversal pattern.
Second, as you've correctly mentioned - we have low beyond initial swing of Butterfly and that is out of the classical rule.
Have you read chapter in Forex Military School about harmonic patterns? If not - take a look, you will probably find a lot of usefull staff.

Thanks a lot, Sive!

Hope you and your family have a great weekend.

Cheers.
 
The DiNapoli Moving Averages are
3x3: 3 period Simple Moving Average displaced forward for 3 periods.
7x5: 7 period Simple Moving Average displaced forward for 5 periods.
25x5: 25 period Simple Moving Average displaced forward for 5 periods.

All the best

Michael

are these daily, 4h and hourly in that order? referring to DiNapoli SMA info in page 4

No, they apply in all timeframes

You should work through the while Forex School section but this chapter explains DMA...
https://www.forexpeacearmy.com/fore...art-v-using-moving-averages-displaced-ma.html

Another indicator used here is the FibTree that I posted in this thread. It is used to display Fibonacci retracements.
https://www.forexpeacearmy.com/forex-forum/sive-morten-analysis/19274-fibtree-indicator.html

All the best

Michael
 
Hmmm thanks for your analysis Sive I think I will skip the buy engulfing candle on D1 and wait for a nice short signal entry again(watch this space)

P.S. short I took last week gave 240pips entry was short @1.3090 1st TP was 200EMA on D1 @ 1.2850 2nd TP I got out manually after price broke yesterdays high:)
 
Back
Top