Sive Morten
Special Consultant to the FPA
- Messages
- 18,754
Monthly
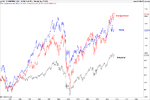
Guys, difference between close price of current week and previous week stands just for 1 pippet. Thus, this is really nothing to add on monthly chart and I hold previous analysis intact. Since we’ve discussed fundamental picture with details on previous week, today I just want to say that markets mostly indecision accross the board. Yes, price is moving, people buys and sells, but price stands in range and this trading stands with reduced volumes. I have some worrings that something could happen in October. There are different reasons for that and unfortunately all of them are blur. But here is what I see. First is stock market. It definitely overblown and there is a definite bubble on it. We’ve talked about it aready and it is very probable that big part of every monthly 85Bln are there. There are some signs of weakness are started to appear on equities. First, is classical issue – you’ll find clear divergence between DJIA, DJ Transport and DJ Utility. Second is – Nikkei225 and FTSE 100 have not created new high that now could be seen on NASDAQ and S&P500. Finally, if will take a look at DJIA and trading volumes, you’ll see 2.5 times greater volume on big pluge right from the current top. On weekly chart there are a lot of weeks where selling volume greater than average one and in general, in recent time trading volume increases when market declinces. Also top on weekly chart is a W&R with just huge volume and close price right near the open. This could be an early signal that large players have started to sell. Then, the logical question, where they put their money? Definitely not in equities and not in the bonds, since they stand at minimum yields. I’ve found only last chance for that – gold. Gold stands not too low, but not too high – around 1340. Thus, to start buying gold they need to drop it a bit – reduce price and simultaneously hit out existing buyers by triggering their stops. This puts us to conclusion that we should see as dropping of stock market as gold market. How this could happen? There is only one possible scenario for that, I suppose. If Fed Reserve will announce contraction of QE in October. In this case equities will drop, since there will not be any more inflow with easy money and buble will start to blow off. At the same time gold will drop, because currently inflation is anemic and closing 85 Bln inflow will make the risk of inflation even less. Thus, big whales should have some time lag, they need to sell stocks before market will drop, thus, to transfer money into gold. And signs on stock market probably already show that they gradually are started to sell. Thus, they probably will mostly finish to sell right before October FOMC meeting. Also, it is significant that something should happen definitely in October. Because there will not be a meeting in November and hardly they will start to shake markets in December, when financial year is closing, most corporation stands out of positions and do nothing on financial markets. This is a period of bonuses’ calculation before Christmas, but not phase of active trading.
So, continue logical chain, they need some trigger to announce contraction of QE program and they will have two major ones – NFP and preliminary GDP for 3rd quarter, since meeting will stand at 29-30 of October, and this data should be positive, I suppose. But understand me correctly. This is just assumption, if you want to trade with them, but not against them, you should create such thoughts and spend time on it, even if your conclusions will not be quite correct, they must be done. I do not want to say that this definitely will happen and has to happen, I just don’t know. But we need to keep in mind this and if something of that sort will appear we should do our best to catch our small piece of pie.
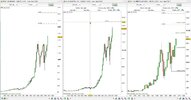
Now let’s go back to technical analysis. Our riddle with flag consolidation stands very close to its resolving probably. On monthly chart we have two major moments. First is market has moved above previous high (in red circle). This is important not only because this is high per se, but also because this was a previous failure upward breakout of consolidation. And as market has move right back above it – this tells that this probably is real move at this time. Second – market stands above 50% resistance level that has stopped move up early. I do not know how it will turn, but at least now picture looks bullish. Next monthly target is 1.3775-1.3830 area. It includes yearly pivot resistance1, 5/8 Fib resistance and minor 0.618 extension target of current AB-CD up. Other words, we have an Agreement around YPR1. Trend holds bullish here.

Weekly
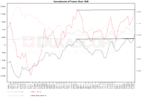
Weekly chart just confirms with small inside week that market participants do not hurry up with increasing their positions. Trend is still bullish here. Currently we have the only pattern here and this is butterfly “sell” and we still use AB=CD extension on monthly chart. Trend is bullish here. As market has passed through as MPR1 as MPR2 it solid challenge on continuation and it looks like that we should see it. Long term invalidation point is a low of butterlfy (in red circle). If market will move below it – it will not only erase butterfly but also put under question our monthly AB=CD. Trend also will shift bearish probably around this level. Take a look that we have really huge resistance cluster at 1.38-1.39 area. Recall monthly target and Fib level and now add 1.27 butterfly target, weekly overbought and inner 1.618 AB=CD target. But fortunately we have pretty a lot of room till this area. Second, butterfly pattern could be a long-play one. May be there will be some retracement around 1.27 extension, but who says that it can’t proceed to 1.618? And guys, I have suspicious that this will be the case.
Recall how 2 weeks ago we’ve talked about EUR swings on weekly chart. EUR usually shows AB=CD with very small BC leg. When it completes 100% of this AB=CD it shows significant and wide retracement/consolidations. That is where we stand now and later it usually skyrockets to 1.618 of initial AB-CD. That is an area where 1.618 of our butterfly stands – around 1.42-1.43 This stands beyond a bit of our weekly analysis cycle and overbought but this is really thrilling perspective....
The thing that we do not want to see is a deep and stable return below previous highs around 1.3450 by reasons that we’ve discussed many times on daily time frame.

Daily
Here is sophisticated situation. Market stands in tight range just above nearest 3/8 support level and former WPP. As market shows so shy retracement after reaching of overbought level it could be treated as bullish sign. From other point of view, market has failed yesterday to continue upward action and pass through resistance and it is not at overbought any more. This makes me think that we still could get another leg down that we’ve discussed on previous week, to daily K-support and re-testing broken highs around 1.3420-1.3450 area. Trend holds bullish and by MACDP – price could touch it very soon. Thus, another moment to keep an eye on is possible bullish stop grabber on daily time frame.
Currently I do not see any interesting patterns right here. Previously we’ve talked about possible DRPO “Sell” LAL here and this opportunity has not been vanished totally yet. I do not have 3x3 DMA here, but if you will plot it, you’ll see that we’ve got close below and close above it by far. So we need second close below to get confirmation and I can’t exclude this possibility, mostly due to the failure of the market to pass higher on Friday.

4-hour
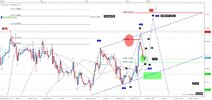
Here we have the same question as previously. Market has failed to continue move down and give us downward AB=CD and buttefly “Buy” at 1.3420 area on hourly chart, that we’ve discussed yesterday. Instead of that it has made an attempt to move higher. Although price action has erased hourly butterfly but chances for downward AB-CD still exist.
At the same time price was not able to pass through daily resistance and stuck inside. This makes me think, that market could, for example, just accomplish upward AB=CD compounded retracement and now is ready to turn down again. Whatever will happen, currently we do not have much chances and interest setups for taking position. Also this situation could be treated as it’s shown on hourly chart.

60-min
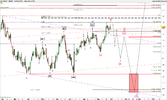
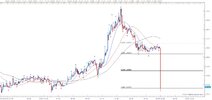
As we’ve taken a look at EUR from harmonic patterns point view, let’s now take a classical as well. Here we have nothing but horizontal range, or rectangle, as you wish. Interestingly that borders of rectangle coinside with pivots on coming week and WPP stands accurately in the middle of the range. Thus, classical approach suggests that if market will pass through the middle level, it should reach at minimum the lower border of rectangle. The same is true for Pivot points. Any real breakout will suggest continuation – that is true as for classical analysis as for pivot points analysis. Classical analysis also suggests the target – eguals to the height of rectangle, counted in the direction of breakout. So, guys, if you like ping-pong trading, you can try it. As we have major event on coming week only on Friday, it is possible that market will be relatively calm in the beginning of the week.

Conclusion:
On big picture market stands at the eve of opening solid bullish perspectives initially to 1.38 area and ultimately up to 1.42-1.43. At least, currently it looks so.
On daily chart overall bullish context holds. The only pattern here that could be suggested is DRPO “Sell” LAL, since on the intraday charts market does not show clear setup and stands in tight range.
The technical portion of Sive's analysis owes a great deal to Joe DiNapoli's methods, and uses a number of Joe's proprietary indicators. Please note that Sive's analysis is his own view of the market and is not endorsed by Joe DiNapoli or any related companies.
Guys, difference between close price of current week and previous week stands just for 1 pippet. Thus, this is really nothing to add on monthly chart and I hold previous analysis intact. Since we’ve discussed fundamental picture with details on previous week, today I just want to say that markets mostly indecision accross the board. Yes, price is moving, people buys and sells, but price stands in range and this trading stands with reduced volumes. I have some worrings that something could happen in October. There are different reasons for that and unfortunately all of them are blur. But here is what I see. First is stock market. It definitely overblown and there is a definite bubble on it. We’ve talked about it aready and it is very probable that big part of every monthly 85Bln are there. There are some signs of weakness are started to appear on equities. First, is classical issue – you’ll find clear divergence between DJIA, DJ Transport and DJ Utility. Second is – Nikkei225 and FTSE 100 have not created new high that now could be seen on NASDAQ and S&P500. Finally, if will take a look at DJIA and trading volumes, you’ll see 2.5 times greater volume on big pluge right from the current top. On weekly chart there are a lot of weeks where selling volume greater than average one and in general, in recent time trading volume increases when market declinces. Also top on weekly chart is a W&R with just huge volume and close price right near the open. This could be an early signal that large players have started to sell. Then, the logical question, where they put their money? Definitely not in equities and not in the bonds, since they stand at minimum yields. I’ve found only last chance for that – gold. Gold stands not too low, but not too high – around 1340. Thus, to start buying gold they need to drop it a bit – reduce price and simultaneously hit out existing buyers by triggering their stops. This puts us to conclusion that we should see as dropping of stock market as gold market. How this could happen? There is only one possible scenario for that, I suppose. If Fed Reserve will announce contraction of QE in October. In this case equities will drop, since there will not be any more inflow with easy money and buble will start to blow off. At the same time gold will drop, because currently inflation is anemic and closing 85 Bln inflow will make the risk of inflation even less. Thus, big whales should have some time lag, they need to sell stocks before market will drop, thus, to transfer money into gold. And signs on stock market probably already show that they gradually are started to sell. Thus, they probably will mostly finish to sell right before October FOMC meeting. Also, it is significant that something should happen definitely in October. Because there will not be a meeting in November and hardly they will start to shake markets in December, when financial year is closing, most corporation stands out of positions and do nothing on financial markets. This is a period of bonuses’ calculation before Christmas, but not phase of active trading.
So, continue logical chain, they need some trigger to announce contraction of QE program and they will have two major ones – NFP and preliminary GDP for 3rd quarter, since meeting will stand at 29-30 of October, and this data should be positive, I suppose. But understand me correctly. This is just assumption, if you want to trade with them, but not against them, you should create such thoughts and spend time on it, even if your conclusions will not be quite correct, they must be done. I do not want to say that this definitely will happen and has to happen, I just don’t know. But we need to keep in mind this and if something of that sort will appear we should do our best to catch our small piece of pie.
Now let’s go back to technical analysis. Our riddle with flag consolidation stands very close to its resolving probably. On monthly chart we have two major moments. First is market has moved above previous high (in red circle). This is important not only because this is high per se, but also because this was a previous failure upward breakout of consolidation. And as market has move right back above it – this tells that this probably is real move at this time. Second – market stands above 50% resistance level that has stopped move up early. I do not know how it will turn, but at least now picture looks bullish. Next monthly target is 1.3775-1.3830 area. It includes yearly pivot resistance1, 5/8 Fib resistance and minor 0.618 extension target of current AB-CD up. Other words, we have an Agreement around YPR1. Trend holds bullish here.

Weekly
Weekly chart just confirms with small inside week that market participants do not hurry up with increasing their positions. Trend is still bullish here. Currently we have the only pattern here and this is butterfly “sell” and we still use AB=CD extension on monthly chart. Trend is bullish here. As market has passed through as MPR1 as MPR2 it solid challenge on continuation and it looks like that we should see it. Long term invalidation point is a low of butterlfy (in red circle). If market will move below it – it will not only erase butterfly but also put under question our monthly AB=CD. Trend also will shift bearish probably around this level. Take a look that we have really huge resistance cluster at 1.38-1.39 area. Recall monthly target and Fib level and now add 1.27 butterfly target, weekly overbought and inner 1.618 AB=CD target. But fortunately we have pretty a lot of room till this area. Second, butterfly pattern could be a long-play one. May be there will be some retracement around 1.27 extension, but who says that it can’t proceed to 1.618? And guys, I have suspicious that this will be the case.
Recall how 2 weeks ago we’ve talked about EUR swings on weekly chart. EUR usually shows AB=CD with very small BC leg. When it completes 100% of this AB=CD it shows significant and wide retracement/consolidations. That is where we stand now and later it usually skyrockets to 1.618 of initial AB-CD. That is an area where 1.618 of our butterfly stands – around 1.42-1.43 This stands beyond a bit of our weekly analysis cycle and overbought but this is really thrilling perspective....
The thing that we do not want to see is a deep and stable return below previous highs around 1.3450 by reasons that we’ve discussed many times on daily time frame.

Daily
Here is sophisticated situation. Market stands in tight range just above nearest 3/8 support level and former WPP. As market shows so shy retracement after reaching of overbought level it could be treated as bullish sign. From other point of view, market has failed yesterday to continue upward action and pass through resistance and it is not at overbought any more. This makes me think that we still could get another leg down that we’ve discussed on previous week, to daily K-support and re-testing broken highs around 1.3420-1.3450 area. Trend holds bullish and by MACDP – price could touch it very soon. Thus, another moment to keep an eye on is possible bullish stop grabber on daily time frame.
Currently I do not see any interesting patterns right here. Previously we’ve talked about possible DRPO “Sell” LAL here and this opportunity has not been vanished totally yet. I do not have 3x3 DMA here, but if you will plot it, you’ll see that we’ve got close below and close above it by far. So we need second close below to get confirmation and I can’t exclude this possibility, mostly due to the failure of the market to pass higher on Friday.

4-hour
Here we have the same question as previously. Market has failed to continue move down and give us downward AB=CD and buttefly “Buy” at 1.3420 area on hourly chart, that we’ve discussed yesterday. Instead of that it has made an attempt to move higher. Although price action has erased hourly butterfly but chances for downward AB-CD still exist.
At the same time price was not able to pass through daily resistance and stuck inside. This makes me think, that market could, for example, just accomplish upward AB=CD compounded retracement and now is ready to turn down again. Whatever will happen, currently we do not have much chances and interest setups for taking position. Also this situation could be treated as it’s shown on hourly chart.

60-min
As we’ve taken a look at EUR from harmonic patterns point view, let’s now take a classical as well. Here we have nothing but horizontal range, or rectangle, as you wish. Interestingly that borders of rectangle coinside with pivots on coming week and WPP stands accurately in the middle of the range. Thus, classical approach suggests that if market will pass through the middle level, it should reach at minimum the lower border of rectangle. The same is true for Pivot points. Any real breakout will suggest continuation – that is true as for classical analysis as for pivot points analysis. Classical analysis also suggests the target – eguals to the height of rectangle, counted in the direction of breakout. So, guys, if you like ping-pong trading, you can try it. As we have major event on coming week only on Friday, it is possible that market will be relatively calm in the beginning of the week.

Conclusion:
On big picture market stands at the eve of opening solid bullish perspectives initially to 1.38 area and ultimately up to 1.42-1.43. At least, currently it looks so.
On daily chart overall bullish context holds. The only pattern here that could be suggested is DRPO “Sell” LAL, since on the intraday charts market does not show clear setup and stands in tight range.
The technical portion of Sive's analysis owes a great deal to Joe DiNapoli's methods, and uses a number of Joe's proprietary indicators. Please note that Sive's analysis is his own view of the market and is not endorsed by Joe DiNapoli or any related companies.


