Daily Analysis
GET 4HR BUY AND SELL SIGNALS @
SUBSCRIBE TO REAL-TIME SIGNALS « TECHNO4X
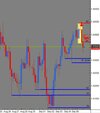
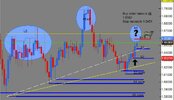
DAILY CHART: BULLISH
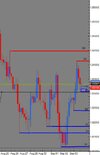
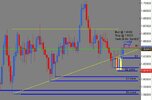
We had a higher close today which is bullish; however, Cable has two long wicks already testing R1 (1.6600). Two is not enough to determine whether we’re dealing with a potential top or not, but the market is pausing here.
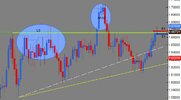
Also, today’s candle opened and closed back above the lower line of our triangle (see white dotted line). Because of this, it is clear that we did not have a break-out and that triangle is still developing and therefore I have redrawn the lower line of the triangle (see yellow line). Daily chart is clearly still in a huge consollidative move which could be a potential head-and-shoulder top. However, we don’t have confirmation for that yet, just a suggestion (see blue eclipses marking left shoulder, head and possibly right shoulder).
Right now, if we zoom down into the last two day’s candles, we are in an uptrend. As long as S1 (1.6450 area) holds, trend is up. However, if we get a daily close below S1 in the next 24hours, bears are back in the game and the case for a head-and-shoulder pattern strengthens.
LEARN HOW TO DO CANDLESTICK ANALYSIS YOURSELF @
TRAINING/MENTORING PROGRAM « TECHNO4X
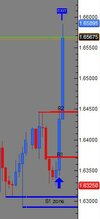
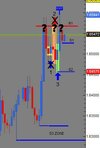
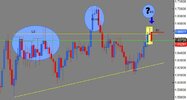
4HR CHART: BULLISH
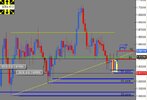
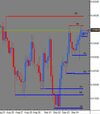
As long as S1 (1.6520 area) holds, the 4hr is bullish. Should we get a 4hr close below this, then bears could try to retest S2 area.
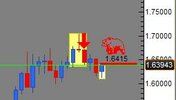
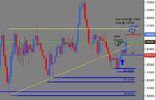
Interesting pattern occurring here. Our trade 1 (buy signal pattern) highlighted in yellow did not pan out. It was foiled by a bearish pattern setup which signalled a sell (trade 2 highlighted in pink). This was a strong attempted by the bears to take over, but they could not bust through 1.6450 area that I mentioned in yesterday’s 4hr chart analysis. Bouncing off of 1.6450 area, the bulls made a buy setup in the form of a modified hammer (trade 3 highlighted in green) and tried to take out the now R1 resistance @ 1.6560/90 but they were unsuccessful and market promptly bounced off of R1 back down again.
As I said, as long as S1 holds, we can expect a retest of R1 and maybe beyond. However, there is an interesting pattern here. We have a possible modified three mountain top (marked by 3 question marks). We need a close below S2 for such a mountain top to be confirmed, but it’s going to take a lot of gusto from the bulls to bust through R1.
LEARN HOW TO DO CANDLESTICK ANALYSIS YOURSELF @
TRAINING/MENTORING PROGRAM « TECHNO4X
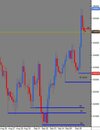
What’s the verdict: Eventhough there are signs of a top (long wicks and possible right shoulder on daily chart and possible three mountain top on 4hr), we have no confirmation for this yet. As of right now, the trend is still up and we trade up until market confirms otherwise.
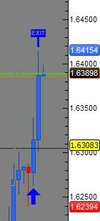
Trade recommendation for daily chart: Our buy recommendation was taken in @ 1.6592 and stop moves to 1.6451 until tomorrow afternoon at 5pmEST.
GET 4HR BUY AND SELL SIGNALS @
SUBSCRIBE TO REAL-TIME SIGNALS « TECHNO4X
Refer to Disclaimer @
DISCLAIMER « TECHNO4X
Blessings
Kardoesie