Antony_NPBFX
NPBFX Representative (unconfirmed)
- Messages
- 1,095
EUR/USD: EUR updates local highs 02.03.2020
Good afternoon, dear forum visitors!
NPBFX offers the latest release of analytics on EUR/USD for a better understanding of the current market situation and more efficient trading.
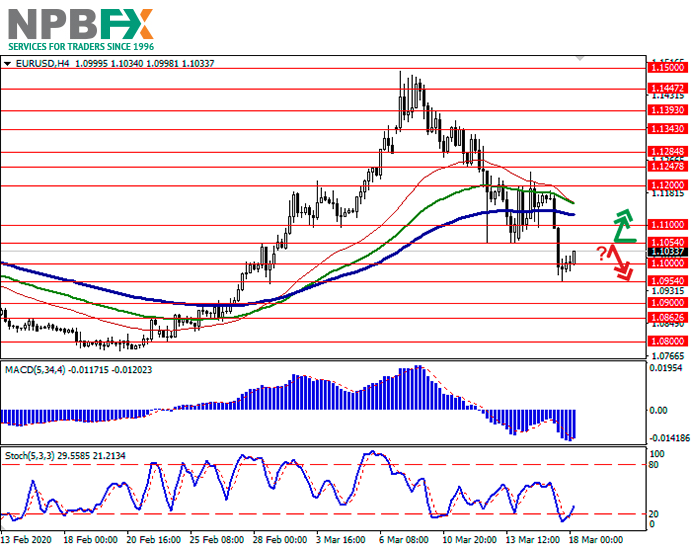
Current trend
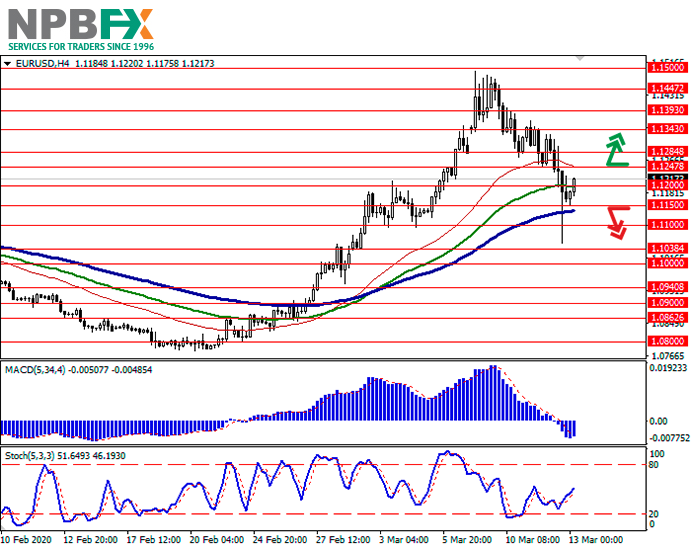
EUR has shown ambiguous growth against USD today, updating monthly highs at the opening. The growth of the instrument was slightly corrected and EUR retreated from its highs to 1.1050, maintaining “bullish” sentiment. Traders are focused on macroeconomic statistics from Germany published last Friday. Investors were optimistic about the decrease in Unemployment Change in Germany in February by 10K after a decline by 4K in January. Experts expected the growth by 3K. Unemployment Rate in February remained at the same level of 5%.
Consumer inflation data also supported EUR. German Consumer Price Index in February showed an increase of 0.4% MoM and 1.7% YoY, which was slightly better than expectations of 0.3% MoM and 1.7% YoY. Harmonized Price Index for the same period accelerated from 1.6% YoY to 1.7% YoY, exceeding forecasts.
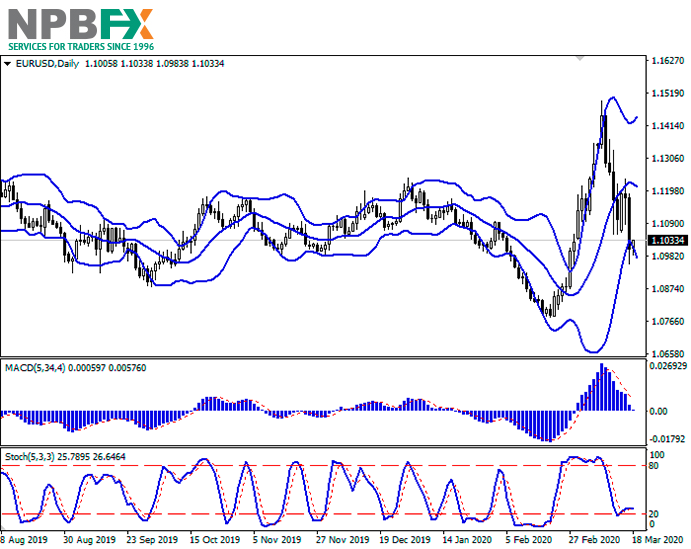
Support and resistance
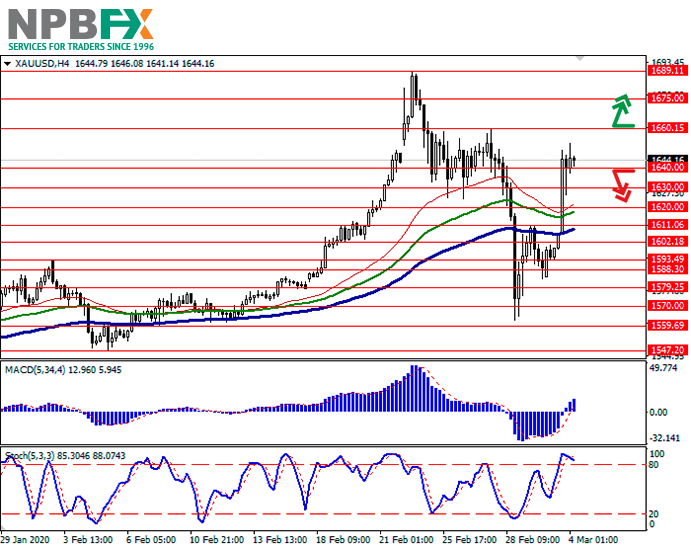
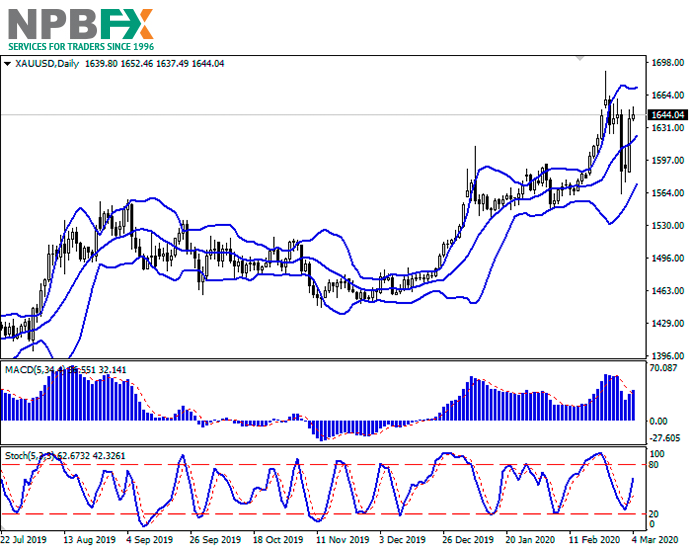
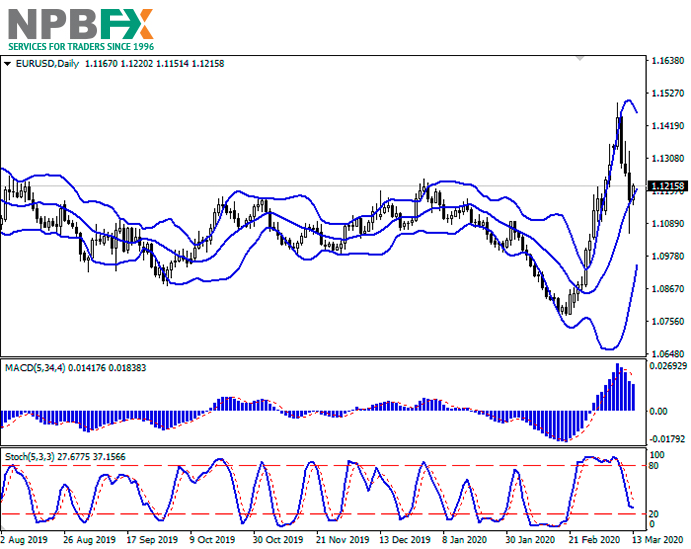
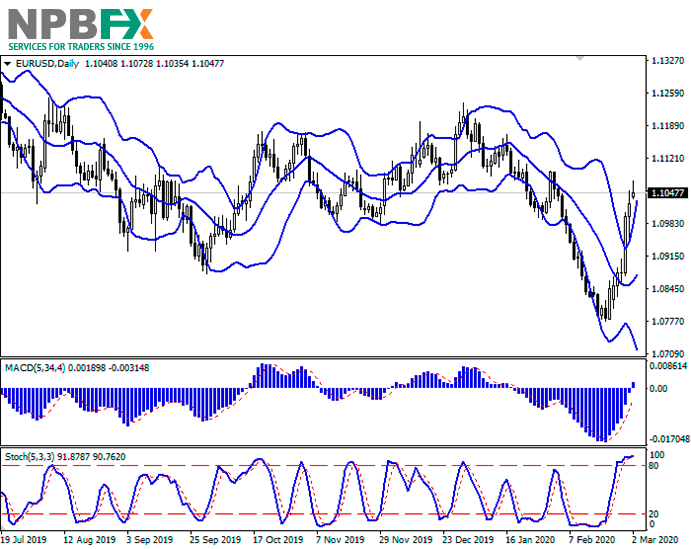
On the D1 chart, Bollinger Bands are sharply reversing into the ascending plane. The price range is expanding, but it fails to catch the development of the uptrend development currently. MACD indicator is growing preserving a stable buy signal (located above the signal line). The indicator is also trying to consolidate above the zero level. Stochastic, having reached its highs, reversed into the horizontal plane, indicating a strongly overbought EUR in the ultra-short term.
Existing long positions should be kept until the situation clears up.
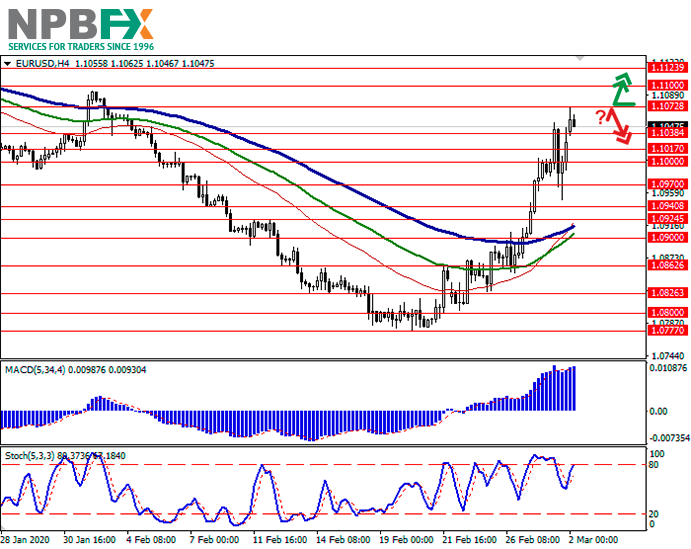
Resistance levels: 1.1072, 1.1100, 1.1123, 1.1143.
Support levels: 1.1038, 1.1017, 1.1000, 1.0970.
Trading tips
To open long positions, one can rely on the breakout of the nearest resistance levels of 1.1072 or 1.1100. Take profit – 1.1143 or 1.1170.
A rebound from 1.1072 as from resistance followed by a breakdown of 1.1038 may become a signal for new sales with the target at 1.0970. Stop loss – 1.1072 or 1.1080.
Implementation time: 2-3 days.
Use more opportunities of the NPBFX analytical portal: analytics
You can find more actual analytical reviews on other popular currency pairs, metals and CFDs on the NPBFX online portal. Daily analytics with charts, current market prognoses and trading scenarios in the Feed section are available. Get free and unlimited access to the online portal after registering on the official website of NPBFX Company.
If you have any questions about trading instruments, you can always ask an analyst in the online chat on the portal and get a free consultation of an experienced specialist.
Use the current recommendations of analysts on EUR/USD and trade efficiently with NPBFX.
Good afternoon, dear forum visitors!
NPBFX offers the latest release of analytics on EUR/USD for a better understanding of the current market situation and more efficient trading.
Current trend
EUR has shown ambiguous growth against USD today, updating monthly highs at the opening. The growth of the instrument was slightly corrected and EUR retreated from its highs to 1.1050, maintaining “bullish” sentiment. Traders are focused on macroeconomic statistics from Germany published last Friday. Investors were optimistic about the decrease in Unemployment Change in Germany in February by 10K after a decline by 4K in January. Experts expected the growth by 3K. Unemployment Rate in February remained at the same level of 5%.
Consumer inflation data also supported EUR. German Consumer Price Index in February showed an increase of 0.4% MoM and 1.7% YoY, which was slightly better than expectations of 0.3% MoM and 1.7% YoY. Harmonized Price Index for the same period accelerated from 1.6% YoY to 1.7% YoY, exceeding forecasts.
Support and resistance
On the D1 chart, Bollinger Bands are sharply reversing into the ascending plane. The price range is expanding, but it fails to catch the development of the uptrend development currently. MACD indicator is growing preserving a stable buy signal (located above the signal line). The indicator is also trying to consolidate above the zero level. Stochastic, having reached its highs, reversed into the horizontal plane, indicating a strongly overbought EUR in the ultra-short term.
Existing long positions should be kept until the situation clears up.
Resistance levels: 1.1072, 1.1100, 1.1123, 1.1143.
Support levels: 1.1038, 1.1017, 1.1000, 1.0970.
Trading tips
To open long positions, one can rely on the breakout of the nearest resistance levels of 1.1072 or 1.1100. Take profit – 1.1143 or 1.1170.
A rebound from 1.1072 as from resistance followed by a breakdown of 1.1038 may become a signal for new sales with the target at 1.0970. Stop loss – 1.1072 or 1.1080.
Implementation time: 2-3 days.
Use more opportunities of the NPBFX analytical portal: analytics
You can find more actual analytical reviews on other popular currency pairs, metals and CFDs on the NPBFX online portal. Daily analytics with charts, current market prognoses and trading scenarios in the Feed section are available. Get free and unlimited access to the online portal after registering on the official website of NPBFX Company.
If you have any questions about trading instruments, you can always ask an analyst in the online chat on the portal and get a free consultation of an experienced specialist.
Use the current recommendations of analysts on EUR/USD and trade efficiently with NPBFX.