NPBFX - making money with us since 1996!

Brent Crude Oil: oil prices are consolidating 15.07.2019

Good afternoon, dear forum visitors!

NPBFX offers the latest release of analytics on Brent Crude Oil for a better understanding of the current market situation and more efficient trading.

Current trend

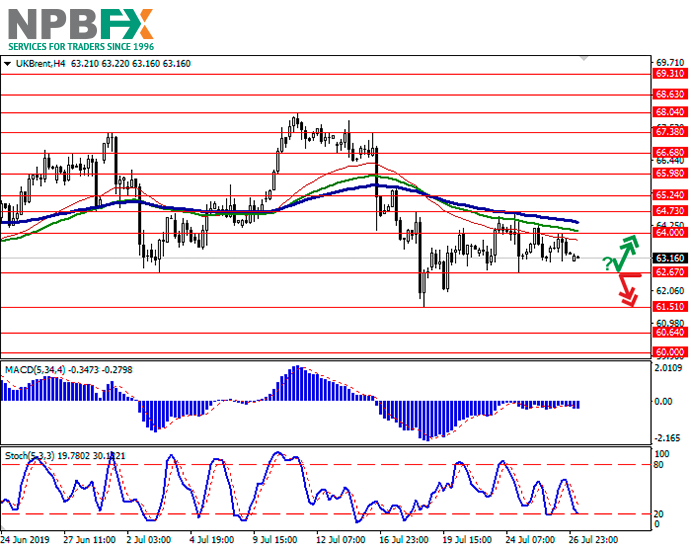
Oil prices are consolidating near local highs, updated at the end of the week. Quotes are supported by a reduction in the production of some US manufacturers in the Gulf of Mexico due to a tropical storm. On the other hand, investors were disappointed with the published report of the International Energy Agency. According to it, further growth in production in the USA will contribute to the growing imbalance of supply and demand in the market. The IEA expects a decline in oil demand by 2020 to a record level since 2003. Additional support for quotes was provided by Baker Hughes report on active oil platforms in the USA published on Friday. During the week, the number of drilling rigs decreased from 788 to 784 units.

Support and resistance

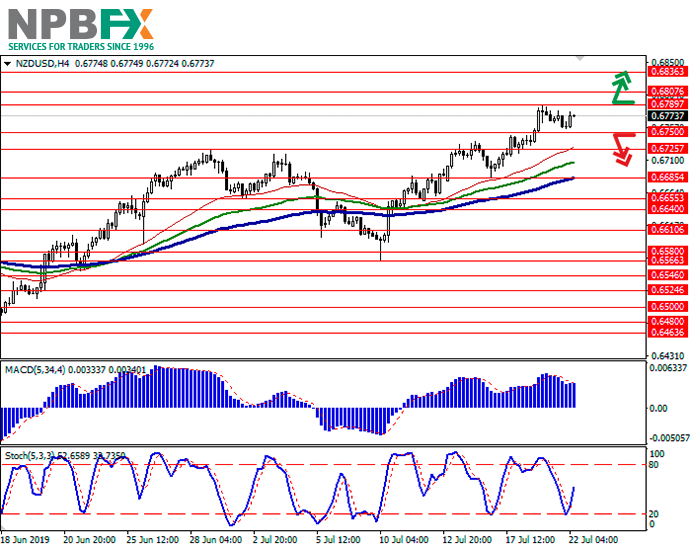
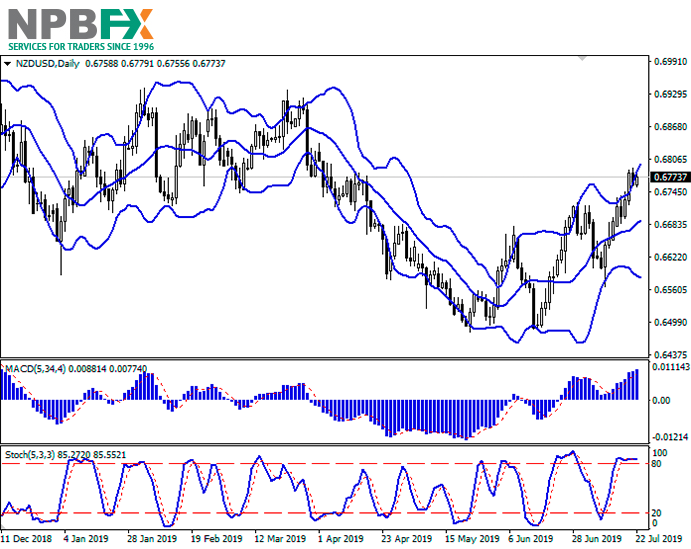
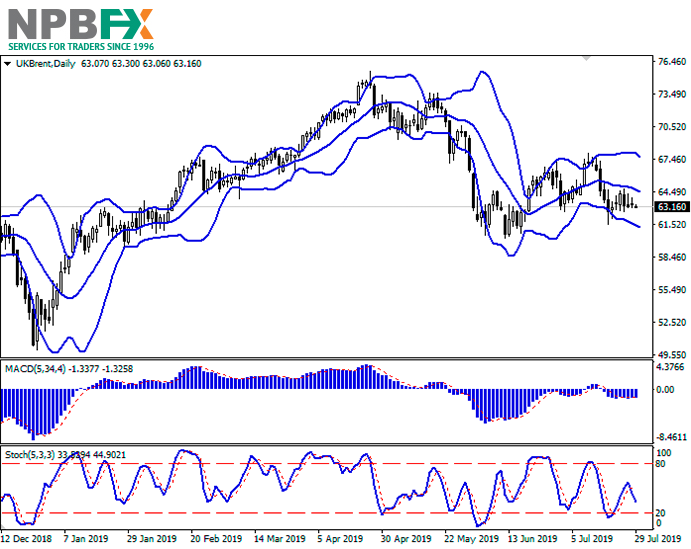
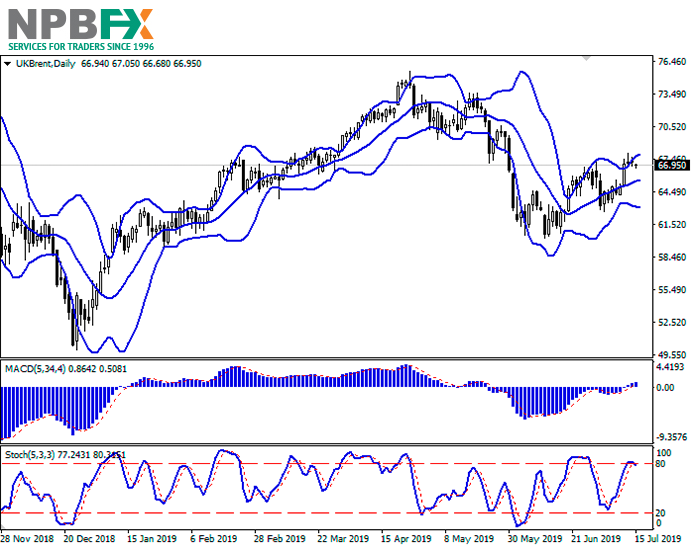
On the D1 chart, Bollinger Bands show a slight increase and a tendency to reverse horizontally. MACD indicator is growing preserving a weak buy signal (histogram is above the signal line). Stochastic, approaching its maxima, is trying to reverse down, indicating the risks of an overbought instrument in the ultra-short term.

One should wait for the clarification and formation of new trade signals.

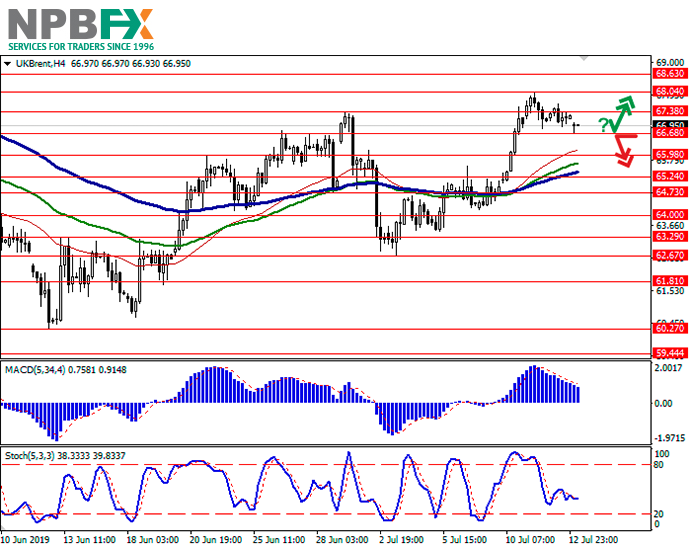
Resistance levels: 67.38, 68.04, 68.63.

Support levels: 66.68, 65.98, 65.24, 64.73.

oil-3.png


oil-4.png


Trading tips

Long positions may be opened if the price moves away from 66.68, as from support, followed by the breakout of 67.38. Take profit – 68.63 or 69.00. Stop loss – 66.68. Implementation period: 1-2 days.

A confident breakdown of 66.68 may serve as a signal to further sales with the target at 65.24 or 64.73. Stop loss – 67.38. Implementation period: 2-3 days.

Use more opportunities of the NPBFX analytical portal: trading signals for commodities.

How can a trader determine if it’s worth buying or selling Brent Crude Oil now or better waiting for a more favorable period? Use trading signals for commodities from the top 10 technical indicators on the NPBFX portal and make the right decisions! All registered users have free and unlimited access to the minutely updated trading signals (MA10, BBands, Ichimoku, Stochastic, ZigZag, etc.) for Gold, Silver, Brent and WTI Crude oil.

If you have any questions about trading instruments, you can always ask an analyst in the online chat on the portal and get a free consultation of an experienced specialist.

Use the current recommendations of analysts on Brent Crude Oil and trade efficiently with NPBFX.
 
EUR/USD: EUR is declining 17.07.2019

Good afternoon, dear forum visitors!

NPBFX offers the latest release of analytics on EUR/USD for a better understanding of the current market situation and more efficient trading.

Current trend

EUR showed a steady decline against USD yesterday, retreating to new weekly lows. The reason for the emergence of negative dynamics was the macroeconomic statistics from Germany and the USA. The ZEW business sentiment index in July decreased from −21.1 to −24.5 points, which turned out to be worse than expectations of −22.3 points. The index of the current economic conditions for the same period decreased from 7.8 to -1.1 points, with a forecast of 5.0 points. The Eurozone sentiment index in July fell from −20.2 to −20.3 points but turned out to be better than the forecast of −20.9 points. Investors were optimistic about US retail sales statistics. In June, the sales of the control group increased from 0.6% to 0.7% MoM, while analysts expected sales to slow to 0.3% MoM. Strong data can help to maintain interest rates at the Fed meeting at the end of July.

Support and resistance

Bollinger Bands in D1 chart demonstrate a stable decrease. The price range is aggressively narrowing, reflecting the mixed dynamics of trading in the short term. MACD is going down preserving a weak sell signal (being located under the signal line). Stochastic shows similar dynamics, approaching its minima.

The current showings of the indicators do not contradict the further development of the downtrend in the short and/or ultra-short term.

Resistance levels: 1.1244, 1.1284, 1.1316, 1.1343.

Support levels: 1.1200, 1.1180, 1.1159, 1.1133.

eur-3-1.png


eur-4-1.png


Trading tips

Long positions may be opened if the price moves away from 1.1200, as from support, followed by the breakout of 1.1244. Take profit – 1.1343 or 1.1370. Stop loss – 1.1200. Implementation period: 2-3 days.

A confident breakdown of 1.1200 may serve as a signal to further sales with the target at 1.1133–1.1120. Stop loss – 1.1230.

Implementation period: 1-2 days.

Use more opportunities of the NPBFX analytical portal: analytics

You can find more actual analytical reviews on other popular currency pairs, metals and CFDs on the NPBFX online portal. Daily analytics with charts, current market prognoses and trading scenarios in the Feed section are available. Get free and unlimited access to the online portal after registering on the official website of NPBFX Company.

If you have any questions about trading instruments, you can always ask an analyst in the online chat on the portal and get a free consultation of an experienced specialist.

Use the current recommendations of analysts on EUR/USD and trade efficiently with NPBFX.
 
AUD/USD: AUD is strengthening 19.07.2019

Good afternoon, dear forum visitors!

NPBFX offers the latest release of analytics on AUD/USD for a better understanding of the current market situation and more efficient trading.

Current trend

The Australian dollar rose substantially against the US one on Thursday, updating local highs of April 24. It is curious that AUD has managed to show quite active growth, despite the ambiguous report on the Australian labor market for June. It reflected employment growth for mere 0.5K jobs, while in May the growth was 45.3K. Analysts were expecting growth of 10.0K jobs.

Macroeconomic statistics from the USA published on Thursday was moderately optimistic. The secondary jobless for the week on July 5 decreased from 1.728 to 1.686 million, with an expected decrease only to 1.700 million. Initial jobless claims expectedly increased from 208K to 216K. Most of the support for USD currency was provided by the Philadelphia Fed Manufacturing PMI, which rose from 0.3 to 21.8 points in July against the forecast of growth to 5 points.

Support and resistance

Bollinger Bands in the D1 chart show moderate growth. The price range is actively expanding, reflecting a surge in "bullish" sentiment on Thursday. MACD indicator is growing preserving a stable buy signal (the histogram is above the signal line). Stochastic, having reached its maxima, is trying to reverse downwards, indicating the overbought instrument in the ultra-short term.

One should keep existing long positions in the short and/or ultra-short term until the sell signals appear.

Resistance levels: 0.7081, 0.7100, 0.7118.

Support levels: 0.7046, 0.7021, 0.7000, 0.6984.

aud-3.png


aud-4.png


Trading tips

To open long positions, one can rely on the breakout of 0.7081. Take profit – 0.7118–0.7130 или 0.7150. Stop loss – 0.7060–0.7050. Implementation period: 1-2 days.

A rebound from 0.7081, as from resistance, followed by a breakdown of 0.7046, may become a signal for corrective sales with the target at 0.6984 or 0.6955. Stop loss – 0.7081. Implementation period: 2-3 days.

Use more opportunities of the NPBFX analytical portal: glossary

Beginning traders certainly face a lot of specialized concepts and lexicon on FOREX, which are often not fully been understood. Swap, tick, hedge, margin calls are often unfamiliar to beginning traders. But the lack of knowledge of these fundamentals make a competent market vision impossible. So glossary on the NPBFX analytical portal could be an excellent helper in this case, which contains all the main definitions with explanations in a compact and accessible form. All concepts are arranged in alphabetical order, so that you can easily and quickly find and explore a new concept for yourself.

If you have any questions about trading instruments, you can always ask an analyst in the online chat on the portal and get a free consultation of an experienced specialist.

Use the current recommendations of analysts on AUD/USD and trade efficiently with NPBFX.
 
NZD/USD: New Zealand dollar consolidates 22.07.2019

Good afternoon, dear forum visitors!

NPBFX offers the latest release of analytics on NZD/USD for a better understanding of the current market situation and more efficient trading.

Current trend

On Friday, the NZD/USD pair fell, retreating from the renewed local highs. The dynamic was of a technical nature since the macroeconomic background remained the same. NZD was moderately supported by credit card spending data. In June, the figure rose by 6.6% YoY, which was only 0.1% weaker than last month. Investors expected a growth rate of only 5.4% YoY. USD, in turn, was under pressure after a speech by representatives of the US Federal Reserve, who noted the positive effect of the rapid interest rate cut. In late July, a large two-day Fed meeting will take place, at which, as investors expect, the interest rate will be lowered.

Support and resistance

Bollinger bands are growing steadily on the daily chart. The price range is actively expanding, letting the “bulls” renew local highs. The MACD indicator is growing, keeping a moderate buy signal (the histogram is above the signal line). Stochastic, approaching its highs, reversed into a horizontal plane, indicating that NZD may become overbought in the super short term.
The developing a corrective decline is possible in the short and/or ultra-short term.

Resistance levels: 0.6789, 0.6807, 0.6836, 0.6872.

Support levels: 0.6750, 0.6725, 0.6685, 0.6655.

nzd-3-1.png


nzd-4-1.png


Trading tips

Long positions can be opened after the breakout of the level 0.6789 with the targets at 0.6850–0.6872. Stop loss is 0.6760. Implementation period: 1–2 days.

Short positions can be opened after the breakdown of the level 0.6750 with the target at 0.6655 or 0.6640. Stop loss is 0.6789. Implementation period: 2–3 days.

Use more opportunities of the NPBFX analytical portal: economic indicators

Regular monitoring of global economic indicators plays an important role in trading, because of their strong influence on FOREX market and possibility to provoke significant price fluctuations. For the convenience of traders the "Education" section on the NPBFX portal contains the most popular and significant world economic indices with a detailed description, their possible impact on the economy and exchange rates (GDP, consumer price index, unemployment rate, Nonfarm Payrolls (NFP), etc.).

If you have any questions about trading instruments, you can always ask an analyst in the online chat on the portal and get a free consultation of an experienced specialist.

Use the current recommendations of analysts on NZD/USD and trade efficiently with NPBFX.
 
USD/CHF: USD is strengthening 24.07.2019

Good afternoon, dear forum visitors!

NPBFX offers the latest release of analytics on USD/CHF for a better understanding of the current market situation and more efficient trading.

Current trend

USD rose against CHF yesterday, developing the "bullish" impulse formed last week. The pressure on franc was exerted by the negative prospects of Brexit and the statements of US President Donald Trump, who noted that "in trade matters, the EU is worse than China." Investors fear the escalation of the US-EU trade conflict since it is not the first time when Trump is trying to impose additional duties on European goods. Published macroeconomic statistics was ambiguous. Sales in the US secondary housing market in June fell by 1.7% after rising by 2.9% MoM last month (forecast of only −0.2% MoM). Richmond Fed Manufacturing Index in July dropped sharply from 3 to −12 points, with the forecast of 5 points. European statistics reflected a slight increase in consumer confidence from −7.2 to −6.6 points, with a constant forecast.

Support and resistance

Bollinger Bands in the D1 chart demonstrate flat dynamics. The price range is slightly narrowed from above, reflecting the change in trading in the short term. MACD indicator is growing preserving a weak buy signal (histogram is above the signal line). Stochastic shows similar dynamics, being approximately in the center of its working area, which reflects good prospects for the development of an uptrend in the short/ultra-short term.

One should look at the possibility of further growth of the instrument in the near future.

Resistance levels: 0.9860, 0.9887, 0.9907, 0.9930.

Support levels: 0.9833, 0.9800, 0.9775, 0.9737.

chf-3.png


chf-4.png


Trading tips

To open long positions, one can rely on the breakout of 0.9870–0.9880. Take profit – 0.9930 or 0.9950–0.9960. Stop loss – 0.9850–0.9840.
A reverse near the current level, followed by a breakdown of 0.9860–0.9850, may become a signal for sales with the target at 0.9800. Stop loss – 0.9870–0.9880.

Implementation period: 2-3 days.

Use more opportunities of the NPBFX analytical portal: weekly FOREX forecast

You can learn more about the current situation on USD/CHF and get acquainted with the weekly analytical forecast in the "Video reviews" section on the NPBFX portal. Weekly video reviews contain trends, key levels, trading recommendations for such popular instruments as EUR/USD, GBP/USD, USD/JPY, AUD/USD. In order to get free and unlimited access to video forecast and other useful instruments on the portal, you need to register on the NPBFX website.

If you have any questions about trading instruments, you can always ask an analyst in the online chat on the portal and get a free consultation of an experienced specialist.

Use the current recommendations of analysts on USD/CHF and trade efficiently with NPBFX.
 
USD/JPY: the dollar continues to grow 26.07.2019

Good afternoon, dear forum visitors!

NPBFX offers the latest release of analytics on USD/JPY for a better understanding of the current market situation and more efficient trading.

Current trend

The US dollar showed strong growth against the Japanese yen on Thursday. The development of "bullish" sentiment was supported by the strong macroeconomic statistics on the dynamics of orders for durable goods in the United States. In turn, the Japanese data was ambiguous. The index of foreign investment in Japanese bonds for the week of July 19 showed a decrease of 110.0 billion Japanese yen after a decline of 93.1 billion over the previous period.

Today, the pair is trading in both directions. Minor support for the yen is provided by a published Tokyo consumer price index. The level of consumer inflation, excluding fresh food products, rose by 0.9% YoY, which was 0.1% better than market expectations. On Friday, investors are focused on the publication of annual data on US GDP for Q2.

Support and resistance

Bollinger Bands in the D1 chart demonstrate flat dynamics. The price range narrows from above, reflecting an uncertain start of trading on Friday. MACD indicator is growing preserving a stable buy signal (the histogram is above the signal line). Also, the indicator is preparing to test the zero line on the breakout. Stochastic, having reached its maxima, reversed horizontally, indicating the overbought dollar in the ultra-short term.

To open new transactions, one should wait for clarification.

Resistance levels: 108.74, 108.98, 109.30.

Support levels: 108.52, 108.17, 107.78, 107.52.

jpy-3-1.png


jpy-4-1.png


Trading tips

To open long positions, one can rely on the breakout of 108.74. Take-profit – 109.30. Stop loss – 108.40. Implementation period: 1-2 days.

A rebound from 108.74, as from resistance, followed by a breakdown of 108.52–108.40, may become a signal for corrective sales with the target at 107.78 or 107.52. Stop loss – 108.80–108.90. Implementation period: 2-3 days.

Use more opportunities of the NPBFX analytical portal: economic calendar

Be ready for any market changes through global events using the economic calendar on the NPBFX portal. The calendar contains all the most important events of the world economy and prognoses for them. In order to get free and unlimited access to the economic calendar and other useful instruments on the portal, you need to pass a one-time registration on the NPBFX website.

If you have any questions about trading instruments, you can always ask an analyst in the online chat on the portal and get a free consultation of an experienced specialist.

Use the current recommendations of analysts on USD/JPY and trade efficiently with NPBFX.
 
Brent Crude Oil: oil prices are consolidating 29.07.2019

Good afternoon, dear forum visitors!

NPBFX offers the latest release of analytics on Brent Crude Oil for a better understanding of the current market situation and more efficient trading.

Current trend

On Friday, the dynamics of oil prices was controversial, as the growth of tensions in the Middle East was balanced by signals of a slowdown in US economic growth. Despite the fact that Friday's data on Q2 2019 US GDP were better than expected (+2.1% YoY against the forecast of +1.8% YoY), the decline in the growth of the American economy is quite noticeable, therefore the steps to stimulate the national economy are still expected. The report of Baker Hughes on active oil platforms in the United States, which reflected a further reduction in active drilling rigs (from 779 to 776) moderately supported the instrument.

Support and resistance

On the daily chart, Bollinger bands are slightly falling. The price range narrows from above, reflecting the emergence of ambiguous trading dynamics in the short term. The MACD indicator is falling, keeping a poor sell signal (the histogram is below the signal line). Stochastic is also pointed downwards, reaching its lows again.

It is better to wait for the clarification of trading signals from technical indicators to open new positions in the market.

Resistance levels: 64.00, 64.73, 65.24, 65.98.

Support levels: 62.67, 61.51, 60.64, 60.00.

oil-3-1.png


oil-4-1.png


Trading tips

Long positions can be opened after a rebound from the level of 62.67 and the breakout of the level of 64.00 with the target at 65.98 or 66.68. Stop loss is 63.00.

Short positions can be opened after the breakdown of the level of 62.67 with the target at 60.64 or 60.00. Stop loss is 63.70.

Implementation period: 2–3 days.

Use more opportunities of the NPBFX analytical portal: trading signals for commodities.

How can a trader determine if it’s worth buying or selling Brent Crude Oil now or better waiting for a more favorable period? Use trading signals for commodities from the top 10 technical indicators on the NPBFX portal and make the right decisions! All registered users have free and unlimited access to the minutely updated trading signals (MA10, BBands, Ichimoku, Stochastic, ZigZag, etc.) for Gold, Silver, Brent and WTI Crude oil.

If you have any questions about trading instruments, you can always ask an analyst in the online chat on the portal and get a free consultation of an experienced specialist.

Use the current recommendations of analysts on Brent Crude Oil and trade efficiently with NPBFX.
 
EUR/USD: Euro is in correction 31.07.2019

Good afternoon, dear forum visitors!

NPBFX offers the latest release of analytics on EUR/USD for a better understanding of the current market situation and more efficient trading.

Current trend

Yesterday, the EUR/USD pair was moving ambiguously. EUR weakened due to the mixed EU macroeconomic publications, while USD further growth was prevented by the expectation of the Fed’s interest rate decrease at the meeting on Wednesday, July 31. July’s EU Consumer Confidence index fell to –7.4 points from –5.6 points last month. Analysts expected a decrease to –7.0 points. July’s EU Business Climate fell from 0.17 to –0.12 points, which also was worse than market forecasts of 0.08 points. French data were also disappointing. Thus, according to preliminary estimates, French Q2 2019 GDP slowed down from +0.3% QoQ to +0.2% QoQ. June's Consumer Spending Index decreased by 0.1% MoM after rising by 0.3% MoM last month.

Today, in addition to the Fed’s Meeting Minutes, EU Q2 GDP and July’s Consumer Prices Index will be released.

Support and resistance

On the daily chart, Bollinger bands steadily decline. The price range narrows, reflecting the emergence of ambiguous trading dynamics in the short term. The MACD grows, keeping a moderate buy signal (the histogram is above the signal line). Stochastic’s dynamic is similar; it is in the center of its working area.

It is better to keep current long positions in the short and/or super short term until the situation becomes clear.

Resistance levels: 1.1160, 1.1180, 1.1198, 1.1244.

Support Levels: 1.1133, 1.1115, 1.1100, 1.1075.

eur-3-2.png


eur-4-2.png


Trading tips

Long positions can be opened after the breakout of 1.1160 with the target at 1.1244. Stop loss is 1.1133.

Short positions can be opened after the rebound from 1.1160 and the breakdown of 1.1133 with the target at 1.1075. Stop loss is 1.1160.

Implementation period: 2–3 days.

Use more opportunities of the NPBFX analytical portal: E-book

If you just recently started to be interested in trading on FOREX and would like to deepen your knowledge, an electronic Beginner's Guide to FOREX Trading will be an excellent helper for you here. The book consists of 5 chapters and reflects fundamental concepts of the foreign exchange market to start successful trading. From the main chapters of the E-book you can learn about the concepts and history of FOREX, currencies and trend lines, technical indicators, types of orders, trading on news, psychology of trading, risk management and much more.

You can read a Beginner's guide to FOREX Trading online or download it free of charge from the NPBFX analytical portal in the "Education" section. In order to get unlimited access to the E-book and other useful instruments on the portal, you need to register on the NPBFX website.

If you have any questions about trading instruments, you can always ask an analyst in the online chat on the portal and get a free consultation of an experienced specialist.
Use the current recommendations of analysts on EUR/USD and trade efficiently with NPBFX.
 
AUD/USD: the instrument is consolidating 02.08.2019

Good afternoon, dear forum visitors!

NPBFX offers the latest release of analytics on AUD/USD for a better understanding of the current market situation and more efficient trading.

Current trend

AUD ended yesterday’s session with a steady decline against USD, updating local lows of January 3. The instrument was pressured by another sharp statement by Donald Trump, who accused Chinese President Xi Jinping of sluggishness in the process of concluding a trade agreement. Trump has also announced the phased introduction of higher import duties on the remaining Chinese imports from September. It is proposed to start with 10% duty, after which the US president, depending on the progress made in the negotiations, can regulate this level.

During today's Asian session, AUD is showing corrective growth. Macroeconomic statistics from Australia provides certain support for the instrument. The volume of retail sales in August grew by 0.4% MoM after rising by 0.1% MoM in the previous month. Australia's Producer Price Index in Q2 2019 showed an increase of 0.4% QoQ and 2.0% YoY, which was better than market expectations (+0.2% QoQ and +1.9% YoY).

Support and resistance

Bollinger Bands in D1 chart demonstrate a stable decrease. The price range is actively expanding, but the instrument has been located outside of its boundaries for a long time. MACD is going down preserving a strong sell signal (located below the signal line). Stochastic, having reached its lows, reversed to the horizontal plane, indicating strongly oversold AUD in the short and ultra-short term.

Correctional dynamics is possible in the near future.

Resistance levels: 0.6830, 0.6860, 0.6883, 0.6900.

Support levels: 0.6794, 0.6758, 0.6720.

aud-3.png


aud-4.png


Trading tips

To open long positions, one can rely on the rebound from 0.6794 as from support with the subsequent breakout of 0.6830. Take profit — 0.6900 or 0.6920, 0.6933. Stop loss — 0.6794.

The breakdown of 0.6794 may serve as a signal to new sales with the target at 0.6720. Stop loss — 0.6830.

Implementation time: 2-3 days.

Use more opportunities of the NPBFX analytical portal: analytics

You can find more actual analytical reviews on other popular currency pairs, metals and CFDs on the NPBFX online portal. Daily analytics with charts, current market prognoses and trading scenarios in the Feed section are available. Get free and unlimited access to the online portal after registering on the official website of NPBFX Company.

If you have any questions about trading instruments, you can always ask an analyst in the online chat on the portal and get a free consultation of an experienced specialist.

Use the current recommendations of analysts on AUD/USD and trade efficiently with NPBFX.
 
USD/CAD: the instrument is strengthening 05.08.2019

Good afternoon, dear forum visitors!

NPBFX offers the latest release of analytics on USD/CAD for a better understanding of the current market situation and more efficient trading.

Current trend

On Friday, the USD/CAD pair slightly decreased, although that during the day the instrument was trading upwards and renewed its highs since June 20. Investors rather coldly met the publication of the July report on the US labor market, which reflected the steady growth of new jobs in the American economy by 164K. The July average hourly wage rose from +3.1% YoY to +3.2% YoY, which was better than analysts' neutral forecasts.

Canadian statistics, in turn, was very uncertain. Thus, exports from Canada in June fell from $53 billion to $50.31 billion, which turned out to be worse than analysts' forecasts of $51.50 billion. Imports also fell from $52.43 billion to $50.17 billion against the forecast of $51.80 billion. Trade surplus balance in June fell from $0.56 billion to $0.14 billion.

Support and resistance

On the daily chart, Bollinger bands are growing steadily. The price range is narrowing, reflecting the emergence of ambiguous trading dynamics in recent days. The MACD indicator is growing, keeping a poor buy signal (the histogram is above the signal line), and is trying to consolidate above the zero line. Stochastic, approaching its highs, reversed, indicating that the possibility of USD becoming overbought in the ultra-short term is growing.

It is better to keep current long positions until the market situation becomes clear.

Resistance levels: 1.3241, 1.3264, 1.3283, 1.3320.

Support Levels: 1.3200, 1.3163, 1.3134, 1.3100.

cad-3.png


cad-4.png


Trading tips

Long positions can be opened after the breakout of 1.3241–1.3250 with the targets at 1.3320–1.3330. Stop loss – 1.3210. Implementation period: 1–2 days.

Short positions can be opened after the breakdown of 1.3200 with the target at 1.3100. Stop loss – 1.3250. Implementation period: 2–3 days.

Use more opportunities of the NPBFX analytical portal: glossary

Beginning traders certainly face a lot of specialized concepts and lexicon on FOREX, which are often not fully been understood. Swap, tick, hedge, margin calls are often unfamiliar to beginning traders. But the lack of knowledge of these fundamentals make a competent market vision impossible. So glossary on the NPBFX analytical portal could be an excellent helper in this case, which contains all the main definitions with explanations in a compact and accessible form. All concepts are arranged in alphabetical order, so that you can easily and quickly find and explore a new concept for yourself.

If you have any questions about trading instruments, you can always ask an analyst in the online chat on the portal and get a free consultation of an experienced specialist.

Use the current recommendations of analysts on USD/CAD and trade efficiently with NPBFX.
 
Back
Top