• Please try to select the correct prefix when making a new thread in this folder.

    Discuss is for general discussions of a financial company or issues related to companies.

    Info is for things like "Has anyone heard of Company X?" or "Is Company X legit or not?"

    Compare is for things like "Which of these 2 (or more) companies is best?"

    Searching is for things like "Help me pick a broker" or "What's the best VPS out there for trading?"

    Problem is for reporting an issue with a company. Please don't just scream "CompanyX is a scam!" It is much more useful to say "I can't withdraw my money from Company X" or "Company Y is not honoring their refund guarantee" in the subject line.
    Keep Problem discussions civil and lay out the facts of your case. Your goal should be to get your problem resolved or reported to the regulators, not to see how many insults you can put into the thread.

    More info coming soon.

Discuss RoboForex.com

General discussions of a financial company
Best Long-Term Trading Strategies: “Daily Breakout and Moving Average”

Author: Andrey Goilov

8.jpg


Dear Clients and Partners,

Almost any trend strategy uses Moving Averages as they help traders to quickly define the trend. However, the tactics named “Daily Breakout and Moving Average” works differently.

According to this strategy, a trader will trade against the direction of Moving Averages. In order to do that, they will have to follow quite unusual rules of using Moving Averages.

Pic-1.png


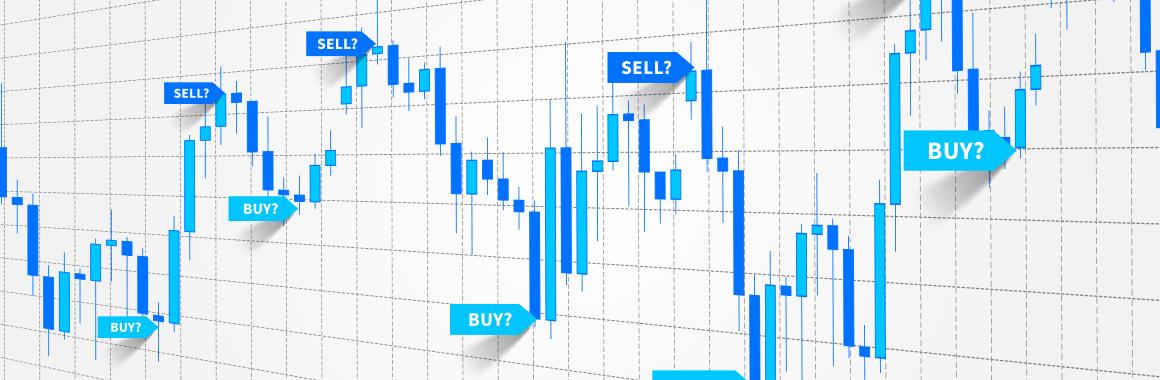
If Moving Averages show a bullish trend, then a trader should look for a signal to sell. If Moving averages show a bearish trend – vice versa, a trader should look for a signal to buy. It turns out to be some kind of a countertrend strategy.

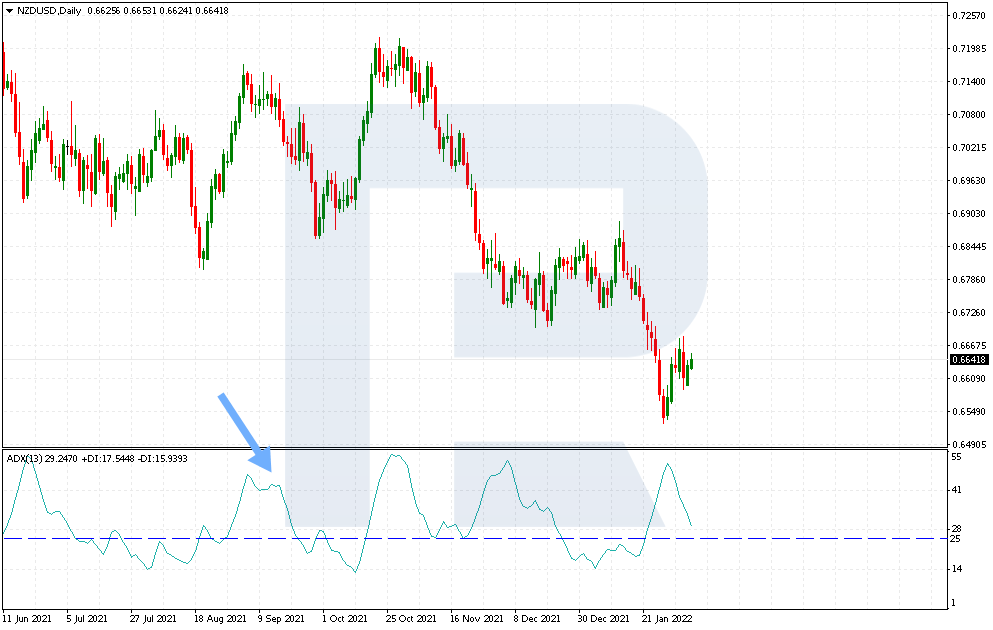
More to that, the ADX indicator is usually added here to get a confirmation to enter the market. This combination of indicators allows to “catch” the completion of the current tendency ahead of time.

Pic-2.png


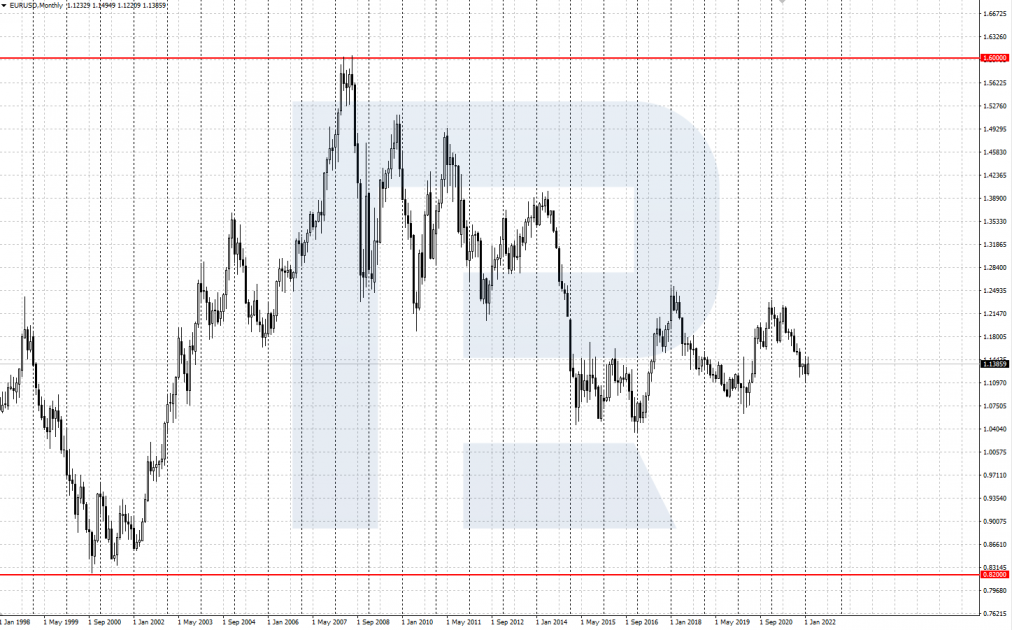
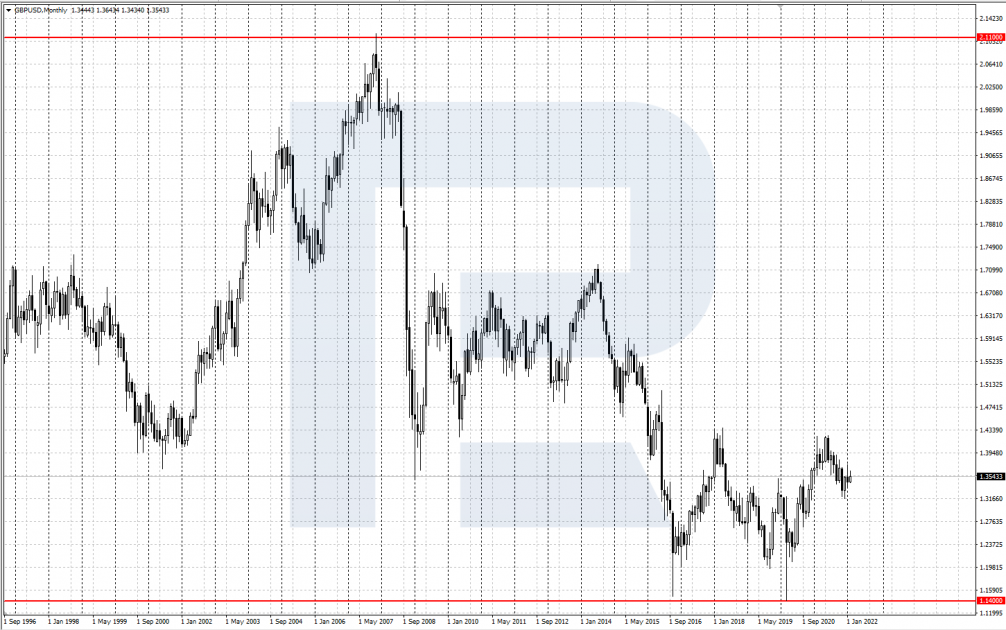
Authors of the strategy believe that it can be used for working with any instrument but only on a daily timeframe.

The article goes into the details of the “Daily Breakout and Moving Average” strategy – we’ll discuss how to trade against the dominating tendency and try to “catch” a breakout using simple indicators.

How to customise indicators to trade by the strategy

To use the strategy, you need to apply three indicators to a daily time frame.

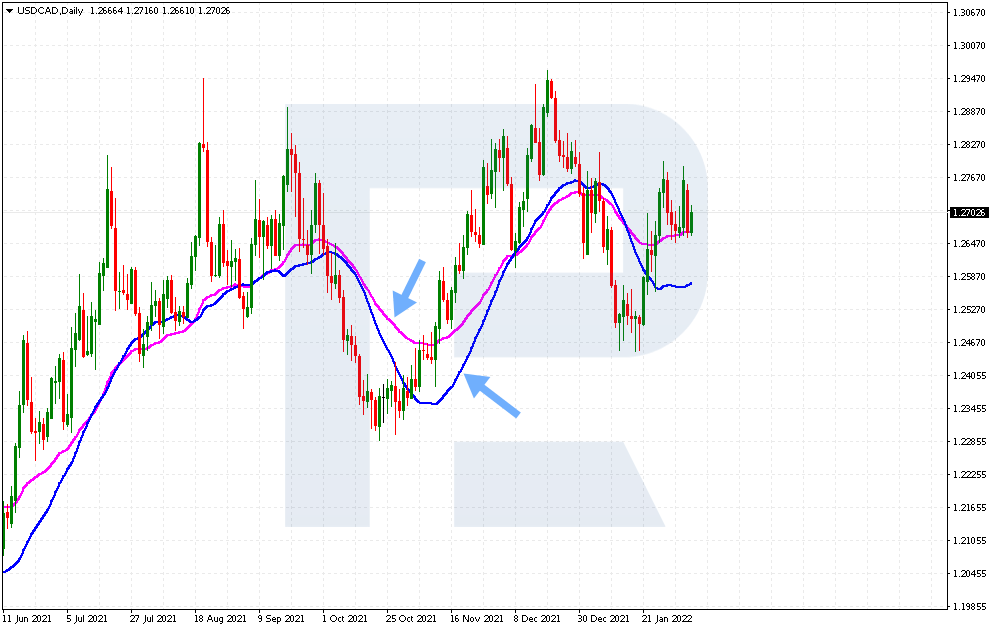
1. Simple Moving Average (SMA) with a period of 20, building at the lowest prices and choosing Low. An arithmetical average that uses the lowest prices over the period instead of the closing prices.

Read more at R Blog - RoboForex

Sincerely,
RoboForex team
 
How to Trade Hammer and Shooting Star Candlestick Patterns

Author: Victor Gryazin

13.jpg


Dear Clients and Partners,

Hammer and Shooting Star are two popular candlestick patterns. Appearing on the chart, they precede a correction or trend reversal. These two patterns form at the local extremes of the price chart after a lengthy movement.

Hammer

The Hammer pattern indicates a market reversal upwards and forms at the price lows after a descending price movement. The pattern looks like a candlestick with a small body and a long lower shadow, at least three times as large as the body.

The body of the candlestick closes near the highs, the upper shadow is tiny or lacking altogether. The candlestick may be of any colour, with or without a gap from the previous candlestick. A pattern with a white body will be a bit stronger. The candlestick resembles a hammer on a long handle, that is why the pattern got its name.

The Hammer only matters after a serious decline, when the market is oversold. In a downward movement, the bears bump at a strong support level that lets the bulls find a foothold and try to reverse the market upwards. The long lower shadow of the candlestick demonstrates the power of the bulls and their readiness to fight back.

If after the Hammer forms the bulls manage to hold the support level consisting of the pattern low and push the quotations upwards, renewing the high of the candlestick — then an upward correction becomes more possible, which means a good chance to buy. However, if the bears manage to drag the prices under the low of the candlestick, the signal to buy will be cancelled, so that the decline may continue.

candle-hammer.png


Shooting Star

Shooting Star indicates a market reversal downwards, appearing at the highs of the price after an ascending movement. This pattern mirrors the Hammer: it consists of a candlestick with a small body and a long upper shadow, at least three times larger than the body.

The body closes near the lows, the lower shadow is small or totally lacks. The candlestick may be of any colour, with or without a gap from the previous candlestick. A pattern with a black body will be a bit stronger. This candlestick looks like a shooting star (a meteorite burning in the atmosphere) that leaves a long trail.

The pattern is significant only after a lengthy decline of the quotations, when the market is overbought. In an ascending movement, the bulls get stuck in a strong resistance level that gives the bears a chance to accumulate forces and push the price down. The long upper shadow of the candlestick demonstrates the power of the bears and their eagerness to reverse the market in their direction.

If after a Shooting star the bears manage to hold the resistance level formed by the high of the pattern, and push the quotations down, renewing the low — then the descending correction becomes more probable and a good chance to sale appears. However, if the bulls manage to raise the quotations above the high of the pattern, the signal to sell will be cancelled, and the upward movement may return.

candle-shootingstar.jpg


Trading the Hammer and Shooting Star

As long as these two are reversal patterns, they are to be looked for on the local lows and highs of the price chart in a descending or ascending trend, respectively. These patterns are not recommended for flats except for the cases when they confirm bounces off the borders of the price range.

The patterns are good for trading shares, commodity futures, Forex currencies, etc. They work on larger timeframes by themselves and can be useful for trading intraday when applied alongside tech analysis.

Read more at R Blog - RoboForex

Sincerely,
RoboForex team
 
Dear traders!!

This week, the ContestFX project will continue with the following competitions:

The 131st competition of "Demo Forex" is approaching the finish line.
The 350th competition of "Week with CFD" has just started.
484th competition of "Trade Day" will start on 02.03.2022 at 12:00.
398th competition of "KingSize MT5" will start on 03.03.2022 at 20:00.

We remind you that after winning any of our competitions, you will get prize money to your real trading account, which you can use to start working in the Forex market without investing your own financial resources.

We're looking forward to your joining in and wish you good luck!

Sincerely,
RoboForex Contest
 
Top 7 Major Currency Pairs on Forex

Author: Victor Gryazin

9.jpg


Dear Clients and Partners,

In this article, you’ll find a short review of seven major currency pairs on the Forex market. These pairs are the most popular with traders and investors and are also characterised by high liquidity and low spreads.

EUR/USD

Euro (EUR) is a single European currency, which replaced all national currencies in the European Union in 1999. Given its status, EUR is reflective of the state of economic affairs in the European Union and very sensitive to the macroeconomic statistics from Europe.

The EUR/USD pair is leading the Forex market: its daily trading volume is the biggest – almost 20% of the total trading turnover.

The EUR/USD rate shows the current ratio between currencies of two global economic regions, the EU and the US. If the pair is growing, it means that EUR is getting stronger against USD, and vice versa. Economic and political news from these regions has a significant influence on the EUR/USD rate.

At the very beginning of trading, EUR/USD was moving downwards and once reached the all-time low at 0.8200. For several years after that, the pair was steadily rising and set its all-time high a bit above 1.6000 in 2008.

Later on, due to crises and some troubles in Europe, the pair dropped pretty much. EUR/USD is characterised by high liquidity, low spreads, and daily volatility of about 80 pips.

top7-eurusd-1012x630.png


GBP/USD

British Pound (GBP) is the United Kingdom’s national currency. It’s one of the oldest currencies in the world, which approximately appeared in the twelfth century. As a result of the development of trading relations between Britain and its colonies, there emerged a need for a reliable currency to be used in settlements.

GBP/USD shows the ratio between currencies of the United Kingdom and the United States. The pair accounts for 15% of the total currency market trading turnover. “Cable” is a foreign exchange slang term for GBP/USD. The term comes from the days of early telegraph cables that were laid between London and New York and were used to communicate currency quotes and other data.

British Pound is the base currency, while USD is the quote currency. If the pair rises, it means that GBP is getting stronger against USD, and vice versa.

The British Pound is considered a rather aggressive speculative currency, which creates high volatility in GBP/USD, about 100 pips a day. The pair movements often create a lot of false breakouts of support and resistance levels in the price charts.

top7-gbpusd-1006x630.png


NZD/USD

New Zealand Dollar (NZD) is the national currency of New Zealand. Its history goes back to the 1970s. In the “colonial” past, New Zealand Dollar was pegged to British Pound and was named New Zealand Pound.

In 1967, the first New Zealand Dollars appeared and they were pegged to USD. New Zealand Dollar is classified as a commodity currency.

Read more at R Blog - RoboForex

Sincerely,
RoboForex team
 
roboforex stole my money and after that they blocked my access to the account along with the money left there !
 
RoboForex: upcoming changes to the trading schedule due to reverting to Daylight Saving Time

roboforex-header.jpg


Dear Clients and Partners,

We’re informing you that on 13 March 2022, the USA will revert from Standard Time to Daylight Saving Time. In Europe, reverting from Standard Time to DST will take effect on 27 March 2022. Thereby, there will be more changes to the trading schedule*.

MetaTrader 4 / MetaTrader 5 platforms

Schedule for trading on CFDs on US indices (US30Cash, US500Cash, USTECHCash) and oil (Brent, WTI)
  • From 14 to 25 March 2022, trading CFDs on US indices and Oil will be opened and closed 1 hour earlier than usual (server time).
    Trading session (server time): 02:00 AM - 10:15 PM.
Schedule for trading on Metals (XAUUSD, XAGUSD) and CFDs on the JP225Cash index
  • From 14 to 25 March 2022, trading CFDs on Metals and CFDs on the JP225Cash index will be opened and closed 1 hour earlier than usual (server time).
    Trading session (server time): 12:05 AM - 10:55 PM.
Schedule for trading on CFDs on US stocks
  • From 14 to 25 March 2022, trading CFDs on US stocks will be opened and closed 1 hour earlier than usual (server time).
    Trading session (server time): 03:31 PM - 09:59 PM.
Please note that, on 18 and 25 March 2022, trading on all instruments in all platforms will be closed at 11:00 PM server time. In addition, from 14 to 25 March 2022, the bank rollover time will be from 10:00 PM to 12:30 AM server time. Consequently, this might lead to short-term interruptions in quoting, and significant widening of spreads.

R StocksTrader platform

Schedule for trading on US stocks and ETFs, CFDs on US stocks and ETFs
  • 1From 14 to 25 March 2022, trading US stocks and ETFs, CFDs on US stocks and ETFs will be opened and closed 1 hour earlier than usual (server time).
    Trading session (server time): 03:30 PM - 10:00 PM.
Schedule for trading on CFDs on oil (BRENT.oil, WTI.oil) and US indices (NAS100, US30, US500)
  • From 14 to 25 March 2022, trading CFDs on Oil will be opened and closed 1 hour earlier than usual (server time).
    Trading session (server time): 02:00 AM - 10:15 PM.
Schedule for trading on Metals (XAUUSD, XAGUSD)
  • From 14 to 25 March 2022, trading CFDs on Metals will be opened and closed 1 hour earlier than usual (server time).
    Trading session (server time): 12:05 AM - 10:55 PM.
Schedule for trading on all currency pairs
  • From 14 to 25 March 2022, trading all currency pairs will be stopped for an interval 1 hour earlier than usual (server time).
    Interval period (server time): 11:00 PM - 11:15 PM.
  • Starting 28 March 2022, all currency pairs will be available for trading within the operating range of the contract specifications.
Please note that, on 18 and 25 March 2022, trading on all instruments, including Cryptocurrencies, in all platforms will be closed at 11:00 PM server time.

cTrader platform

Schedule for trading on all currency pairs
  • From 14 to 25 March 2022, trading all currency pairs will be stopped for an interval from 10:55 PM - 11:05 PM (server time).
Schedule for trading on Metals (XAUUSD, XAGUSD)
  • From 14 to 25 March 2022, trading Metals will be opened and closed 1 hour earlier than usual (server time).
    Trading session (server time): 12:05 AM - 10:55 PM.
Please note that, on 18 and 25 March 2022, trading on all instruments in all platforms will be closed at 11:00 PM server time. In addition, from 14 to 25 March 2022, the bank rollover time will be from 10:00 PM to 12:30 AM server time. Consequently, this might lead to short-term interruptions in quoting, and significant widening of spreads.

Please bear these changes in the schedule in mind when planning your trading activity.

* - This schedule is for informational purposes only and may be changed by the provider.

Sincerely,
RoboForex team
 
Dear traders!

This week, the ContestFX project will continue, as usual, with the following competitions on demo accounts:

The 132nd competition of "Demo Forex" and the 351st competition of "Week with CFD" have just started.
485th competition of "Trade Day" will start on 09.03.2022 at 12:00.
399th competition of "KingSize MT5" will start on 10.03.2022 at 20:00.

To take part in our competitions, it is enough to go through a simple registration procedure and then participation in any competition you chose will be available in just a couple of mouse clicks.

Good luck to all traders!

Sincerely,
RoboForex Contest
 
Divergence and Convergence in Trading: How to Use Signals

Author: Victor Gryazin

3.jpg


Dear Clients and Partners,

This article is devoted to such terms as divergence and convergence as well as their use in trading.

What is divergence

Divergence is the instance when the price chat diverges with the used trading indicator. This looks as follows: in an ascending movement the price chart forms a new high that is higher than the previous one while the indicator shows a high that is no higher than the previous one. This inequality might mean that the bulls are losing power, so next thing a descending correction or even a reversal follows.

A classic divergence consists of two highs of the price chart and two corresponding highs of the trading indicator. One of the most popular indicators for catching divergences is the MACD (Moving Average Convergence/Divergence).

diver-1-1012x630.png


How to use convergence and divergence in trading

A divergence or a convergence on the chart is considered a useful trading signal. Many traders fish for them to open or close their positions.

To catch convergences/divergences, various indicators can be used, the most popular of them being the MACD, RSI, and Stochastic. Convergences/divergences can be traded on any highly liquid assets, on timeframes from H1 and higher.

How to sell with divergences

When a divergence appears, it gives a signal to sell: the quotes set a new local high but the indicator does not confirm it. However, quite often signals from divergences go against the current trend, giving a good reason for closing profitable positions because a reversal becomes too possible.

As for opening new positions against the trend, here one needs to be extremely careful. Beginners should rather abstain from this. To open new positions, divergences during corrections are better. If there is a correction of a downtrend, and a divergence appears in the meantime, this is a good signal to sell. Positions should be open by the current trend

Example of selling by a divergence
  • On H1 of GBP/USD in an ascending correction the MACD signaled about a divergence.
  • After a local high formed and the price reversed downwards, a selling position by the trend can be opened.
  • Stop Loss is to be placed behind the last high, and Profit can be taken as soon as a strong support level is reached.
diver-sell-1014x630.png


Bottom line

Divergence and convergence stand for the process of diverging/converging of the price chart and the trading indicator. These are good trading signals used for opening and closing positions.

To make signals more efficient, the divergence/convergence should be used alongside other instruments of tech analysis. Before trading for real, practice on a demo account.

Read more at R Blog - RoboForex

Sincerely,
RoboForex team
 
Why ChargePoint Shares Are Interesting Investment

Author: Eugene Savitsky

5.jpg


Dear Clients and Partners,

Every year, more and more electric cars are sold all over the world. In 2021, 6.75 million electric cars were sold, i.e. 120% more than in 2020. If not for the shortage of semiconductors, the result would have been even more stunning. Today the overall number of sold electric cars in the world reaches almost 16 million, which is 8.5% of all vehicles.

For comfortable driving, electric cars require lots of charging points. The demand for the development of charging stations network makes companies from this segment quite appealing for investments. The leader of the segment is ChargePoint Holdings Inc. (NYSE: CHPT). This is the corporation that this article is devoted to.

What we know about ChargePoint Holdings

This company, founded in 2007, makes equipment and software for charging electric vehicles. As checked on 31 January 2022, Charge Point Holdings manages the world’s largest network of charging stations – 174,000 stations in 16 countries. 51,000 out of them are situated in Europe.

The company has carried out 13 rounds of investments, and the list of those eager to invest in its development features, among other companies, Daimler AG, BMW Siemens AG, Chevron Corp, Toyota Motor Corp, American Electric Power, Canada Pension Plan Investment Board, Singapore GIC, and Chevron Technology Ventures.

Note the participation of Canada Pension Plan Investment Board and Singapore GIC. Such large and conservative trusts investing in the company means that they consider ChargePoint promising.

Moreover, Canada Pension Plan Investment Board and Singapore GIC can now lobby the interests of the company in their home countries. This will not only let the American company increase its presence in the market but also step further away from the nearest rival – such as Blink Charging Co. (NASDAQ: BLNK).

Tech analysis of ChargePont Holdings shares

ChargePoint Holdings shares are trading in a downtrend, and here is an explanation of why it is normal. After the agitation of 2020, the shares of the corporation grew by 220% to 50 USD, and the capitalization reached 16.5 billion USD. However, the revenue at that time only reached 40 million USD.

To compare: the capitalization of ROKU Inc. (NASDAQ: ROKU) is now 16.7 billion USD, while its quarterly income is 865 million USD, and the net profit is 23 million USD.

The share price of ChargePoint Holdings did not stay at such levels for long and started descending gradually. The first strong support level at which market players started buying the shares was at 20 USD and stayed there for long. The quotations tested it 4 times, bouncing off each time and then rising by 30-85%.

chpt-1200x620.png


Now the resistance level of 15.5 USD should be noted, and a breakaway of this will be the first signal for possible growth of the price to 20 USD. And then, if the quotations manage to rise over 20 USD, the trend might reverse and start a long-term uptrend. This breakaway will mean a breakaway of the descending trendline.

Closing thoughts

ChargePoint Holdings is the leader in the market of electric car chargers. The growth in the sales of electric cars will provoke stable increased demand for the produce of the company.

Currently, investments in ChargePoint Holdings can be regarded as long-term. The risk here is an increase in the interest rate of the Fed that will make the debts of the company also grow. For now, this is the only weak point.

Read more at R Blog - RoboForex

Sincerely,
RoboForex team
 
Dear traders!

This week, RoboForex's project called ContestFX invites everyone to take part in the following competitions:

The 132nd competition of "Demo Forex" kicked off seven days ago.
The 352nd competition of "Week with CFD" has started today.
486th competition of "Trade Day" will start on 16.03.2022 at 12:00.
400th competition of "KingSize MT5" will start on 17.03.2022 at 20:00.

If you want to enter the Forex market without an initial deposit, it's time to win in our demo competitions. All winners of our competitions get prize money credited to their real accounts, so they can use them to earn on the Forex market without investing their own savings.

Good luck to all!

Sincerely,
RoboForex Contest
 
Back
Top