What do you think about this system that call stop hunting :
Because the human mind naturally seeks order, most stops are clustered around round numbers ending in "00". For example, if the EUR/USD pair was trading at 1.2470 and rising in value, most stops would reside within one or two points of the 1.2500 price point rather than, say, 1.2517. This fact alone is valuable knowledge, as it clearly indicates that most retail traders should place their stops at less crowded and more unusual locations.
More interesting, however, is the possibility of profit from this unique dynamic of the currency market. The fact that the FX market is so stop driven gives scope to several opportunistic setups for short-term traders. In her book "Day Trading The Currency Market" (2005), Kathy Lien describes one such setup based on fading the "00" level. The approach discussed here is based on the opposite notion of joining the short-term momentum.
Taking Advantage of the Hunt
The "stop hunting with the big specs" is an exceedingly simple setup, requiring nothing more than a price chart and one indicator. Here is the setup in a nutshell: On a one-hour chart, mark lines 15 points of either side of the round number. For example, if the EUR/USD is approaching the 1.2500 figure, the trader would mark off 1.2485 and 1.2515 on the chart. This 30-point area is known as the "trade zone", much like the 20-yard line on the football field is known as the "redzone". Both names communicate the same idea - namely that the participants have a high probability of scoring once they enter that area.
The idea behind this setup is straightforward. Once prices approach the round-number level, speculators will try to target the stops clustered in that region. Because FX is a decentralized market, no one knows the exact amount of stops at any particular "00" level, but traders hope that the size is large enough to trigger further liquidation of positions - a cascade of stop orders that will push price farther in that direction than it would move under normal conditions. Therefore, in the case of long setup, if the price in the EUR/USD was climbing toward the 1.2500 level, the trader would go long the pair with two units as soon as it crossed the 1.2485 threshold. The stop on the trade would be 15 points back of the entry because this is a strict momentum trade. If prices do not immediately follow through, chances are the setup failed. The profit target on the first unit would be the amount of initial risk or approximately 1.2500, at which point the trader would move the stop on the second unit to breakeven to lock in profit. The target on the second unit would be two times initial risk or 1.2515, allowing the trader to exit on a momentum burst. Aside from watching these key chart levels, there is only one other rule that a trader must follow in order to optimize the probability of success. Because this setup is basically a derivative of momentum trading, it should be traded only in the direction of the larger trend. There are numerous ways to ascertain direction using technical analysis, but the 200-period simple moving average (SMA) on the hourly charts may be particularly effective in this case. By using a longer term average on the short-term charts, you can stay on the right side of the price action without being subject to near-term whipsaw moves. (For more insight, see Momentum Trading With Discipline.)
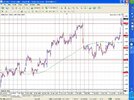
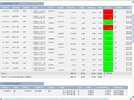
Look at the pic and note that on June 8, 2006 the EUR/USD is trading well below its 200 SMA, indicating that the pair is in a strong downtrend (Figure 1). As prices approach the 1.2700 level from the downside, the trader would initiate a short the moment price crosses the 1.2715 level, putting a stop 15 points above the entry at 1.2730. In this particular example, the downside momentum is extremely strong as traders gun stops at the 1.2700 level within the hour. The first half of the trade is exited at 1.2700 for a 15-point profit and the second half is exited at 1.2685 generating 45 points of reward for only 30 points of risk.
Because the human mind naturally seeks order, most stops are clustered around round numbers ending in "00". For example, if the EUR/USD pair was trading at 1.2470 and rising in value, most stops would reside within one or two points of the 1.2500 price point rather than, say, 1.2517. This fact alone is valuable knowledge, as it clearly indicates that most retail traders should place their stops at less crowded and more unusual locations.
More interesting, however, is the possibility of profit from this unique dynamic of the currency market. The fact that the FX market is so stop driven gives scope to several opportunistic setups for short-term traders. In her book "Day Trading The Currency Market" (2005), Kathy Lien describes one such setup based on fading the "00" level. The approach discussed here is based on the opposite notion of joining the short-term momentum.
Taking Advantage of the Hunt
The "stop hunting with the big specs" is an exceedingly simple setup, requiring nothing more than a price chart and one indicator. Here is the setup in a nutshell: On a one-hour chart, mark lines 15 points of either side of the round number. For example, if the EUR/USD is approaching the 1.2500 figure, the trader would mark off 1.2485 and 1.2515 on the chart. This 30-point area is known as the "trade zone", much like the 20-yard line on the football field is known as the "redzone". Both names communicate the same idea - namely that the participants have a high probability of scoring once they enter that area.
The idea behind this setup is straightforward. Once prices approach the round-number level, speculators will try to target the stops clustered in that region. Because FX is a decentralized market, no one knows the exact amount of stops at any particular "00" level, but traders hope that the size is large enough to trigger further liquidation of positions - a cascade of stop orders that will push price farther in that direction than it would move under normal conditions. Therefore, in the case of long setup, if the price in the EUR/USD was climbing toward the 1.2500 level, the trader would go long the pair with two units as soon as it crossed the 1.2485 threshold. The stop on the trade would be 15 points back of the entry because this is a strict momentum trade. If prices do not immediately follow through, chances are the setup failed. The profit target on the first unit would be the amount of initial risk or approximately 1.2500, at which point the trader would move the stop on the second unit to breakeven to lock in profit. The target on the second unit would be two times initial risk or 1.2515, allowing the trader to exit on a momentum burst. Aside from watching these key chart levels, there is only one other rule that a trader must follow in order to optimize the probability of success. Because this setup is basically a derivative of momentum trading, it should be traded only in the direction of the larger trend. There are numerous ways to ascertain direction using technical analysis, but the 200-period simple moving average (SMA) on the hourly charts may be particularly effective in this case. By using a longer term average on the short-term charts, you can stay on the right side of the price action without being subject to near-term whipsaw moves. (For more insight, see Momentum Trading With Discipline.)
Look at the pic and note that on June 8, 2006 the EUR/USD is trading well below its 200 SMA, indicating that the pair is in a strong downtrend (Figure 1). As prices approach the 1.2700 level from the downside, the trader would initiate a short the moment price crosses the 1.2715 level, putting a stop 15 points above the entry at 1.2730. In this particular example, the downside momentum is extremely strong as traders gun stops at the 1.2700 level within the hour. The first half of the trade is exited at 1.2700 for a 15-point profit and the second half is exited at 1.2685 generating 45 points of reward for only 30 points of risk.
")