acetraderfx
AceTrader.com Representative
- Messages
- 1,109
DAILY USD/CHF TECHNICAL OUTLOOK
27 Feb 2014 00:28GMT
Trend Daily Chart
Sideways
Daily Indicators
Falling
21 HR EMA
0.8899
55 HR EMA
0.8889
Trend Hourly Chart
Nr term up
Hourly Indicators
Easing fm o/bot
13 HR RSI
63
14 HR DMI
+ve
Daily Analysis
Consolidation with upside bias
Resistance
0.8989 - Feb 11 top
0.8967 - Min. 38.2% r of 0.9156-0.9050
0.8930 - Y'day's low
Support
0.8892 - Tue's high (now sup)
0.8850 - Mon's low
0.8800 - Dec 2-year low (27th)
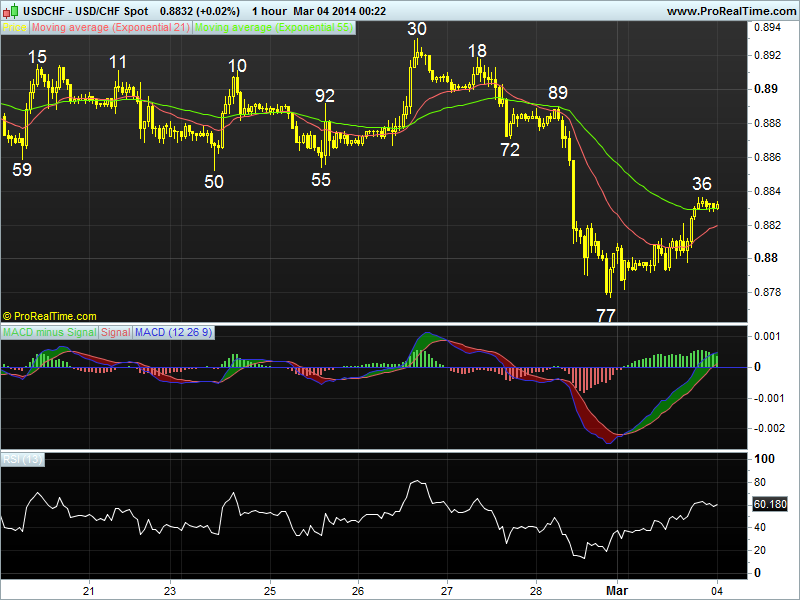
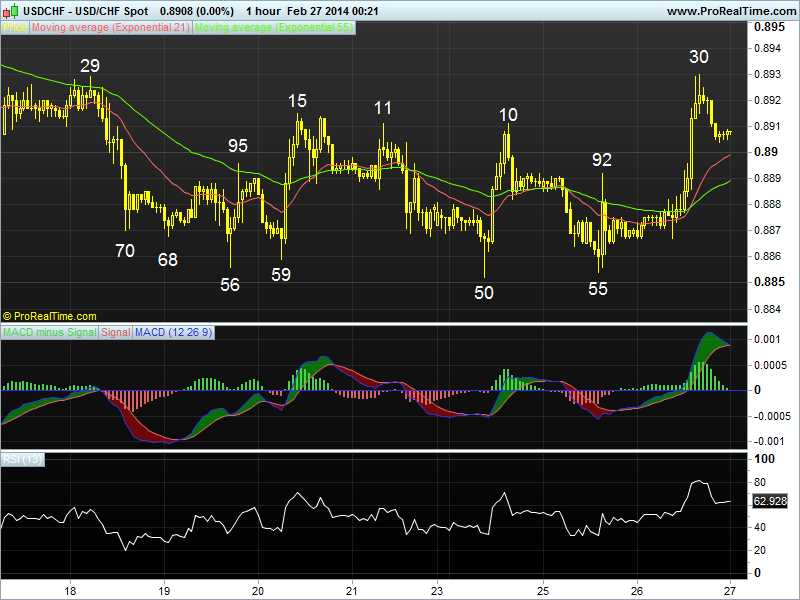
. USD/CHF - 0.8910... Although dlr traded sideways after finding sup at
0.8867 in Asia on Wed, price started to ratchet higher in Europe due to euro's
intra-day weakness. Later, dlr rallied to 0.8930 in NY morning as U.S. Jan new
home sales rose unexpectedly b4 retreating to 0.8904 near NY close.
. Looking at hourly n daily charts, y'day's breach of indicated res at
0.8910/15 (Mon's high n Feb's 20 high respectively) confirms decline fm Jan's
peak at 0.9156 has formed a temporary bottom at Mon's 8-week trough at 0.8850 n
as long as this sup holds, consolidation with upside bias remains for gain twd
0.8967, being 'minimum' 38.2% r of 0.9156-0.8850, however, as hourly oscillators
wud be in o/bot territory on such a move, measured res at 0.8993/03, 61.8% r of
intermediate fall fm 0.9082-0.8850 n also a 'natural' 50% r of aforesaid entire
decline respectively, shud hold n yield strg retreat later.
. In view of abv analysis, buying dlr on intra-day pullback is favoured but
one shud be prudent to take profit twd 0.8960/70. On the downside, only a break
below 0.8850 sup wud revive early bearishness instead for subsequent weakness
twd Dec's 2-year trough at 0.8800 tom or early next week.
27 Feb 2014 00:28GMT
Trend Daily Chart
Sideways
Daily Indicators
Falling
21 HR EMA
0.8899
55 HR EMA
0.8889
Trend Hourly Chart
Nr term up
Hourly Indicators
Easing fm o/bot
13 HR RSI
63
14 HR DMI
+ve
Daily Analysis
Consolidation with upside bias
Resistance
0.8989 - Feb 11 top
0.8967 - Min. 38.2% r of 0.9156-0.9050
0.8930 - Y'day's low
Support
0.8892 - Tue's high (now sup)
0.8850 - Mon's low
0.8800 - Dec 2-year low (27th)
. USD/CHF - 0.8910... Although dlr traded sideways after finding sup at
0.8867 in Asia on Wed, price started to ratchet higher in Europe due to euro's
intra-day weakness. Later, dlr rallied to 0.8930 in NY morning as U.S. Jan new
home sales rose unexpectedly b4 retreating to 0.8904 near NY close.
. Looking at hourly n daily charts, y'day's breach of indicated res at
0.8910/15 (Mon's high n Feb's 20 high respectively) confirms decline fm Jan's
peak at 0.9156 has formed a temporary bottom at Mon's 8-week trough at 0.8850 n
as long as this sup holds, consolidation with upside bias remains for gain twd
0.8967, being 'minimum' 38.2% r of 0.9156-0.8850, however, as hourly oscillators
wud be in o/bot territory on such a move, measured res at 0.8993/03, 61.8% r of
intermediate fall fm 0.9082-0.8850 n also a 'natural' 50% r of aforesaid entire
decline respectively, shud hold n yield strg retreat later.
. In view of abv analysis, buying dlr on intra-day pullback is favoured but
one shud be prudent to take profit twd 0.8960/70. On the downside, only a break
below 0.8850 sup wud revive early bearishness instead for subsequent weakness
twd Dec's 2-year trough at 0.8800 tom or early next week.
Last edited by a moderator: