AceTraderFx Jun 25: Weekly/Daily Technical Outlook & Trading Ideals on GBP/USD

acetraderfx

AceTrader.com Representative
Messages
1,109
DAILY TECHNICAL OUTLOOK ON GBP/USD

Last Update At 25 Jun 2014 00:16GMT

Trend Daily Chart

Up

Daily Indicators
Rising

21 HR EMA
1.6991

55 HR EMA
1.7004

Trend Hourly Chart
Nr term down

Hourly Indicators

Rising fm o/s

13 HR RSI
38

14 HR DMI
-ve

Daily Analysis
Consolidation with downside bias

Resistance
1.7091 - 61.8% proj. of 1.6738-1.7011 fm 1.6922
1.7064 - Last Thur's fresh 5-1/2 year peak
1.7034 - Y'day's high

Support
1.6966 - Y'day's low
1.6920 - Last Wed's low
1.6878 - 50% r of 1.6693-1.7064


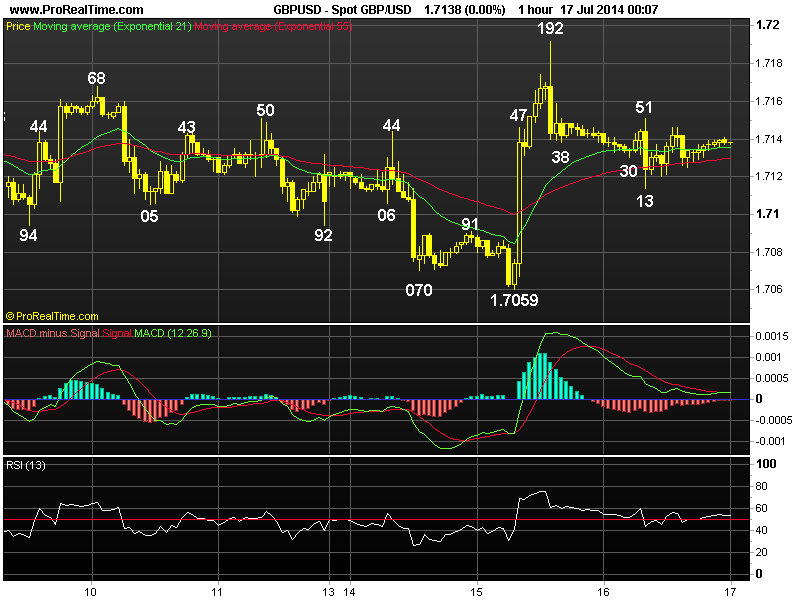
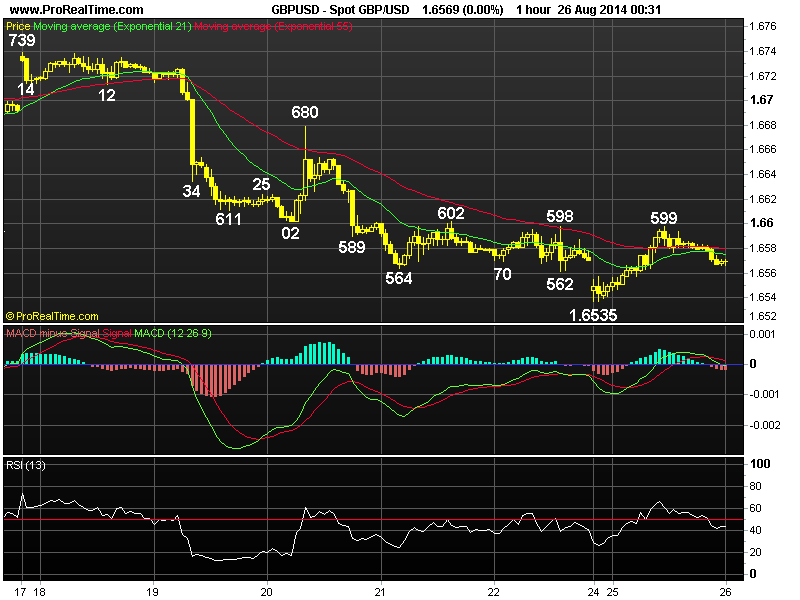
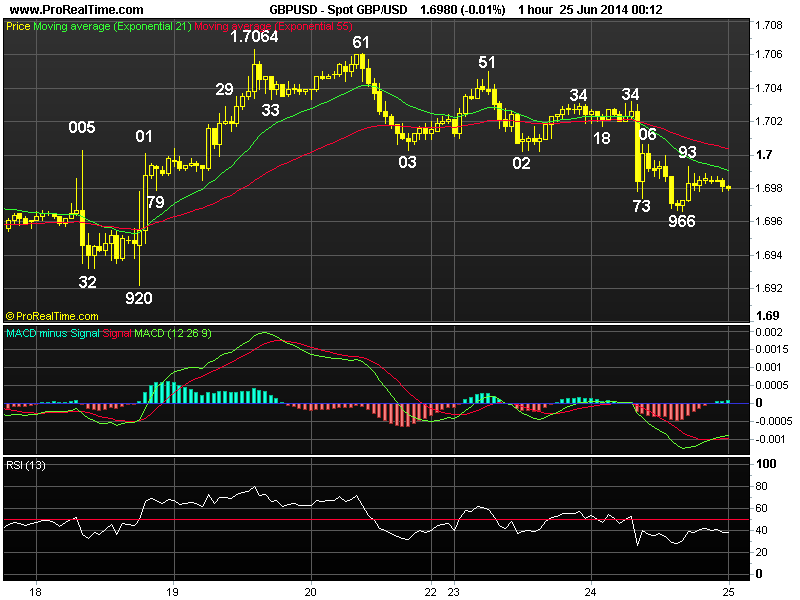
. GBP/USD - 1.6980... Despite cable's sideways move after retreating fm Australian high of 1.7034 to 1.7017 in Asia, price tumbled to 1.6973 in European morning after dovish remarks fm BoE Governor Mark Carney. Later, cable fell further to 1.6966 in NY session due to upbeat U.S. economic data b4 recovering.

. Looking at the hourly n daily charts, although cable's brief breach of
key res at 1.7044 (2009 Aug's reaction high fm Jan's 24-year trough at 1.3500) last week to a 5-1/2 year peak at 1.7064 on Thur confirms the near 5-year long broad sideways consolidation has ended n aforesaid rise to correct LT downtrend fm 2.1162 (2007 multi-decade peak) is expected to head to 1.7136 in early July, y'day's breach of Mon's low at 1.7002 suggest a long-awaited correction has occured n consolidation with downside bias is seen for a retracement twd 1.6920 (last week's low). Having said that, as hourly oscillators wud display minor bullish convergences on such a move, reckon 1.6878, this is the 'natural' 50% r of 1.6993-1.7064, wud hold n yield strg rebound later this week.

. Today, selling cable on recovery for weakness to 1.6920 is recommended. Only abv 1.7064 aborts this mildly bearish scenario n extends gain twd 1.7095.


GBP%20jun%2025.png
 
Last edited by a moderator:
AceTraderFx Jul 17: Daily Technical Outlook & Trading Ideals on GBP/USD

DAILY GBP/USD TECHNICAL OUTLOOK

Last Update At 17 Jul 2014 00:10GMT

Trend Daily Chart
Up

Daily Indicators
Bearish divergences

21 HR EMA
1.7136

55 HR EMA
1.7130

Trend Hourly Chart
Up

Hourly Indicators
Neutral

13 HR RSI
52

14 HR DMI
+ve

Daily Analysis
One more rise b4 correction

Resistance
1.7287 - 100% proj. of 1.6952-1.7180 fm 1.7059
1.7230 - 100% proj. of 1.6460-1.6997 fm 1.6693
1.7192 - Tue's fresh near 6-year high

Support
1.7113 - Y'day's low
1.7085 - Last week's low (Jul 08)
1.7059 - Y'day's low


. GBP/USD - 1.7138 ... The British pound chopped around in a tight range as eur/usd took centre stage in Wed's session. Despite edging higher to intra-day top at 1.7151 in Europe, price briefly dipped to session low of 1.7113 after UK wage rise came in lower than forecast, cable later moved narrowly in NY trading.

. Looking at the hourly & daily charts, Tue's rally to a fresh near 6-year peak of 1.7192 confirms long-term uptrend has once again resumed n as long as 1.7059 sup holds, gain twd 1.7230 is envisaged (being 100% projection of 1.6460-1.6997 measured fm 1.6693). Having said that, as both hourly & daily technical indicators wud display prominent 'bearish divergences' on such move, reckon 1.7303, this is 50% proj. of intermediate rise fm 1.6693-1.7180 measured fm 1.7059 shud cap upside n risk has increased for a long-overdue strg correction to take place later this month, so die-hard sterling bulls shud book profit on upmove. A daily close below 1.7059 wud confirm temporary top is in place n risk wud shift to the downside for subsequent weakness twd 1.6942 (50% r of 1.6693-1.7180).

. Today, as long as said y'day's 1.7113 low holds, resumption of uptrend to 1.7200 is envisaged but 1.7225/30 shud remain intact. Below 1.7113, 1.7085.

GBP%20jul%2017.png
 
Last edited by a moderator:
AceTraderFx Jul 30: Daily Technical Outlook & Trading Ideals on GBP/USD

DAILY GBP/USD TECHNICAL OUTLOOK

Last Update At 30 Jul 2014 00:48GMT

Trend Daily Chart
Up

Daily Indicators
Falling

21 HR EMA
1.6953

55 HR EMA
1.6938

Trend Hourly Chart
Down

Hourly Indicators
Bullish convergences

13 HR RSI
69

14 HR DMI
-ve

Daily Analysis
Consolidation b4 marginal fall

Resistance
1.7054 - Last Thur's high
1.7024 - Last Wed's low (now res)
1.6995 - Y'day's high

Support
1.6934 - Y'day's low
1.6920 - Jun 18 low
1.6884 - 61.8% r of 1.6693-1.7180


. GBP/USD - 1.6946 ... Despite cable's brief drop to 1.6968 ahead of European open on Tue, the pair rebounded briefly to 1.6995 on short-covering in Europe but selling interest quickly emerged n cable tumbled to 1.6933 in NY morning after the release of much stronger-than-expected US consumer confidence.

. Looking at the daily picture, last week's break of 1.7037 strongly suggests the LT uptrend has formed a temporary top at 1.7192 n y'day's breach of indicated daily sup at 1.6952 confirms this view n further weakness to 1.6919/20 (61.8% projection of 1.7095-1.6962 measured fm 1.7001 n Jun 18 low respectively) wud be seen, however, as hourly oscillators' readings have displayed 'bullish convergences', steep decline is unlikely to be seen. Going forward, a daily close below 1.6920 wud send cable lower to 1.6845 n then twd 1.6738 in Aug.

. Today, we're holding a short position in anticipation of marginal weakness to 1.6920 n wud look to sell cable again on subsequent recovery as only abv 1.6995/01 res area (y'day's n Mon's high respectively) wud confirm a temp. low is made n risk retracement to 1.7024, break wud bring stronger gain to 1.7054, however, 1.7095/99 res area is expected to remain intact.


GBP%20jul%2030.png
 
Last edited by a moderator:
AceTraderFx Aug 5: Daily Technical Outlook & Trading Ideals on USD/GBP

DAILY GBP/USD TECHNICAL OUTLOOK

Last Update At 05 Aug 2014 00:32GMT

Trend Daily Chart
Down

Daily Indicators
Falling

21 HR EMA
1.6848

55 HR EMA
1.6854

Trend Hourly Chart
Sideways

Hourly Indicators
Rising

13 HR RSI
68

14 HR DMI
+ve

Daily Analysis
Marginal recovery b4 strg retreat

Resistance
1.6956 - Last Wed's high
1.6928 - Last Wed's NY high
1.6893 - Last Thur's NY high

Support
1.6812 - Last Fri's 6-week low
1.6785 - Jun 12 low
1.6738 - Jun 11 low


. GBP/USD - 1.6864... Despite cable's brief drop to 1.6813 in Europe Mon after last Fri's brief bounce fm a fresh 6-week low of 1.6812 to 1.6862, renewed buying emerged n lifted price higher. Cable ratcheted higher on cross buying in sterling to 1.6864 in late NY, then 1.6867 ahead of Asian open today.

. Y'day's cross-inspired strg rebound after holding abv last Fri's low at 1.6812 suggests choppy consolidation wud be seen n as hourly indicators are rising, suggesting as long as 1.6812/13 sup area holds, upside bias remains for a stronger retracement of erratic decline fm Jul's near 6-year peak at 1.7192 n gain to 1.6884 may be seen but 1.6907 wud hold (being 38.2% n 50% r of intermediate fall fm 1.7001) n yield strg retreat. On the upside, only a daily close abv 1.6933 wud confirm temp. low is in place, then stronger gain twd 1.7001 (last week's high on Mon) wud be seen b4 down. Looking ahead, cable's early sell off fm 1.7192 to 1.6995 confirms a major top has been made n price is en route twd next daily chart obj. at 1.6738 later.

. Today, we're selling cable on intra-day rise for one more fall or buy if price briefly drops below 1.6812 in anticipation of another corrective bounce.

GBP%20aug%2005.png
 
Last edited by a moderator:
AceTraderFx Aug 11: Weekly Technical Outlook & Trading Ideals on GBP/USD

WEEKLY GBP/USD TECHNICAL OUTLOOK
Last Update At 11 Aug 2014 00:18GMT

Trend Daily Chart
Down

Daily Indicators
Falling

21 HR EMA
1.6789

55 HR EMA
1.6812

Trend Hourly Chart
Down

Hourly Indicators
Falling

13 HR RSI
39

14 HR DMI
-ve

Daily Analysis
Consolidation b4 decline resumes

Resistance
1.6890 - Last Tue's high
1.6865 - Last Thur's high
1.6812 - Jul 31 low (now res)

Support
1.6767 - Last Fri's low
1.6738 - Jun 11 low
1.6693 - May 29 low

GBP/USD - 1.6780... Despite staging a minor recovery to 1.6890 last Tue, the British pound continued its recent decent fm Jul's near 6-year peak at 1.7192 to a 7-week low of 1.6767 on Fri due to active selling of gbp vs eur & yen.

. Looking at the bigger picture, cable's aforesaid sell off from 1.7192 confirms the LT uptrend fm 1.3500 (2009 bottom) has indeed made a top there n current declining daily technical indicators suggest price is en route to re-test next daily chart obj. at 1.6693 (May's low), break of this key sup wud pressure price to 1.6655, being 61.8% proj. of said fall fm 1.7192 to 1.6812 measured fm 1.6890, as both daily & hourly oscillators' readings wud be in o/sold territory on such a move, steep fall is therefore not envisaged n reckon 1.6523, this is the 'natural' 50% r of the intermediate rise fm 1.5854 to 1.7192), wud contain weakness n bring correction later. Whilst selling cable again on recovery is the way to go, profit shud be taken on subsequent decline. On the upside, only abv 1.6890 wud confirm a temporary low is made but 1.6933 shud cap upside.

. Today, in view of abv analysis, selling cable on intra-day recovery is recommended but 1.6693 shud remain intact n bring minor correction.

GBP%20aug%2011.png
 
Last edited by a moderator:
AceTraderFx Aug 26: Daily Technical Outlook & Trading Ideals on GBP/USD

DAILY GBP/USD TECHNICAL OUTLOOK
Last Update At 26 Aug 2014 00:38GMT

Trend Daily Chart
Down

Daily Indicators
Falling

21 HR EMA
1.6575

55 HR EMA
1.6580

Trend Hourly Chart
Sideways

Hourly Indicators
Neutral

13 HR RSI
45

14 HR DMI
+ve

Daily Analysis
Consolidation b4 marginal fall

Resistance
1.6680 - Last Wed's high
1.6655 - Last Wed's NY high
1.6602 - Last Thur's high

Support
1.6535 - Y'day's NZ low
1.6523 - 50% r of 1.5854-1.7192
1.6460 - Mar 24 low


. GBP/USD - 1.6570... The British pound opened lower in tandem with euro
to 1.6535 in NZ on Mon following Fri's balanced comments fm Fed Chair Yellen n
Sat's 'dovish' remarks from BOE Dep. Governor Ben Broadbent in Jackson Hole but
short-covering lifted price to 1.6599 ahead of NY open b4 retreating.

. Although cable's rebound fm said y'day's fresh 4-1/2 month trough at
1.6535 suggests a temporary low has been been made n choppy consolidation wud be
seen, as daily technical indicators are still pointing hard down, suggesting as
long as 1.6655/57 (being 38.2% r of 1.6850-1.6535 n Aug 14 low, now res respect-
ively) holds, bearishness remains for MT decline fm Jul's near 6-year peak at
1.7192 to resume n yield a re-test of said sup, below wud extend marginal weak-
ness below 1.6523 (50% r of LT intermediate rise fm 1.5854-1.7192), however,
prominent 'bullish convergences' on the hourly oscillators shud limit downside
to 1.6500/10 n yield a much-needed correction later.

. Today, selling cable on further recovery in anticipation of a resumption
of decline is still favoured, however, one may turn cautious buyer on next margi
nal fall for a rebound but reckon 1.6657 (prev. low, now res) shud cap upside.

GBP%20aug%2026.png
 
Last edited by a moderator:
AceTraderFx Sept 1:Weekly Technical Outlook & Trading Ideals on GBP/USD

WEEKLY GBP/USD TECHNICAL OUTLOOK
Last Update At 01 Sep 2014 00:05GMT

Trend Daily Chart
Down

Daily Indicators
Falling

21 HR EMA
1.6589

55 HR EMA
1.6586

Trend Hourly Chart
Sideways

Hourly Indicators
Neutral

13 HR RSI
53

14 HR DMI

+ve

Daily Analysis
Consolidation b4 one more fall

Resistance
1.6680 - Last Wed's high
1.6657 - Aug 14 low
1.6615 - Last Thur's high

Support
1.6535 - Last Mon's low (NZ)
1.6523 - 50% r of 1.5854-1.7192
1.6460 - Mar 24 low


. GBP/USD - 1.6593... Despite a gap-down open to a 4-1/2 month trough of 1.6535 in NZ last Mon, cable swung wildly for rest of the week. Price staged a short-covering rebound to 1.6599 on Mon b4 falling back to 1.6537 at Wed open but only to climb to a 1-week high of 1.6615 Thur, then moved sideways on Fri.

. Looking at the bigger picture, although sterling finally found respite after enduring 6 weeks of losing streak n initial choppy trading abv 1.6535 is envisaged, a daily close abv 1.6657 (prev. low) is needed to confirm MT fall fm 2014 6-year peak at 1.7192 (Jul) has finally made a temporary low, then stronger gain to 1.6680 res wud be seen, a break there wud violate the recent series of lower highs n lower lows n yield corerction twd 1.6864 (50% r of 1.7192-1.6535).

Until then, as dlr is expected to rise vs its major peers, selling the pound in anticipation of resumption of MT downtrend to 1.6523 (50% r of LT intermediate rise fm 1.5854-1.7192) is still favoured, reckon daily up at 1.6460 (Mar low) may hold on 1st testing.

. Today, intra-day weakness in eur/usd shud weigh on cable n as long as 1.6615 holds, decline twd 1.6535 is likely n only abv 1.6555/57 risks 1.6580.

GBP%20SEP%2001.png
 
Last edited by a moderator:
AceTraderFx Nov 20: Daily Technical Outlook & Trading Ideals on GBP/USD

DAILY GBP/USD TECHNICAL OUTLOOK
Last Update At 20 Nov 2014 00:42GMT

Trend Daily Chart
Down

Daily Indicators
Bullish convergences

21 HR EMA
1.5666

55 HR EMA
1.5660

Trend Hourly Chart
Near term up

Hourly Indicators
Neutral

13 HR RSI
55

14 HR DMI
+ve

Daily Analysis
Choppy consolidation to continue

Resistance
1.5760 - Last Thur's Aust. low
1.5737 - Mon's high
1.5720 - Y'day's NY high

Support
1.5647 - Y'day's NY low
1.5620 - Mon's low
1.5590 - Y'day's fresh 14-mth low

. GBP/USD - 1.5674 ... Despite cable's brief drop below last Fri's 1.5593 low to 1.5590 (1.55895 to be exact) in Europe, price jumped n later rallied to 1.5701 at European midday after MPC minutes showed 2 policy makers supported a rate rise. Price later climbed to 1.5720 after FOMC minutes b4 retreating.

. Looking at the hourly & daily charts, cable's rally fm y'day's fresh 14-month trough at 1.5590 to as high as 1.5720 signals MT downtrend fm Jul's near 6-year peak at 1.7192 has made a temporary low there as aforesaid low was accompanied by prominent 'bullish convergences' on the hourly oscillators, subsequent macd's rise abv the zero line adds credence to this view, suggesting a few days of choppy consolidation with upside bias wud be seen n abv 1.5737 res (this week's high) wud bring stronger gain to 1.5768, this is a 'natural' 50% r of the intermedaite fall fm 1.5945-1.5590.
On the downside, a daily close below 1.5620 wud signal correction is over, then one more fall twd 1.5636 wud follow.

. Today, intra-day softness following y'day's retreat fm 1.5720 suggests consolidation is in store with initial downside bias, however, reckon NY low at 1.5647 wud contain weakness n bring another rebound, abv 1.5720, 1.5737.
GBP%20nov%2020%281%29.png
 
Last edited by a moderator:
AceTraderFx Nov 25: Daily Technical Outlook & Trading Ideals on GBP/USD

DAILY GBP/USD TECHNICAL OUTLOOK
Last Update At 24 Nov 2014 23:59GMT

Trend Daily Chart
Down

Daily Indicators
Bullish convergences

21 HR EMA
1.5685

55 HR EMA
1.5676

Trend Hourly Chart
Sideways

Hourly Indicators
Rising

13 HR RSI
56

14 HR DMI
+ve

Daily Analysis
Consolidation with mild downside bias

Resistance
1.5790 - Nov 07 low
1.5768 - 50% r of 1.5945-1.5590
1.5737 - Last Mon's n Thur's high

Support
1.5672 - Y'day's NY hourly sup
1.5626 - Last Fri's low
1.5590 - Last Wed's fresh 14-mth low

. GBP/USD - 1.5695 ... Despite opening lower to 1.5633 in New Zealand on Mon, the British pound rebounded to 1.5673 at European open, however, price briefly retreated to 1.5629 in tandem with eur/usd before rising to 1.5694 in NY morning. Cable later climbed to session high of 1.5715 b4 easing.

. Y'day's strg rebound fm 1.5630 to 1.5715 suggests 'choppy' trading abv last Wed's 14-month trough of 1.5590 wud continue, however, as long as res at 1.5737 (last Mon's n Thur's high) holds, downside bias remains for MT downtrend fm Jul's near 6-year peak at 1.7192 to resume after consolidation, yield re-test of 1.5590 sup later, however, break needed to extend weakness to 1.5560, then 1.5518 (being 50% & 61.8% proj. respectively of 1.5945-1.5590 measured fm 1.5737), however, a daily technical indicators wud display 'bullish convergences' on such move, reckon 1.5346 wud contain weakness, this is the 'dynamic' 61.8% r of entire LT rise fm 1.3500 (2009 multi-decade low) to 1.7192.

. Today, we're cautiously holding a short position in anticipation of a retreat to 1.5630. On the upside, a daily close abv 1.5737 wud risk stronger retracement to 1.5818 (38.2% r of 1.6186-1.5590) b4 prospect of another decline.
GBP%20nov%2025%281%29.png
 
Last edited by a moderator:
AceTraderFx Dec 1: Weekly Technical Outlook & Trading Ideals on GBP/USD

WEEKLY GBP/USD TECHNICAL OUTLOOK
Last Update At 01 Dec 2014 00:07GMT

Trend Daily Chart
Sideways

Daily Indicators
Turning up

21 HR EMA
1.5660

55 HR EMA
1.5795

Trend Hourly Chart
Down

Hourly Indicators
Falling

13 HR RSI
32

14 HR DMI
-ve

Daily Analysis
Possible resumption of MT downtrend

Resistance
1.5778 - Last Thur's Asian low
1.5725 - Last Fri's European high
1.5680 - Last wed's low

Support
1.5603 - Intra-day low low
1.5590 - Nov 19 14-month low
1.5528 - 50% proj. of 1.6186-1.5590 fm 1.5826

. GBP/USD - 1.5617... Cable went through a roller-coaster session last wk. Although renewed buying at 1.5629 on Mon lifted price n continued short-covering helped price penetrate prev. week's high at 1.5737 on Wed. Cable climbed to 1.5826 Thur but only to tumble 1.5614 on Fri due to 2-day sell off in the Brent.

. Looking at bigger picture, cable's foresaid decline from 1.5826 signals the correction from November's 14-month bottom at 1.5590 has ended there n price is en-route to re-test said temporary low soon, break wud confirm the MT downtrend fm Jul's near 6-year peak at 1.7192 has once again resumed n yield further weakness to 1.5528, then 1.5458, being 50% & 61.8% projections respectively of intermediate fall fm 1.6186-1.5590 measured fm 1.5826. Having said that, as hourly & daily technical indicators wud display 'bullish convergence' on such move, reckon 1.5385 (100% proj. of 1.7192-1.6052 measured fm 1.6525) wud remain intact. On the upside, only abv 1.5826 wud confirm low is made n yield stronger correction twd next chart obj. at 1.5945 later this month.

. Today, price has fallen after meeting renewed selling at 1.5659 (AUS) n re-test of 1.5590 is envisaged, break wud extend to 1.5550/60 later today
GBP%20dec%2001.png
 
Last edited by a moderator:
Back
Top