AceTraderFx Jun 25: Weekly/Daily Technical Outlook & Trading Ideals on GBP/USD

AceTraderFx Dec 4:Daily Technical Outlook & Trading Ideals on GBP/USD


DAILY GBP/USD TECHNICAL OUTLOOK
Last Update At 04 Dec 2014 00:17GMT

Trend Daily Chart
Sideways

Daily Indicators
Turning up

21 HR EMA
1.5679

55 HR EMA
1.5678

Trend Hourly Chart

Sideways

Hourly Indicators
Neutral

13 HR RSI
57

14 HR DMI
+ve

Daily Analysis
Choppy consolidation to continue

Resistance
1.5826 - Last Thur's high
1.5763 - Mon's high
1.5719 - Y'day's high

Support
1.5619 - Y'day's low
1.5585 - Mon's fresh 14-1/2 month low
1.5528 - 50% proj. of 1.6186-1.5590 fm 1.5826

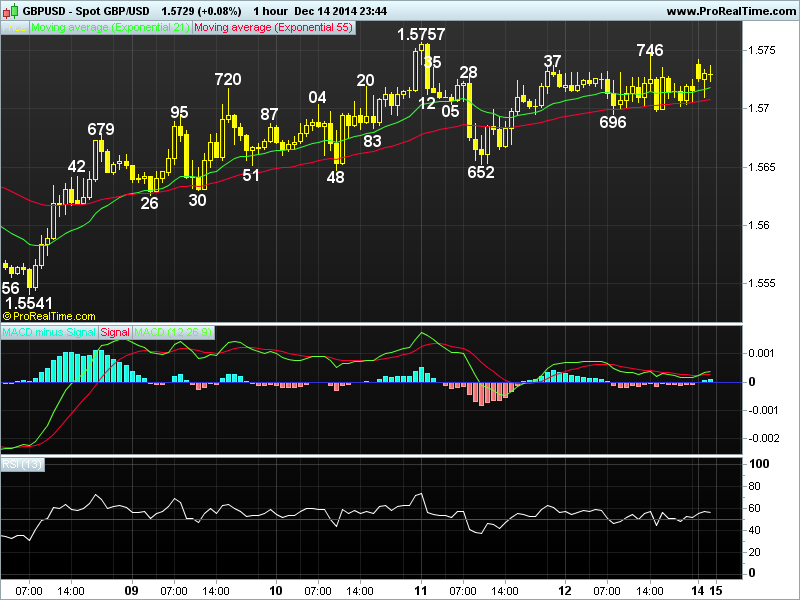
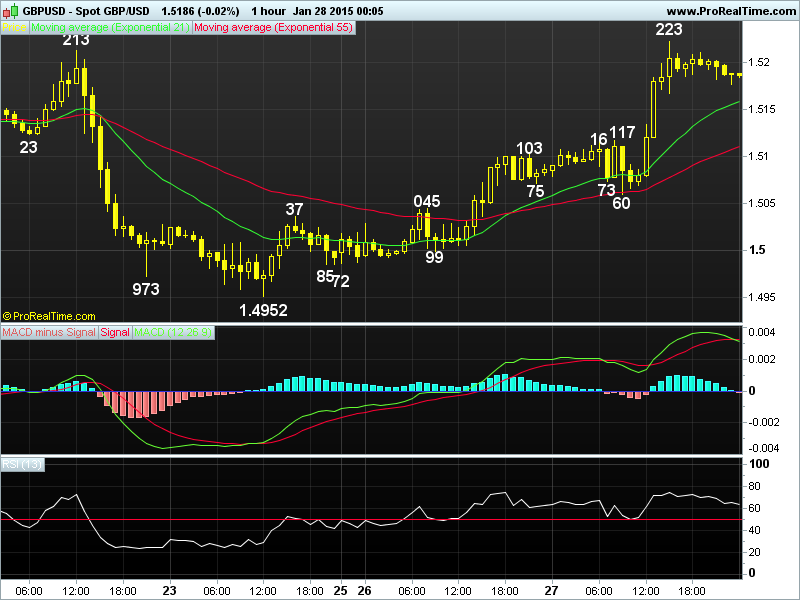
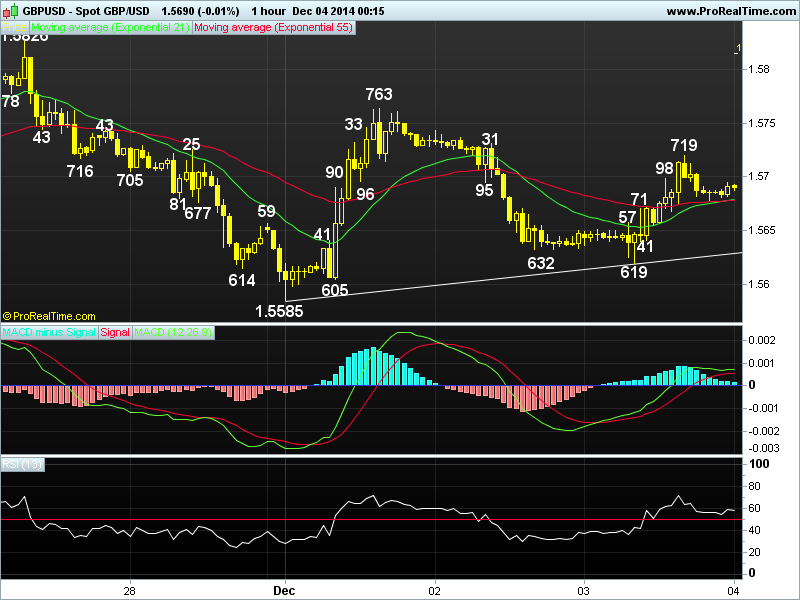
. GBP/USD - 1.5690... Cable swung wildly on Wed, despite a euro-led brief drop fm 1.5656 to 1.5619 in Europe, cross-buying in sterling lifted price n cable rebounded on short covering after upbeat U.K. services PMI n the upgrade of U.K. growth forecasts fm OBR. Price rose to 1.5719 in NY b4 retreating.

. Looking at the hourly n daily charts, despite cable's strg decline after Mon's rally fm a fresh 14-1/2 month trough at 1.5585 to 1.5763, y'day's rebound fm 1.5619 suggests further choppy trading abv said temporary bottom wud continue . Although consolidation with near term upside bias is seen, as long as 1.5763 res (reaction high) holds, prospect of another fall later today or tom still remains. Looking ahead, a breach of 1.5619 wud signal MT downtrend fm Jul's near 6-year peak at 1.7192 has resumed n bring re-test of 1.5585, break wud extend subsequent weakness to 1.5528, this is the 50% projection of intermediate fall fm 1.6186-1.5590 measured fm 1.5826.

. On the upside, abv 1.5763 wud confirm a temporary low is made instead n stronger retracement to 1.5826 wud follow. We are standing aside initially today n investors shud pay attention to the release of BoE rate decision at 12:00GMT.
gbp%20dec%2004.png
 
Last edited by a moderator:
AceTraderFx Dec 15: Weekly Technical Outlook & Trading Ideals on GBP/USD

WEEKLY GBP/USD TECHNICAL OUTLOOK
Last Update At 14 Dec 2014 23:46GMT

Trend Daily Chart
Down

Daily Indicators
Bullish convergences

21 HR EMA
1.5718

55 HR EMA
1.5708

Trend Hourly Chart
Sideways

Hourly Indicators
Neutral

13 HR RSI
56

14 HR DMI
+ve

Daily Analysis
Choppy consolidation to continue

Resistance
1.5791 - 61.8% r of 1.6145-1.5541
1.5763 - Last Mon's high
1.5557 - Y'day's high

Support
1.5652 - Y'day's low
1.5648 - Wed's low
1.5626 - Tue's low


. GBP/USD - 1.5728... Although cable opened lower in tandem with eur/usd last Mon n fell to a fresh 14-month trough at 1.5541, however, rebound in the single ccy quickly led to short-covering in sterling, the pound ratcheted higher to 1.5757 on Thur b4 retreating to 1.5652. Price rebounded to 1.5746 Fri in NY.

. On the bigger picture, as cable's aforesaid 2014 low at 1.5541 was accompanied by prominent 'bullish convergences' on the daily indicators, suggesting the MT downtrend fm Jul's near 6-year peak at 1.7192 has possibly formed a temporary low there, a daily close abv 1.5757 wud add credence to this view, then price wud be en route to next chart obj. at 1.5826, break wud encourage for further headway twd 1.5875 (Oct's low), then 1.5826. On the downside, only a failure to penetrate 1.5757 res n subsequent break below 1.5626/30 sup wud signal correction is over n yield re-test of 1.5541, then one more fall to 1.5500/10, however, reckon 1.5360 (equality measure. of 1.7192-1.6052 fm 1.6525) wud hold.

. Today, expect initial sideways move in Asia n as long as Fri's low at 1.5696 holds, intra-day upside bias for re-test of 1.5757 1st, abv wud encourage for subsequent gain to 1.5770 , then 1.5785/87. Only below 1.5752 risks 1.5626.
GBP%20dec%2015.png
 
Last edited by a moderator:
AceTraderFx Dec 19: Daily Technical Outlook & Trading Ideals on GBP/USD

DAILY GBP/USD TECHNICAL OUTLOOK
Last Update At 19 Dec 2014 00:06GMT

Trend Daily Chart
Down

Daily Indicators
Bullish convergences

21 HR EMA
1.5648

55 HR EMA
1.5654

Trend Hourly Chart
Nr term up

Hourly Indicators
Rising

13 HR RSI
58

14 HR DMI
+ve

Daily Analysis
Consolidation with upside bias

Resistance
1.5738 - Wed's European high
1.5699 - Post-FOMC high Wed
1.5676 - Y'day's high

Support
1.5605 - Y'day's NY morning sup
1.5539 - Thur's fresh 14-month low
1.5500 - Pychological sup

. GBP/USD - 1.5667... Although cable tracked euro's intra-day move closely in Asia n early Europe on Thur n fell fm 1.5594 to 1.5551, buying interest abv Wed's fresh 14-month low at 1.5539 lifted price fm there n cable later rallied to 1.5666 after upbeat U.K. retail sales n then 1.5676 in NY b4 easing.

. Looking at the hourly n daily charts, y'day's rally after holding abv Wed's fresh 14-month trough at 1.5539 strongly suggests the MT downtrend fm Jul's near 6-year peak at 1.7192 has formed a temporary low there n as long as 1.5605 (y'day's NY low) holds, stronger gain twd 1.5691/99 (being the 'dynamic' 61.8% r of 1.5785-1.5539 n post FOMC high respectively), abv there wud add credence to this view n further headway to 1.5738 (chart obj.) n then 1.5755 wud follow, however, as hourly oscillators wud be in o/bot territory on such a move, reckon 1.5755 (Wed's high) wud cap upside n yield strg retreat later.

. In view of abv analysis, buying cable on dips is cautiously favoured today. On the downside, only below 1.5539 wud revive early bearishness n
risk subsequent weakness twd 1.5500 (psychological sup) but 1.5463 (50% proj. of 1.6186-1.5541 measured fm 1.5785) shud remain intact.
GBP%20dec%2019%281%29.png
 
Last edited by a moderator:
AceTraderFx Jan 6: Daily Technical Outlook & Trading Ideals on GBP/USD

DAILY GBP/USD TECHNICAL OUTLOOK
Last Update At 06 Jan 2015 00:40GMT

Trend Daily Chart
Down

Daily Indicators
Bullish convergences

21 HR EMA
1.5267

55 HR EMA
1.5345

Trend Hourly Chart
Down

Hourly Indicators
Turning up

13 HR RSI
45

14 HR DMI
-ve

Daily Analysis
Consolidation b4 one more fall

Resistance
1.5386 - Hourly sup (now res)
1.5352 - 38.2% r of 1.5621-1.5185
1.5320 - Y'day Asian high

Support
1.5203 - Y'day's NY morning sup
1.5185 - Y'day's fresh 16-month low (Reuters)
1.5137 - 1.618 times extn of 1.5785-1.5486 fm 1.5621

. GBP/USD - 1.5263... Cable tracked euro's intra-day move closely on Mon. Despite falling sharply below Fri's low of 1.5326 to a fresh 16-month trough at 1.5185 (Reuters) in thin Aust., short-covering lifted pound to 1.5320 in Asia b4 dropping to 1.5203 in NY morning. Cable later recovered to 1.5270 near NY close.

. Looking at the bigger picture, as mentioned previously, cable's break of Dec's 1.5486 to on 1.5326 Fri signals MT downtrend fm 2014 peak at 1.7192 (Jul) has once again resumed n a re-test of said Mon's low wud be seen after consolidation, break wud extend weakness to 1.5137 (1.618 times extension of 1.5785-1.5486 measured fm 1.5621) n then 1.5100. Having said that, as the daily technical indicators wud display 'bullish convergences' on such move, reckon psychological sup at 1.5000 wud hold on 1st testing this week n risk a minor correction later. On the upside, only a daily close abv 1.5486 wud signal a temporary low is made, then retracement to 1.5555 n possibly twd 1.5621 is likely b4 down.

. Today, as 1.5320 has capped rebound fm 1.5185, selling cable on intra-day recovery is recommended. On the upside, only abv 1.5352 (38.2% r of 1.5621-1.5185) risks retracement twd 1.5403 (50% r) but 1.5454 (61.% r) shud hold.
GBP%20jan%2006%281%29.png
 
Last edited by a moderator:
AceTraderFx Jan 12: Weekly Technical Outlook & Trading Ideals on GBP/USD

WEEKLY GBP/USD TECHNICAL OUTLOOK
Last Update At 11 Jan 2015 23:51GMT

Trend Daily Chart
Down

Daily Indicators
Falling

21 HR EMA
1.5146

55 HR EMA
1.5133

Trend Hourly Chart
Near term up

Hourly Indicators
Rising

13 HR RSI
65

14 HR DMI
+ve

Daily Analysis
Initial gain b4 retreat

Resistance
1.5258 - 38.2% r of 1.5621-1.5034
1.5224 - 100% proj. of 1.5034-1.5161 fm 1.5097
1.5207 - Hourly chart

Support
1.5139 - Hourly chart
1.5197 - Last Fri's post-NFP low
1.5078 - Last Fri's low (AUS)

. GBP/USD - 1.5185.. The British pound fell in tandem with eur/usd last week n continued its recent losing streak. Price weakened to a fresh 17-month trough of 1.5034 n then rebounded on short-covering on Thur after BoE stood pat on its monetary policy. Cable later rallied to 1.5177 Fri n then 1.5195 on Mon.

. Let's look at the bigger picture 1st, cable's resumption of MT downtrend fm 2014 peak at 1.7192 to correct the LT rise fm 1.3500 (2009 low in Jan) is enroute to 1.5000 (psychological sup) n then 1.4910, this is the 61.8% r of the aforesaid rise, however, reckon key sup at 1.4814 (2013 bottom in Jul) shud remain intact. On the upside, only a move back abv 1.5320 (Mon's Asian high) wud suggest a temporary low is in place n bring correction twd 1.5486 (Dec 23 low). On the upside, current cable's rebound fm 1.5034 suggests a temporary low has been made n choppy trading is in store this week with initial upside bias is seen for correction to 1.5258 but 1.5328 shud hold, being, 38.2% n 50% r resp. of the intermediate fall fm 1.5621-1.5034 n yield resumption of downtrend later.

. Today, price may extend near term upmove fm 1.5034 to 1.5220/25 after consolidation, as hourly indicators wud be in o/bot territory, 1.5258 wud hold.
GBP%20jan%2012.png
 
Last edited by a moderator:
AceTraderFx Jan 28: Daily Technical Outlook & Trading Ideals GBP/USD

DAILY GBP/USD TECHNICAL OUTLOOK
Last Update At 28 Jan 2015 00:29GMT

Trend Daily Chart
Down

Daily Indicators
Bullish convergences

21 HR EMA
1.5157

55 HR EMA
1.5110

Trend Hourly Chart
Near term up

Hourly Indicators
Rising

13 HR RSI
59

14 HR DMI
+ve

Daily Analysis
Consolidation with upside bias

Resistance
1.5320 - Jan 05 high
1.5270 - Jan 14 high
1.5235 - Jan 16 high

Support
1.5117 - Y'day's European morning high (now sup)
1.5060 - Y'day's low
1.5045 - Mon's European morning high (now sup)

. GBP/USD - 1.5174... Although cable moved sideways after marginal gain abv Mon's NY high of 1.5103 to 1.5107 in Asia on Tue n then climbed to 1.5117 in European morning, price dipped to 1.5060 after release of downbeat U.K. GDP b4 b4 rallying in tandem with euro to as high as 1.5223 in NY morning b4 easing.

. Looking at the bigger picture, despite last Fri's fall to a fresh 17-mth trough of 1.4952, y'day's rally to 1.5223 confirms MT decline fm 2014 peak at 1.7192 (Jul) to correct the LT rise fm 1.3500 (2009 low in Jan) has finally made a temporary low there as aforesaid low was accompanied by 'bullish convergences' on hourly & daily oscillators, suggesting choppy consolidation with upside bias remains for further subsequent gain. A 'natural' 50% r of intermediate fall fm 1.5621 wud send cable higher twd 1.5286, this is just abv the daily chart res or upside chart obj. at 1.5270. Therefore, buying cable on dips in anticipation of such move is favoured but abv 1.5270 is needed to extend to 1.5320/30.

. Today, in view of abv analysis, buying cable on dips for further corrective up move twd 1.5270 is recommended. On the downside, nly below 1.5060 (Tue's sup in Europe) wud abort near term bullish scenario n risk weakness twd 1.5088.
GBP%20jan%2028%281%29.png
 
Last edited by a moderator:
AceTraderFx Feb 24: Daily Technical Outlook & Trading Ideals GBP/USD

DAILY GBP/USD TECHNICAL OUTLOOK
Last Update At 24 Feb 2015 00:28GMT

Trend Daily Chart
Down

Daily Indicators
Rising

21 HR EMA
1.5428

55 HR EMA
1.5412

Trend Hourly Chart
Up

Hourly Indicators
Rising

13 HR RSI
63

14 HR DMI
+ve

Daily Analysis
Resumption of upmove fm 1.4952

Resistance
1.5569 - 50% r of 1.6186-1.4952
1.5480 - Last Wed's high
1.5475 - Y'day's high

Support
1.5333 - Y'day's low
1.5317 - Last Tue's low
1.5278 - 38.2% r of 1.4952-1.5480

. GBP/USD - 1.5450 ... Despite cable's brief breach of last Fri's 1.5343 low to 1.5333 in Europe on Mon, the British pound rallied on renewed cross buying in sterling (eur/gbp fell to a fresh 7-year trough at 0.7326) n cable strengthened to as high as 1.5475 (just below last Wed's 1.5480 high).

. Looking at the hourly n daily charts, cable's firmness after y'day's rally fm 1.5333 to 1.5475 suggests the pullback fm last Wed's high at 1.5480 has ended at 1.5333 n recent erratic upmove fm Jan's fresh 17-month trough at 1.4952 shud resume after minor consolidation n abv said res wud confirm aforesaid upmove fm 1.4952 to retrace MT fall fm 1.7192 (2014 peak) has once again resumed n yield further gain to 1.5569 (50% r of 1.6186-1.4952) later. On the downside, only a breach of 1.5333 wud bring a stronger retracement to 1.5278 (38.2% r of 1.4952-1.5480), however, reckon 1.5216 (50% r) shud contain downside n yield a much-needed rebound later.

. In view of near term bullish scenario, buying cable on dips in anticipation of further gain to 1.5500 1st, however, high readings on hourly oscillators shud cap price at 1.5569 today. Below 1.5333 risks 1.5278.
gbp%28242%29.png
 
Last edited by a moderator:
AceTraderFx Mar 30: Weekly Technical Outlook & Trading Ideals GBP/USD

WEEKLY GBP/USD TECHNICAL OUTLOOK
Last Update At 29 Mar 2015 23:35GMT

Trend Daily Chart
Sideways

Daily Indicators
Rising fm o/s

21 HR EMA
1.4880

55 HR EMA
1.4878

Trend Hourly Chart
Sideways

Hourly Indicators
Neutral

13 HR RSI
58

14 HR DMI
+ve

Daily Analysis
Consolidation with a neutral bias

Resistance
1.4995 - Last Thur's high
1.4955 - Last Wed's high
1.4923 - Last Fri's high

Support
1.4831 - Last Wed's low
1.4797 - Last Fri's low
1.4777 - Last Fri's Asian high (now sup)

. GBP/USD - 1.4901... Trading the pound proved me tricky last week as price went through several roller-coaster sessions.Cable ratcheted lower fm 1.4990 to 1.4839 in tandem with euro on Mon n rebounded to 1.4984 the next day n fell back to 1.4831 Wed b4 rising to 1.4995 Thur n then tumbled to 1.4797 Fri.

. On the bigger picture, although cable's rally fm Mar's 40-month trough of 1.4635 to 1.5166 (post-FOMC peak) confirms the LT fall fm 2014 near 6-year peak at 1.7192 has finally made a temporary low there, the sharp retreat to 1.4689 suggests choppy trading inside aforesaid 1.4635-1.5166 broad range wud continue for rest of this week. On the upside, abv 1.5166 wud bring stronger retracement to 1.5357, this is a 'minimum' 38.2% of intermediate fall fm 1.6525 to 1.4635. Failure to re-test 1.5166 res n subsequent breach of 1.4635 wud risk one more fall to 1.4598/1.4582 area (61.8% proj. of 1.5554-1.4635 n 61.8% proj. of 1.6525-1.4952 fm 1.5554 respectively), however, as hourly & the daily indicators wud display 'bullish convergences' on such move, 1.4500 wud hold.

. Today, Fri's rebound fm 1.4797 to 1.4923 after hawkish comments by BoE's Gov Carney suggests consolidation with upside bias is in store.
gbp%28246%29.png
 
Last edited by a moderator:
AceTraderFx Apr 20 : Weekly Technical Outlook & Trading GBP/USD

WEEKLY GBP/USD TECHNICAL OUTLOOK
Last Update At 19 Apr 2015 23:52GMT

Trend Daily Chart
Sideways

Daily Indicators
Turning up

21 HR EMA
1.4960

55 HR EMA
1.4915

Trend Hourly Chart
Near term up

Hourly Indicators
Turning down

13 HR RSI
53

14 HR DMI
+ve

Daily Analysis
Consolidation with upside bias

Resistance
1.5097 - 50% proj. of 1.4701-1.5053 fm 1.4921
1.5053 - Last Fri's high
1.5008 - Mar 19 high

Support
1.4916 - Last Fri's low
1.4880- Last Thur's Asian high (now sup)
1.4812 - Last Thur;s low

. GBP/USD - 1.4967... Although cable resumed MT downtrend to a near 5-year low of 1.4566 at the start of last week as market jitter of a hung parliament after May 7 U.K. election weighed on the sterling. Cable rallied in tandem with eur/usd n climbed for 5 consecutive days to 1.5053 in Europe Fri b4 retreating.

. On the daily chart, cable's aforesaid surprise rally fm 1.4566 to as high as 1.5053 confirms downtrend fm 2014 near 6-year peak at 1.7192 has indeed formed a temporary low there as this lvl was accompanied by 'bullish convergences' on both hourly & daily indicators n consolidation with upside bias is in store this week. A daily close abv 1.5166 wud retain bullish prospect for further headway to 1.5314 n possibly twd 1.5545, being a 'minimum' 38.2% r n 50% r respectively of intermediate decline fm 1.6525-1.4566. In view of abv analysis, buying cable on dips is recommended in anticipation of subsequent resumption of near upmove to 1.5166. On the downside, below 1.4802 wud signal 1st leg of correction is over n may risk stronger retracement twd 1.4701 b4 rebound.

. Today, Fri's retreat fm 1.5053 suggests consolidation is in store, reckon 1.4880/84 wud contain weakness n abv 1.5083 wud yield upmove to 1.5090/00.
GBP%20apr%2020.png
 
Last edited by a moderator:
AceTraderFx May 11: Weekly Technical Outlook & Trading GBP/USD

WEEKLY GBP/USD TECHNICAL OUTLOOK
Last Update At 11 May 2015 00:07GMT

Trend Daily Chart
Sideways

Daily Indicators
Rising

21 HR EMA
1.5433

55 HR EMA
1.5366

Trend Hourly Chart
Up

Hourly Indicators
Turning down

13 HR RSI
56

14 HR DMI
+ve

Daily Analysis
Consolidation with a neutral bias

Resistance
1.5554 - Feb 2015 peak (26th)
1.5523 - Last Fri's 10-week high
1.5498 - Apr's high (29th)

Support
1.5355 - Last Fri's low
1.5292 - Wed's high (now sup)
1.5240 - Last Fri's low (AUS)

. GBP/USD - 1.5445... The British pound made spectacular gain vs its peers last week. Price met renewed buying at 1.5088 on Tue n ratcheted higher to 1.5292 Wed. News of a strong Conservative lead fm exit poll at Thur's NY close triggered a 'relief rally' fm 1.5240 to as high as 1.5523 on Fri b4 retreating.

. Looking at the daily chart, cable's rally abv Apr's 1.5498 high last Fri to a 2-month peak of 1.5523 confirms MT rise fm Apr's near 5-year trough at 1.4566 has once again resumed n price is en route to 2015 peak at 1.5554 (Feb). As the daily technical indicators are rising, a daily close abv said 1.5544 res wud encourage for further headway twd 1.5664, being a 61.8% proj. of the entire rise fm 1.4566-1.5498 measured fm 1.5088. Therefore, buying cable on dips is favoured n only a daily close below 1.5292 (previous res, now sup) wud be the 1st signal temporary top is in place n risk would shift to the downside for weakness twd 1.5165 but reckon sup at 1.5088 should remain intact.

. Today, although cable has risen again in Fri's post-NFP session in NY after intra-day strg retreat fm 1.5523 to 1.5355, abv said res needed to ring re-test of 1.5523, bearish divergences shud cap price below res at 1.5621.
GBP%20may%2011.png
 
Last edited by a moderator:
Back
Top