acetraderfx
AceTrader.com Representative
- Messages
- 1,109
WEEKLY TECHNICAL OUTLOOK ON GBP/USD
Last Update At 17 Mar 2014 00:07GMT
Trend Daily Chart
Up
Daily Indicators
Turning down
21 HR EMA
1.6631
55 HR EMA
1.6632
Trend Hourly Chart
Sideways
Hourly Indicators
Rising
13 HR RSI
53
14 HR DMI
+ve
Daily Analysis
Choppy trading to continue
Resistance
1.6745 - Last Mon's high (NZ)
1.6719 - Last Thur's high
1.6686 - Hourly res
Support
1.6605 - Hourly sup
1.6587 - Last Fri's low
1.6568 - Last Wed' 3-week low
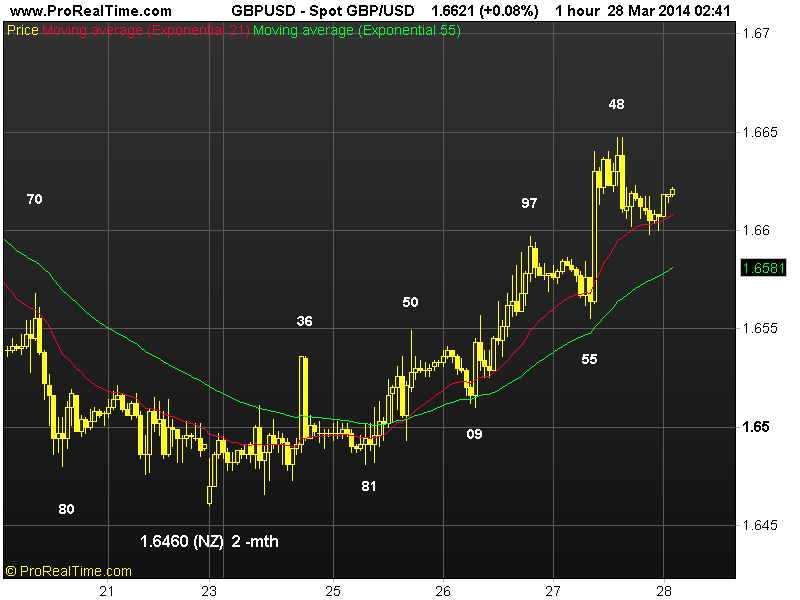
. GBP/USD - 1.6635... Although weakness in sterling last week pressured
the pound below previous daily sup at 1.6583 to a 30-week trough of 1.6568,
broad-based short-covering lifted cable to as high s 1.6719 Thur but only to
fall sharply back to as low as 1.6587 Fri b4 staging another bounce.
. Cable's aforesaid strg bounce fm 1.6568 to 1.6719 suggests correction fm
Feb's 4-year peak at 1.6823 has possibly ended there n initial consolidation is
in store this week, abv 1.6719 wud add credence to this view, then price shud
head twd pivotal res at 1.6787, break wud encourage for a re-test of 1.6823 n
later twd 1.6921, this is 61.8% proj. of MT intermediate rise fm 1.6252-1.6823
measured fn 1.6568. On the downside, below 1.6568 wud confirm MT rise fm 2013 3-
year trough at 1.4814 has formed a temporary there, then risk wud shift to the
downside for weakness twd 1.6470, this is 61.8% r of the intermediate rise fm
1.6252-1.6823.
. Today, in view of abv analysis n intra-day neutral outlook on cable, we
are standing aside initially n may trade fm both sides of the market for short
trade. However, as long as Fri's low at 1.6587 holds, price may ratchet higher
Last Update At 17 Mar 2014 00:07GMT
Trend Daily Chart
Up
Daily Indicators
Turning down
21 HR EMA
1.6631
55 HR EMA
1.6632
Trend Hourly Chart
Sideways
Hourly Indicators
Rising
13 HR RSI
53
14 HR DMI
+ve
Daily Analysis
Choppy trading to continue
Resistance
1.6745 - Last Mon's high (NZ)
1.6719 - Last Thur's high
1.6686 - Hourly res
Support
1.6605 - Hourly sup
1.6587 - Last Fri's low
1.6568 - Last Wed' 3-week low
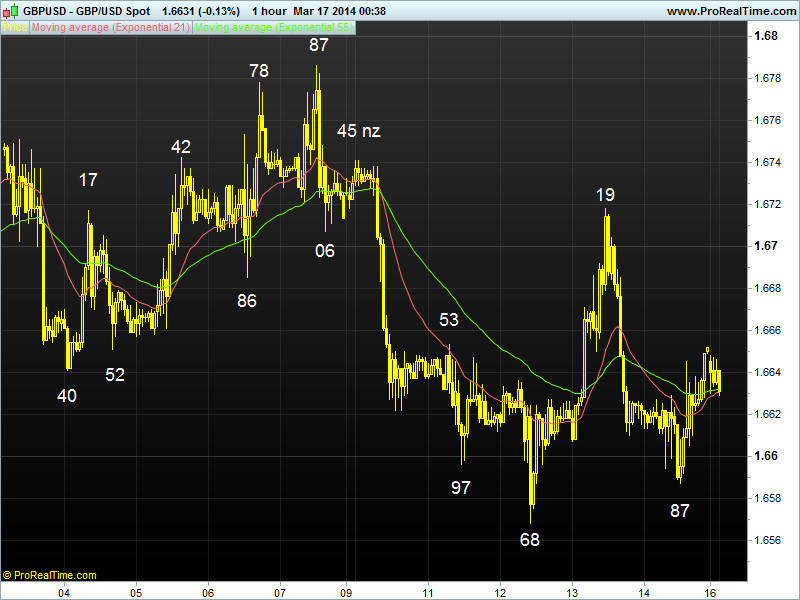
. GBP/USD - 1.6635... Although weakness in sterling last week pressured
the pound below previous daily sup at 1.6583 to a 30-week trough of 1.6568,
broad-based short-covering lifted cable to as high s 1.6719 Thur but only to
fall sharply back to as low as 1.6587 Fri b4 staging another bounce.
. Cable's aforesaid strg bounce fm 1.6568 to 1.6719 suggests correction fm
Feb's 4-year peak at 1.6823 has possibly ended there n initial consolidation is
in store this week, abv 1.6719 wud add credence to this view, then price shud
head twd pivotal res at 1.6787, break wud encourage for a re-test of 1.6823 n
later twd 1.6921, this is 61.8% proj. of MT intermediate rise fm 1.6252-1.6823
measured fn 1.6568. On the downside, below 1.6568 wud confirm MT rise fm 2013 3-
year trough at 1.4814 has formed a temporary there, then risk wud shift to the
downside for weakness twd 1.6470, this is 61.8% r of the intermediate rise fm
1.6252-1.6823.
. Today, in view of abv analysis n intra-day neutral outlook on cable, we
are standing aside initially n may trade fm both sides of the market for short
trade. However, as long as Fri's low at 1.6587 holds, price may ratchet higher
Last edited by a moderator: