Daily Technical Analysis by Kate Curtis from Trader's Way

GBP/USD Testing Former Support (March 26, 2013)

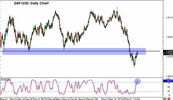
GBP/USD’s recent rallies might be cut short this week as the pair is currently testing the former support zone around 1.5200 to 1.5250. This level has been broken in February when the BOE reiterated their willingness to implement further easing at the expense of stronger inflationary pressures.
gbpusd.20130326.jpg

However, the U.K. economy has enjoyed some good news at the start of March as it saw some improvements in economic data and received a less dovish outlook from the BOE. In addition to the short squeeze, these factors were enough to push the pair right back up from its previous lows around 1.4850 back to the 1.5200 area.

There are no major reports due from the U.K. this week, which might mean that there’s no catalyst for an upside breakout. The support-turned-resistance level could hold for now as traders book profits ahead of the shortened trading week. Take note also that it’s the end of the month and the quarter, which could lead to a profit-taking scenario.

Shorting around 1.5200 with a stop above 1.5250 and a target at 1.5000 would yield a pretty good reward-to-risk ratio for a trade until the middle of the week.

By Kate Curtis from Trader's Way
 
USD/CAD: Trading the Monthly GDP Report (March 28, 2013)

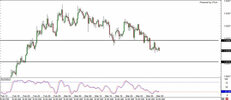
USD/CAD is currently consolidating above the 1.0150 minor psychological support level as traders await the release of the monthly GDP reading for January. The figure is expected to rebound by 0.1% from the -0.2% reading seen last December.

usdcad.20130328.jpg

A stronger than expected reading could trigger a downside breakout to the next support level around 1.0115 or possibly until the 1.0100 major psychological level, depending on how positive the actual reading is.

On the other hand, a weaker than expected figure could trigger an upside breakout by USD/CAD. This could push the pair back to the 1.0200 major psychological level, which has acted as support in the past.

By Kate Curtis from Trader's Way
 
GBP/USD: Will 1.5200 Hold Again? (March 29, 2013)

The pair is once more testing the 1.5200 major psychological resistance for today. The level has held earlier this week as price dipped back to the 1.5100 major psychological support afterwards.

There’s a bearish divergence that formed on the hourly time frame as the price made lower highs while the oscillator drew higher highs. Stochastic is already moving down from the overbought region, suggesting that pound bears have already found momentum to push the pair down.

290313.jpg


The pair could once more find support at the 1.5100 area, which has been holding for the past couple of weeks. Stronger profit-taking moves could push the pair even lower to the 1.5000 mark.

By Kate Curtis from Trader's Way
 
USD/JPY: Resistance Turned Support at 94.00 (April 1, 2013)

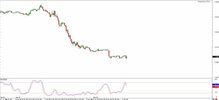
USD/JPY sold off for the past couple of weeks and is now testing the former resistance at the 94.00 major psychological level. The pair seems to be finding support around this area, which is also in line with the 50% Fibonacci retracement level on the 4-hour time frame.

usdjpy.jpg

Take note that the BOJ is set to make its interest rate decision later this week but traders could start pricing their expectations way ahead of the actual event. In his previous speech, Kuroda noted that the central bank is ready to implement the necessary quantitative and qualitative measures, the details of which haven’t been disclosed yet. Kuroda might’ve simply been waiting for BOJ policymakers to convene first before announcing concrete steps, but additional asset purchases are eyed.

The yen could sell off as the event draws nearer and nearer. In the meantime, the U.S. is set to print its ISM manufacturing PMI during today’s U.S. session. An improvement over the previous month’s figure could boost the U.S. dollar against the yen.

Stochastic is making its way out of the oversold region, which suggests that dollar bulls currently have the upper hand. If you plan to buy this pair, make sure you set your stop below the 61.8% Fib level.


By Kate Curtis from Trader's Way
 
EUR/USD: Retest of Former Support (April 2, 2013)

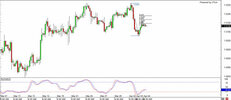
Thanks to its recent rallies for the first few trading sessions this week, EUR/USD was able to pull up to the former support level around the 1.2850 minor psychological handle. This is closely in line with the 38.2% Fibonacci retracement level on the 1-hour time frame.

In addition, stochastic appears ready to drop down form the overbought region, suggesting that euro bears are about to have the upper hand soon. If that’s the case, EUR/USD could head back south until its previous lows around 1.2775.

eurusd.20130402.jpg

There are a few minor market catalysts on tap from the euro zone for today. The German preliminary CPI, Spanish employment data, and Italian manufacturing PMI are all on tap and these could provide some volatility for euro pairs. Weaker than expected figure from these top economies in the region could weigh on the euro.

Shorting at the 1.2850 area and aiming for 1.2775 with a 25-pip stop could be a 3:1 trade. Aiming lower could yield a better reward-to-risk ratio but this might require you to hold on to the trade until after the U.S. session. There are no top-tier reports on tap from the U.S. today, which suggests quiet trading during the New York market hours.

By Kate Curtis from Trader's Way
 
GBP/USD: Trading the Construction PMI Release (April 3, 2013)

The recently released manufacturing PMI for the United Kingdom sparked a massive selloff for the pound as the actual figure missed expectations. Take note that the BOE is currently watching business surveys very closely before they make their interest rate decision.

For today, the UK still has the construction PMI on tap and another disappointment could trigger another round of pound selling. The figure is expected to improve from 46.8 to 47.7, still indicating a contraction in the industry.

gbpusd.20130403.jpg

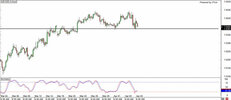
On the shorter-term time frames, GBP/USD shows tight consolidation around the 1.5100 handle as traders await the release of today’s set of data. A short below the Asian box around 1.5075 and aiming for the 1.5000 handle will be a good day trade if the construction PMI misses expectations.

On the other hand, going long above 1.5100 if the actual report comes in strong could also be a good day trade if price rallies back to 1.5150 or 1.5200 afterwards.

By Kate Curtis from Trader's Way
 
Ahead of the BOE Decision: GBP/USD Double Top (April 4, 2013)

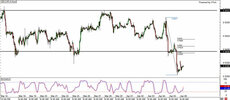
After making a strong selloff from the 1.5250 minor psychological resistance and previous week highs, GBP/USD found support around the 1.5100 major psychological level. The pair appears to be retracing, thanks to the recent disappointments in U.S. economic data.

The pair seems to be encountering short-term resistance at the 38.2% Fibonacci retracement level, which is close to the 1.5150 minor psychological mark. However, stochastic is in moving out of the oversold region, suggesting a potential move up.

gbpusd.20130404.jpg

Take note though that the BOE is scheduled to make its interest rate decision during today’s London session and possibly highlight the weaknesses in the British economy. If that’s the case or if they hint at further asset purchases later on, GBP/USD could stage another strong selloff, possibly below the previous lows.

Note that there’s a double top formation on the 1-hour time frame, which suggests a reversal of the recent uptrend. The neckline is located around 1.5100 and a strong break below this area would confirm the start of a downtrend. This could carry on until the previous lows near 1.4850.

By Kate Curtis from Trader's Way
 
AUD/USD Double Top: NFP Bounce or Break? (April 5, 2013)

On its 4-hour time frame, AUD/USD has formed a double top formation as it failed to break past the 1.0500 major psychological resistance over the past few weeks. The neckline of the pattern is at the 1.0400 major psychological support, which could hold or break depending on the outcome of the NFP report.

Weaker U.S. jobs growth is eyed for March as the ADP non-farm employment change figure and Challenger job cuts data both posted bleak results. Sequestration efforts may have also started to kick in during the month, which might mean more government layoffs for the period. The NFP report is expected to show a 198K reading.

audusd.20130405.jpg

A stronger than expected figure could provide a boost for the U.S. dollar, which could trigger a downside break for AUD/USD. Take note that the pattern is 100 pips in height, which suggests that the breakdown could last until 1.0300.

On the other hand, a weak figure could lead to a dollar selloff, which might push AUD/USD back to the 1.0500 area or to the top of the longer-term range at 1.0600.

A 100-pip stop should provide enough leeway for the trade as volatility could spike during the actual release. If you’re not comfortable setting positions ahead of the event, wait for momentum to dictate price action before entering orders.

By Kate Curtis from Trader's Way
 
On its 4-hour time frame, AUD/USD has formed a double top formation as it failed to break past the 1.0500 major psychological resistance over the past few weeks. The neckline of the pattern is at the 1.0400 major psychological support, which could hold or break depending on the outcome of the NFP report.

Weaker U.S. jobs growth is eyed for March as the ADP non-farm employment change figure and Challenger job cuts data both posted bleak results. Sequestration efforts may have also started to kick in during the month, which might mean more government layoffs for the period. The NFP report is expected to show a 198K reading.

View attachment 8789

A stronger than expected figure could provide a boost for the U.S. dollar, which could trigger a downside break for AUD/USD. Take note that the pattern is 100 pips in height, which suggests that the breakdown could last until 1.0300.

On the other hand, a weak figure could lead to a dollar selloff, which might push AUD/USD back to the 1.0500 area or to the top of the longer-term range at 1.0600.

A 100-pip stop should provide enough leeway for the trade as volatility could spike during the actual release. If you’re not comfortable setting positions ahead of the event, wait for momentum to dictate price action before entering orders.

By Kate Curtis from Trader's Way


Downside break for AUD/USD took place. One of the two probability took place, that means prediction was for 50:50!
 
USD/CHF Break and Retest Scenario (April 8, 2013)

The disappointing March NFP from the U.S. triggered a sharp selloff for USD/CHF, taking the pair below the .9400 significant support level and bottom of the previous range.

It seems that a retest of the support-turned-resistance level could be in play for today or the next few days this week after the pair found support close to the .9300 handle. The .9400 major psychological level is in line with the 38.2% Fibonacci retracement level on the 4-hou time frame.

usdchf.jpg

Stochastic is moving up from the oversold region with a slight bullish divergence in play. This suggests that the pair could recover from its recent losses at least until another round of major reports are released.

Switzerland will be printing its CPI and retail sales data within the week. Inflation is expected to rise by 0.3% in March while consumer spending could post a 2.9% increase, much higher than the previous 1.9% rise. Take note that the FOMC minutes are also set for release this week and this could reaffirm the Fed’s bias against withdrawing stimulus.

Shorting at .9400 with a stop above the 50% or 61.8% Fibonacci levels and a target of new lows would be a good weekly trade.

By Kate Curtis from Trader's Way
 
Back
Top