Daily Technical and Fundamental analysis for multi pairs.

What's better out of EA/robotic and Manual trading?


  • Total voters
    5
Buy stop in NZD/JPY:
If you have read my previous analysis of USD/JPY, you know that stop grabber has been accomplished as USDJPY penetrated low of Sep 24. Now USD/JPY may pull back. Profit taking from sell positions (closing sell of USD/JPY) by many traders and fund managers ahead of NFP, will also help it.
Meanwhile NZD gained as you can see on NZD/USD and it seems to be changing trend today.
Note that I analyze USD/JPY and NZD/USD to determine trade setup on NZD/JPY because the two are more popular than NZD/JPY.
NZD_USD_Oct 3_2019.png


Technical things on NZD/JPY suggests a buy stop order.
It will be either closed at TP (2.0 pips below FIB38.2 on NZD/JPY) or if FIB61.8 on NZD/USD will be hit before FIB38.2 on NZD/JPY, I will close it manually.
NZD_JPY_Oct 3_2019.png
 
If you have read my previous analysis of EURUSD, you know that I was looking for buying opportunity.

Entered buy at 1.0915 (50% retracement of upward movement since release of ISM Manufacturing PMI).

Butterflies, three drives etc. easily fail to work as full reversal pattern but partial reversal or at least 30% retracement is easily caused by such patterns; so I am targeting only 30% of butterfly move from a to d.
View attachment 44720
Moved SL to BE ahead of US ISM Non-Manufacturing PMI.
 
If you have read my previous analysis of EURUSD, you know that I was looking for buying opportunity.

Entered buy at 1.0915 (50% retracement of upward movement since release of ISM Manufacturing PMI).

Butterflies, three drives etc. easily fail to work as full reversal pattern but partial reversal or at least 30% retracement is easily caused by such patterns; so I am targeting only 30% of butterfly move from a to d.
View attachment 44720
The trade has been accomplished as minimum target of butterfly (30% of whole move from a to d, i.e. 1.0990) has beet hit.

I will be monitoring the pair for further development. Recent data of US ADP NFP, US ISM manufacturing PMI and non-manufacturing PMI came weaker than forecast; If NFP will also come weaker, FED will have statistics to talk about further rate cut. This butterfly then may turn into a cause of bigger reversal and a technical tool to determine next target.
 
Buy stop in NZD/JPY:
If you have read my previous analysis of USD/JPY, you know that stop grabber has been accomplished as USDJPY penetrated low of Sep 24. Now USD/JPY may pull back. Profit taking from sell positions (closing sell of USD/JPY) by many traders and fund managers ahead of NFP, will also help it.
Meanwhile NZD gained as you can see on NZD/USD and it seems to be changing trend today.
Note that I analyze USD/JPY and NZD/USD to determine trade setup on NZD/JPY because the two are more popular than NZD/JPY.
View attachment 44743

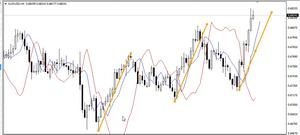
Technical things on NZD/JPY suggests a buy stop order.
It will be either closed at TP (2.0 pips below FIB38.2 on NZD/JPY) or if FIB61.8 on NZD/USD will be hit before FIB38.2 on NZD/JPY, I will close it manually.
View attachment 44744
Trade was accomplished at TP last week.
 
Buy EUR
EUR/USD:
If you remember the butterfly of EUR/USD, you know that minimum target (30% of butterfly) had been completed many days ago.

Then I had mentioned on Oct 3 that the butterfly will become a technical tool to determine next target. It happened and 50% of butterfly (1.10626) precisely was hit last Friday.

Next target is 61.8% of the butterfly that is 1.1106 ( ± 5.0 pips).

EUR/USD has just made gartley pattern on H1 time-frame. The trusty candle made by dint of positive news about deal between EU and UK, has already validated gartley. Upward move started and I bought at 35% retracement of the thrust.

Other technical factors: RSI crossed above 50. EMAs crossover is also gonna take place in a couple of hours.

Risk: If the thrust is erased, setup will fail.
EURUSD_H1_Oct 15.png


EUR/JPY: JPY pairs have recently been gaining as global tensions like US-China trade war and Brexit etc. are easing.

JPY is a safe heaven currency that gains during global tensions, USD/JPY has gained significantly and made same candle too while EUR/USD has made thrusty candle.

It means that buying EUR/JPY will give us more pips. Note that I analyze EUR/USD as well as USD/JPY to analyze EUR/JPY because the two are more popular pairs than EUR/JPY.


RSI crossover and EMAs crossover have taken place.
EUR_JPY_H1_Oct 15_2019.png


Now the question is how to set target in EUR/JPY.

There are two ways, either set TP at ABCD100 shown at D1 or close manually if EUR/USD already hits target.

Risk: setup fails if the thrust gets erased.
EURJPY_D1_Oct 15_2019.png
 
Buy NZD/JPY | Oct 15, 2019
Having seen previous sharp fall in NZD, deep retracement like FIB61.8 on NZD/USD was anticipated. Then NZD bounced when almost all major currency bounced against USD and JPY.

Recently JPY has been losing because global tensions like US-China trade war and Brexit are easing.

Therefore, we decided to buy NZD against JPY.

Note that I analyze NZD/USD and USD/JPY to determine trade setup on NZD/JPY because the two are more popular than it.
NZDUSD_H1_Oct 15_2019.png


Condition for long position has been met on H1 of NZD/JPY.
NZDJPY_H1_Oct 15_2019.png

I have got R:R::1:1 by targeting just previous high with SL below thrust of NZD/JPY.

I am not targeting much because NZD has been weak in long term.
 
Buy NZD/JPY | Oct 15, 2019
Having seen previous sharp fall in NZD, deep retracement like FIB61.8 on NZD/USD was anticipated. Then NZD bounced when almost all major currency bounced against USD and JPY.

Recently JPY has been losing because global tensions like US-China trade war and Brexit are easing.

Therefore, we decided to buy NZD against JPY.

Note that I analyze NZD/USD and USD/JPY to determine trade setup on NZD/JPY because the two are more popular than it.
View attachment 44943

Condition for long position has been met on H1 of NZD/JPY.
View attachment 44944
I have got R:R::1:1 by targeting just previous high with SL below thrust of NZD/JPY.

I am not targeting much because NZD has been weak in long term.
The trade has been accomplished at TP.
 
Both
Buy EUR
EUR/USD:
If you remember the butterfly of EUR/USD, you know that minimum target (30% of butterfly) had been completed many days ago.

Then I had mentioned on Oct 3 that the butterfly will become a technical tool to determine next target. It happened and 50% of butterfly (1.10626) precisely was hit last Friday.

Next target is 61.8% of the butterfly that is 1.1106 ( ± 5.0 pips).

EUR/USD has just made gartley pattern on H1 time-frame. The trusty candle made by dint of positive news about deal between EU and UK, has already validated gartley. Upward move started and I bought at 35% retracement of the thrust.

Other technical factors: RSI crossed above 50. EMAs crossover is also gonna take place in a couple of hours.

Risk: If the thrust is erased, setup will fail.
View attachment 44938


EUR/JPY: JPY pairs have recently been gaining as global tensions like US-China trade war and Brexit etc. are easing.

JPY is a safe heaven currency that gains during global tensions, USD/JPY has gained significantly and made same candle too while EUR/USD has made thrusty candle.

It means that buying EUR/JPY will give us more pips. Note that I analyze EUR/USD as well as USD/JPY to analyze EUR/JPY because the two are more popular pairs than EUR/JPY.


RSI crossover and EMAs crossover have taken place.
View attachment 44939

Now the question is how to set target in EUR/JPY.

There are two ways, either set TP at ABCD100 shown at D1 or close manually if EUR/USD already hits target.

Risk: setup fails if the thrust gets erased.
View attachment 44940
Both of EUR/USD and EUR/JPY has been accomplished at traget/TP.
 
AUD/USD short trade | Oct 17, 2019
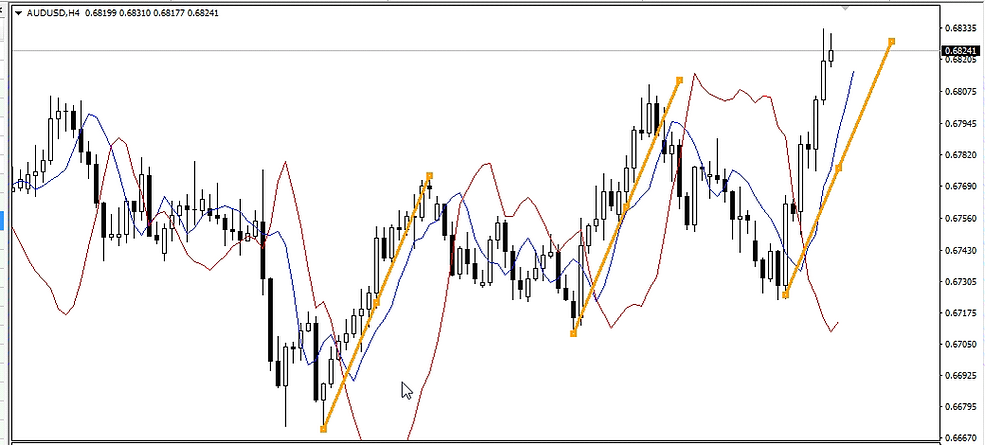
After 3 drive, at least 30% downward retracement is more likely to take place. Upcoming event of RBA's Lowe may cause many traders and fund managers to close buy positions to book profit, which may help downward retracement.


file.png
4683d6_da483165efd4436da78ef41c5a00c5ef~mv2.webp


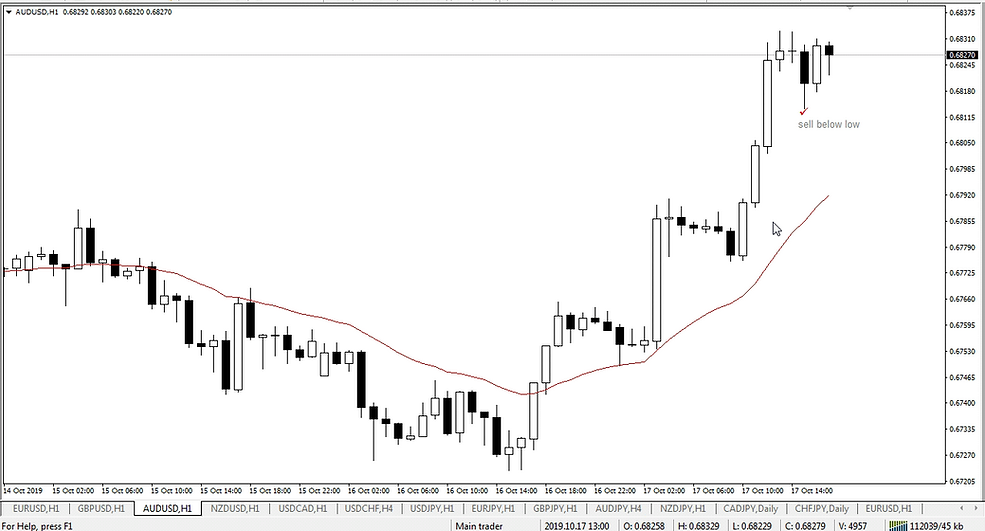
Sell stop right blow low of H1 candle marked with✅.

Target 30% of whole 3 drive, that is 0.6785 (± 3.0 pips).

Setup fails if any H1 candle closes above latest high.


file.png
4683d6_d74b14b785c449b087128e7fc55eb41d~mv2.webp
 

Attachments

  • Screenshot_2019-10-17-19-37-31-1.png
    Screenshot_2019-10-17-19-37-31-1.png
    75.3 KB · Views: 0
AUD/USD short trade | Oct 17, 2019
After 3 drive, at least 30% downward retracement is more likely to take place. Upcoming event of RBA's Lowe may cause many traders and fund managers to close buy positions to book profit, which may help downward retracement.


file.png
4683d6_da483165efd4436da78ef41c5a00c5ef~mv2.webp


Sell stop right blow low of H1 candle marked with✅.

Target 30% of whole 3 drive, that is 0.6785 (± 3.0 pips).

Setup fails if any H1 candle closes above latest high.


file.png
4683d6_d74b14b785c449b087128e7fc55eb41d~mv2.webp
 
Back
Top