alayoua
Banned
- Messages
- 0
Update - Daily Technical Levels from FXCC 13 Sep 2011
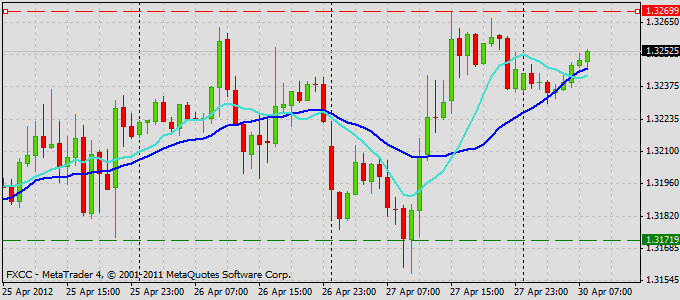
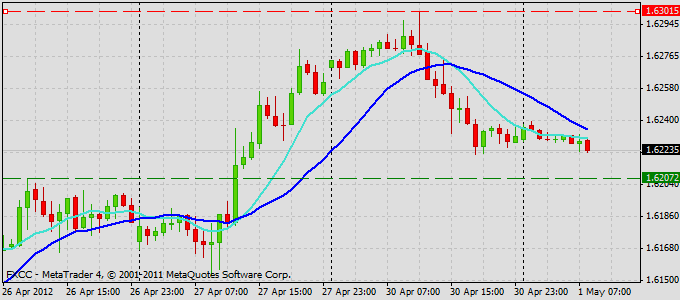
EUR/USD
Intraday Technical Levels:
Pivot: 1.3555
Preference: Long positions above 1.3555 with targets @ 1.3785 & 1.388 in extension.
Alternative Scenario: Below 1.3555 look for further downside with 1.3495 & 1.341 as targets.
Comment: the RSI is mixed with a bullish bias.
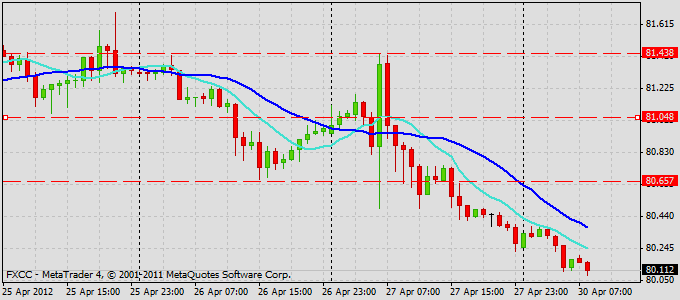
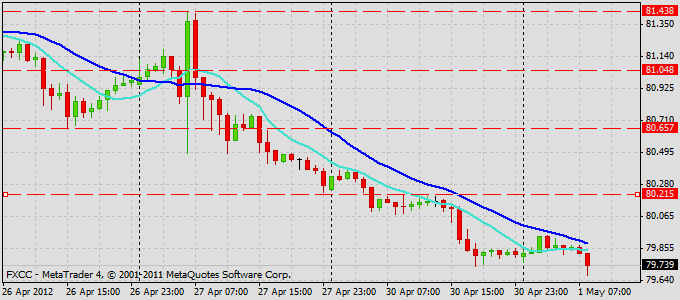
USD/JPY
Intraday Technical Levels:
Pivot: 77.4
Preference: Short positions below 77.4 with targets @ 76.75 & 76.55 in extension.
Alternative Scenario: Above 77.4 look for further upside with 77.65 & 77.85 as targets.
Comment: the break below 77.4 is a negative signal that has opened a path to 76.75.
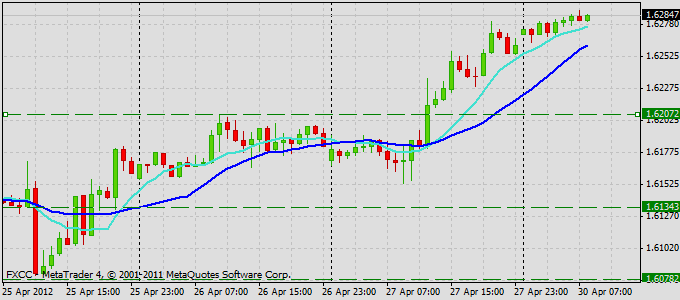
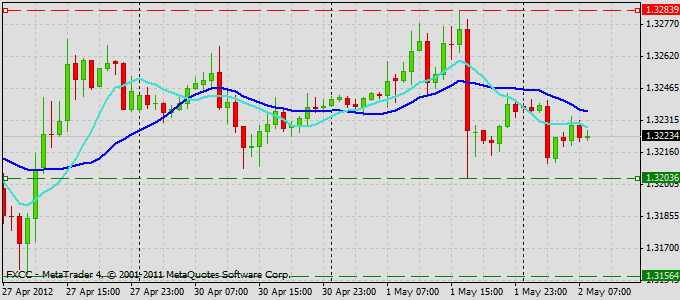
GBP/USD
Intraday Technical Levels:
Pivot: 1.575
Preference: Long positions above 1.575 with targets @ 1.587 & 1.589 in extension.
Alternative Scenario: Below 1.575 look for further downside with 1.5695 & 1.5660 as targets.
Comment: the RSI calls for a rebound.
Daily Technical Levels from fxcc.com
Source: FX Central Clearing ECN Forex Trading | ECN Forex Broker | Forex Trading Accounts | FXCC
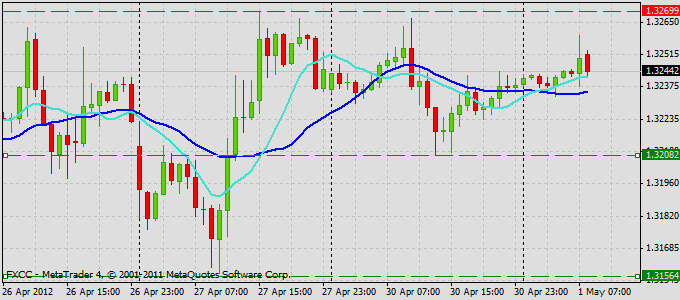
EUR/USD
Intraday Technical Levels:
Pivot: 1.3555
Preference: Long positions above 1.3555 with targets @ 1.3785 & 1.388 in extension.
Alternative Scenario: Below 1.3555 look for further downside with 1.3495 & 1.341 as targets.
Comment: the RSI is mixed with a bullish bias.
USD/JPY
Intraday Technical Levels:
Pivot: 77.4
Preference: Short positions below 77.4 with targets @ 76.75 & 76.55 in extension.
Alternative Scenario: Above 77.4 look for further upside with 77.65 & 77.85 as targets.
Comment: the break below 77.4 is a negative signal that has opened a path to 76.75.
GBP/USD
Intraday Technical Levels:
Pivot: 1.575
Preference: Long positions above 1.575 with targets @ 1.587 & 1.589 in extension.
Alternative Scenario: Below 1.575 look for further downside with 1.5695 & 1.5660 as targets.
Comment: the RSI calls for a rebound.
Daily Technical Levels from fxcc.com
Source: FX Central Clearing ECN Forex Trading | ECN Forex Broker | Forex Trading Accounts | FXCC