Admiral Markets
AdmiralMarkets.com Representative
- Messages
- 95
GBP/USD bearish price action breaks support but approaches Fib confluence
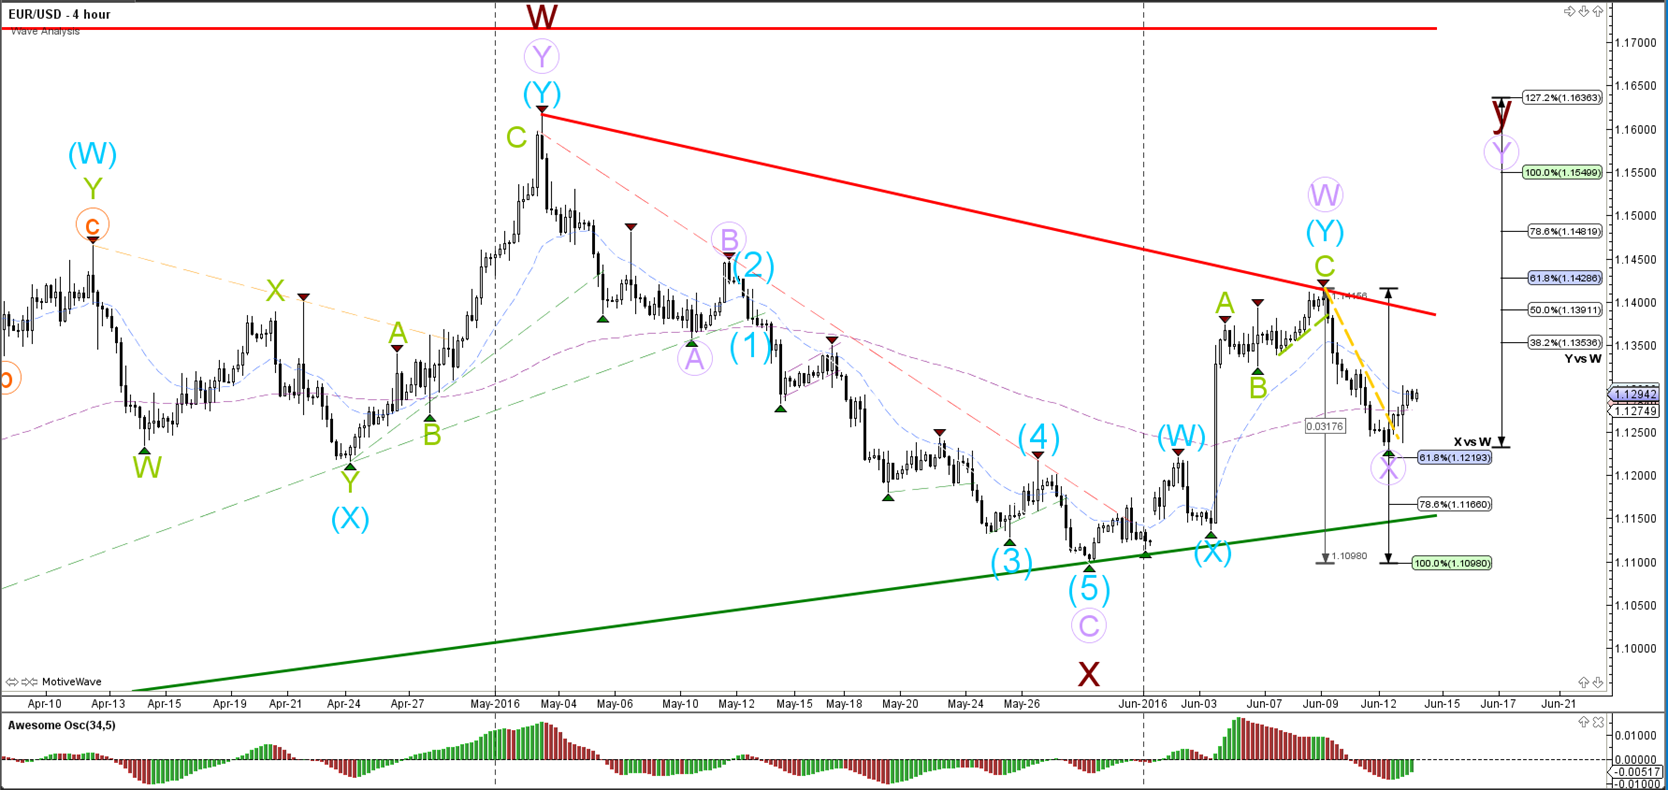
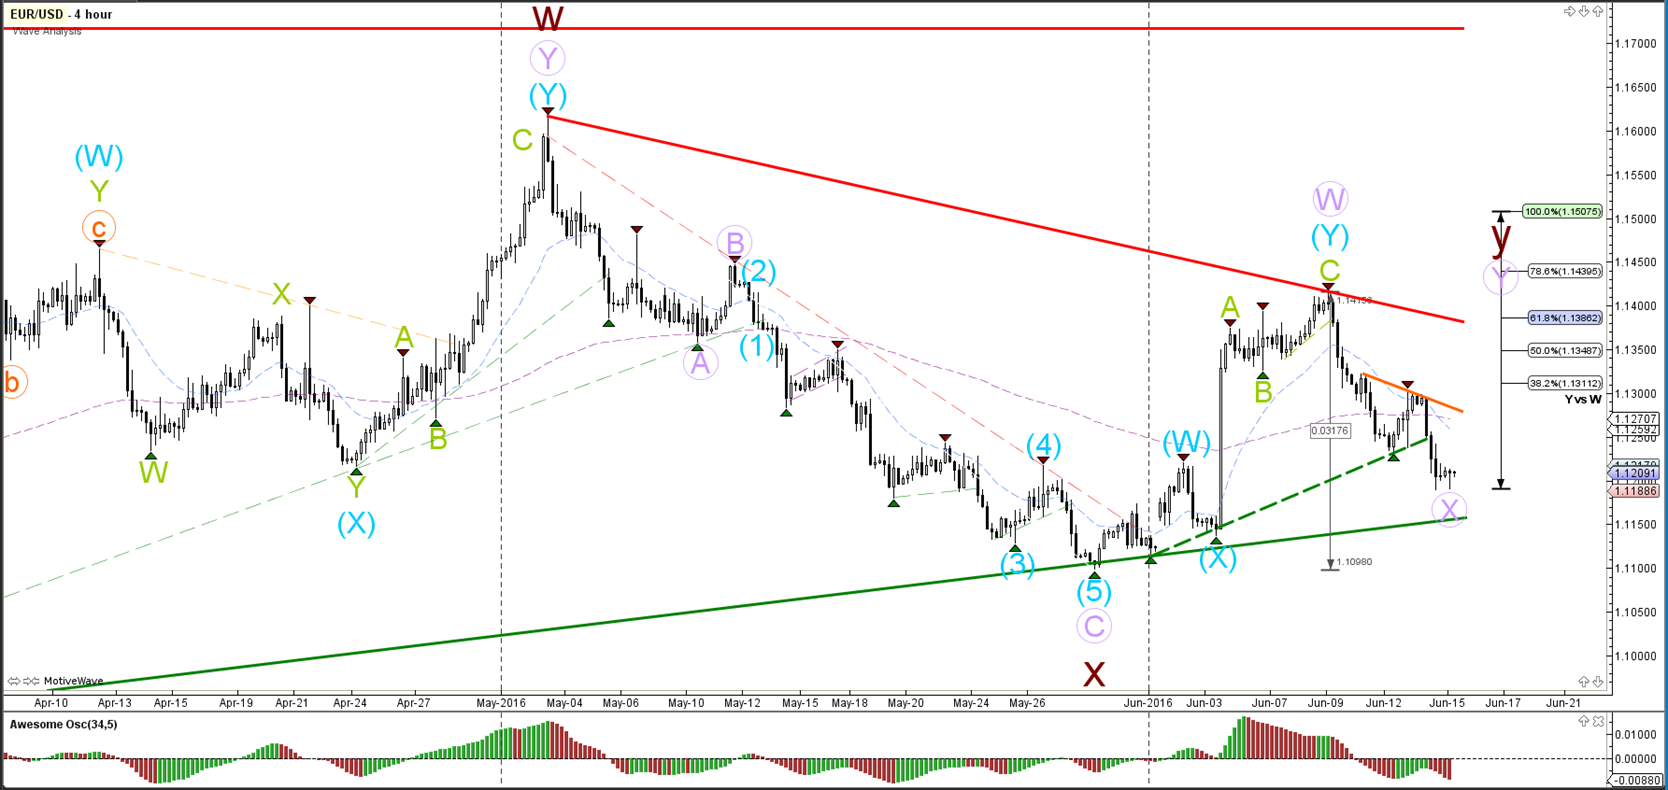
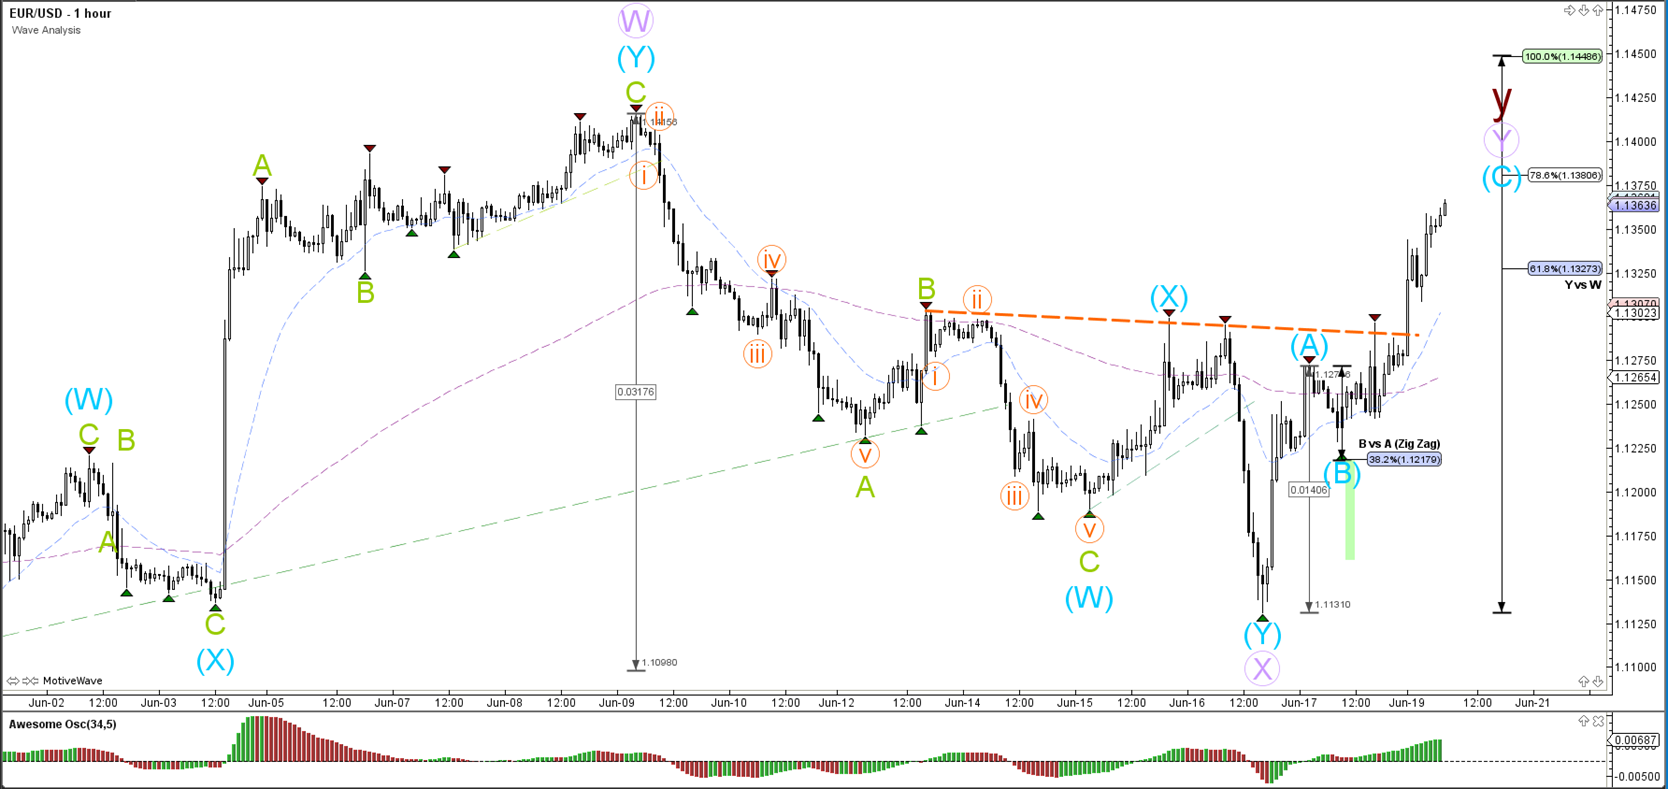
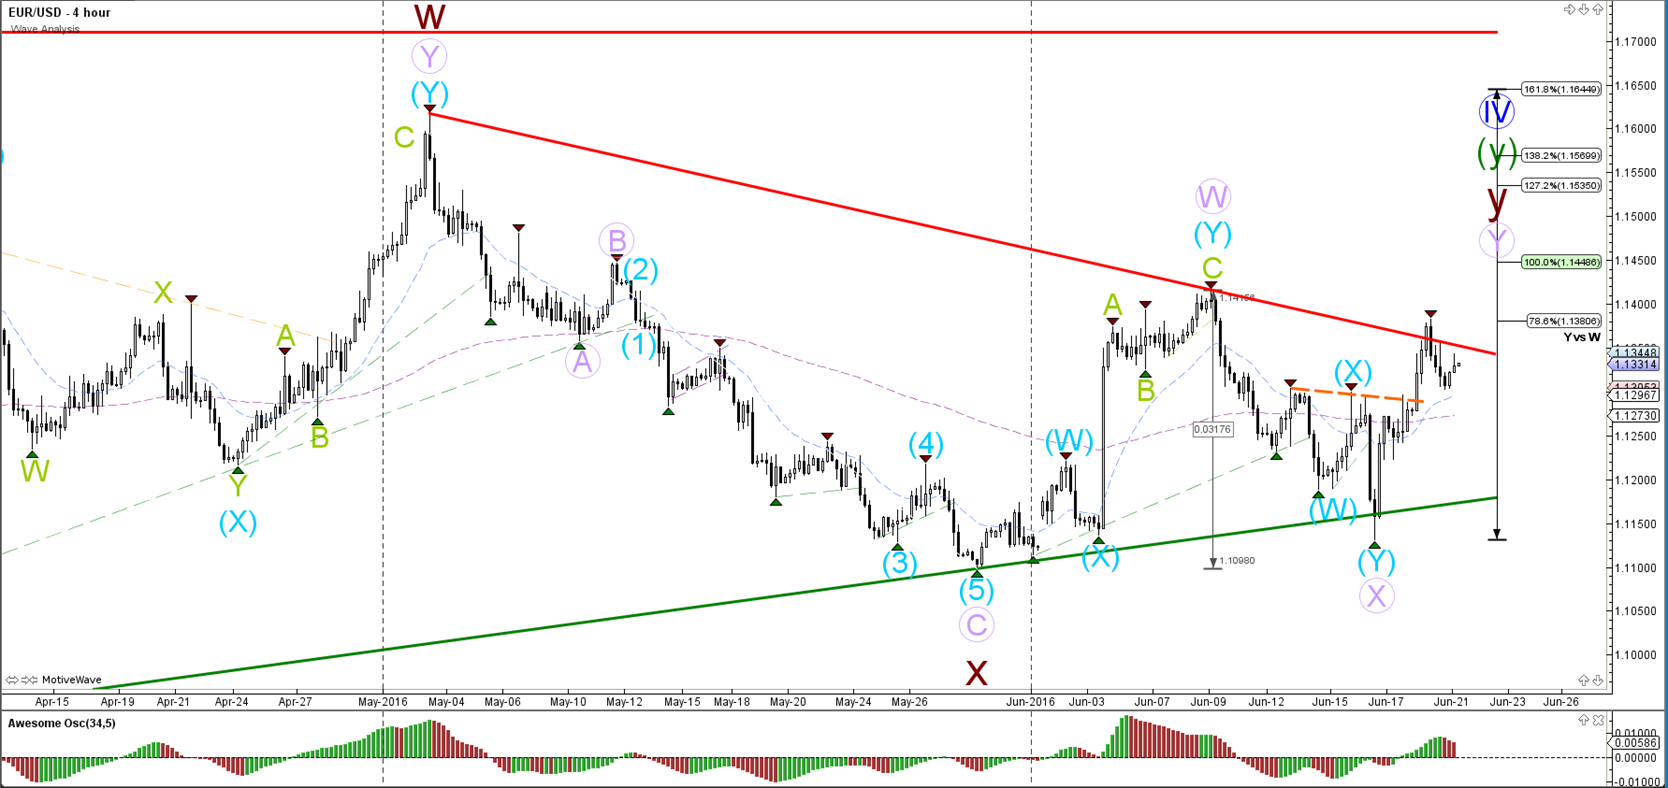
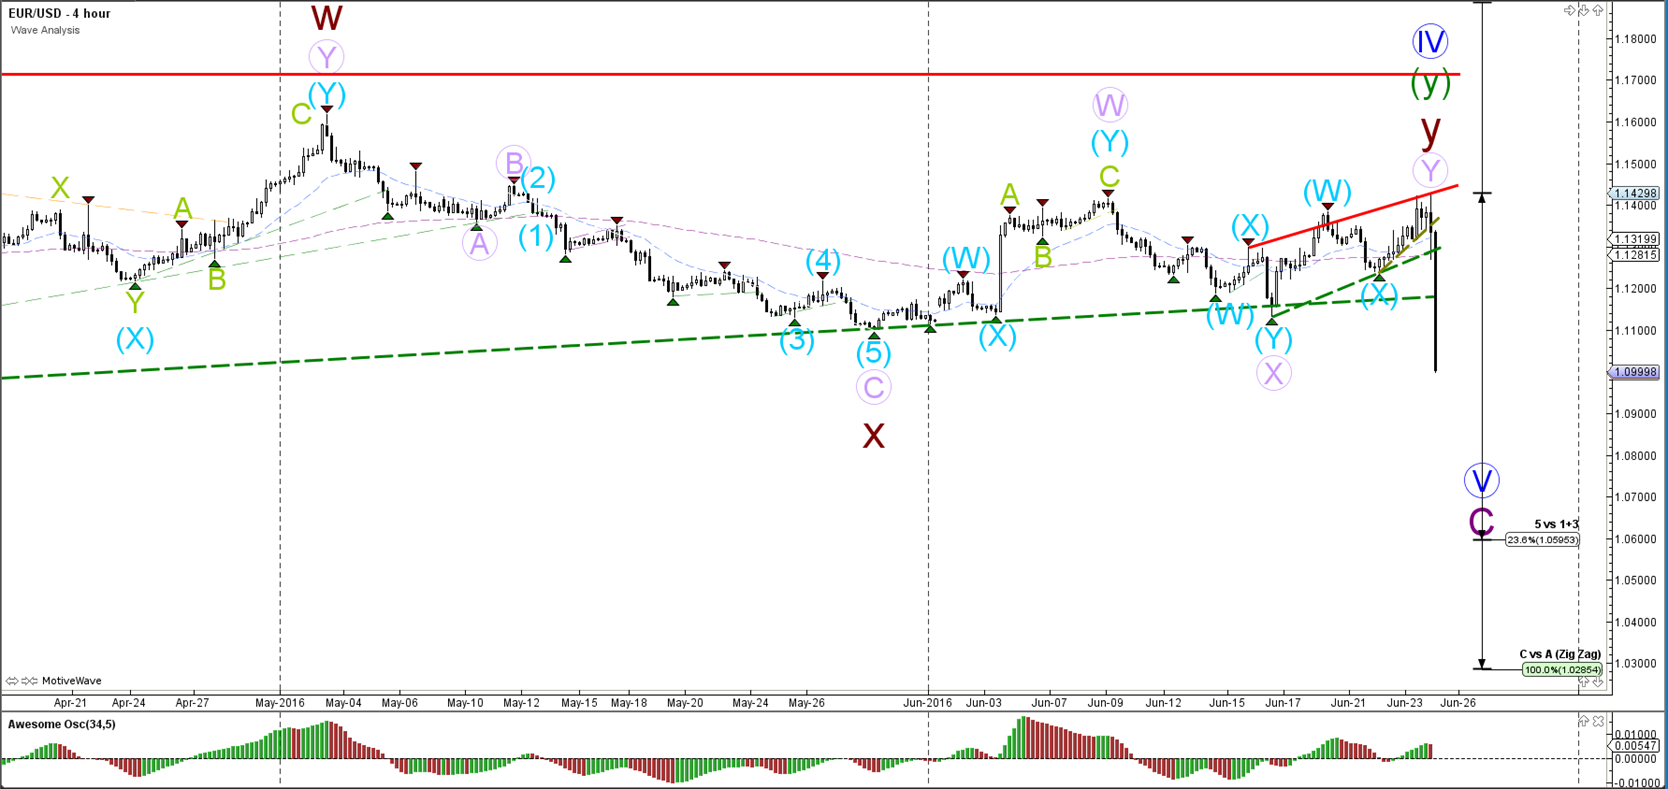
EUR/USD
4 hour

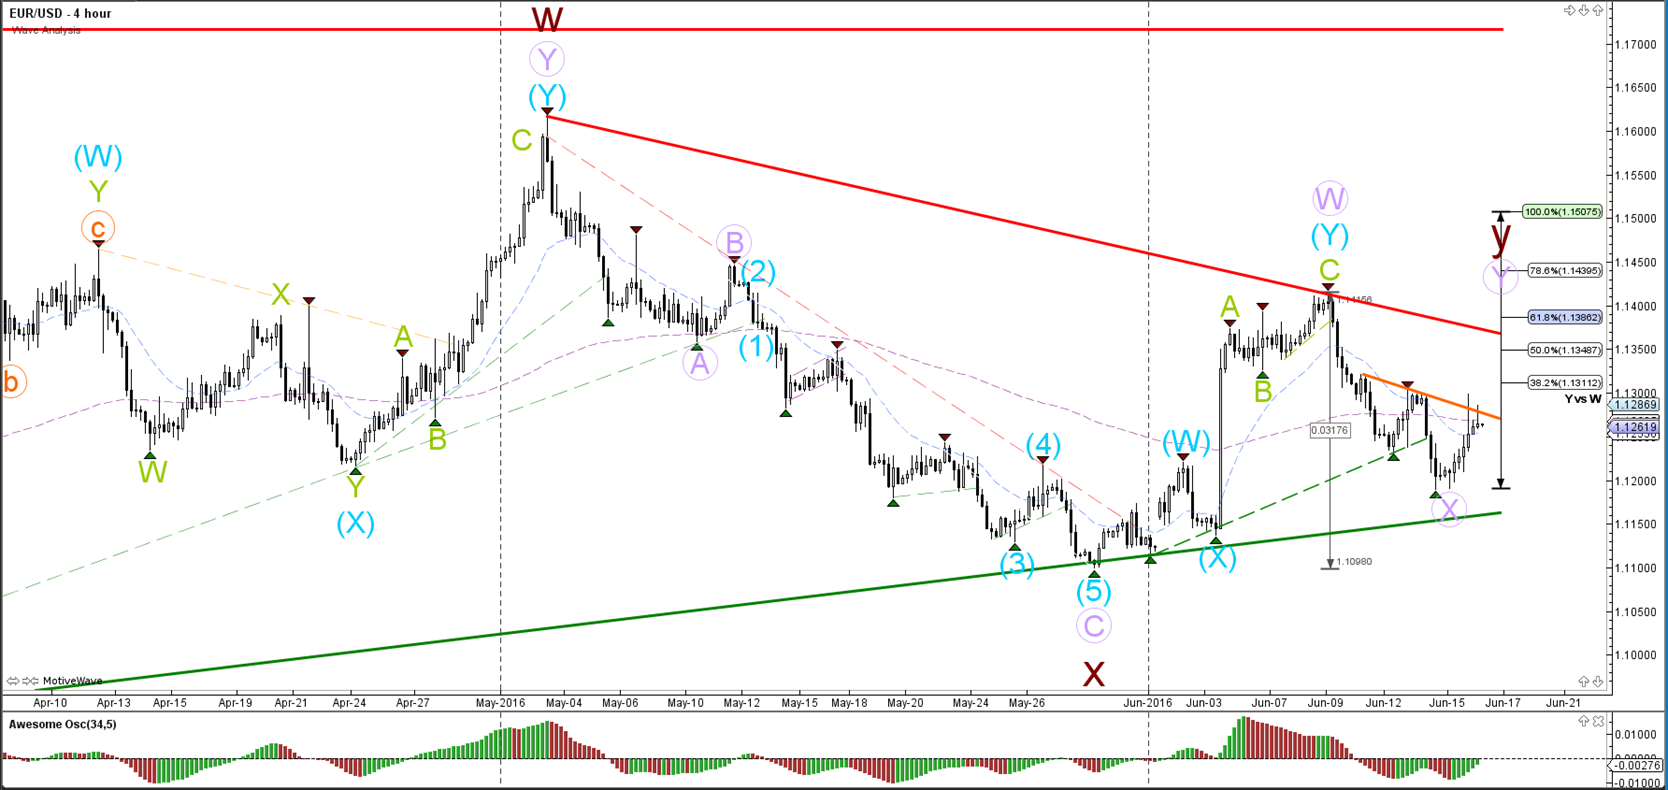
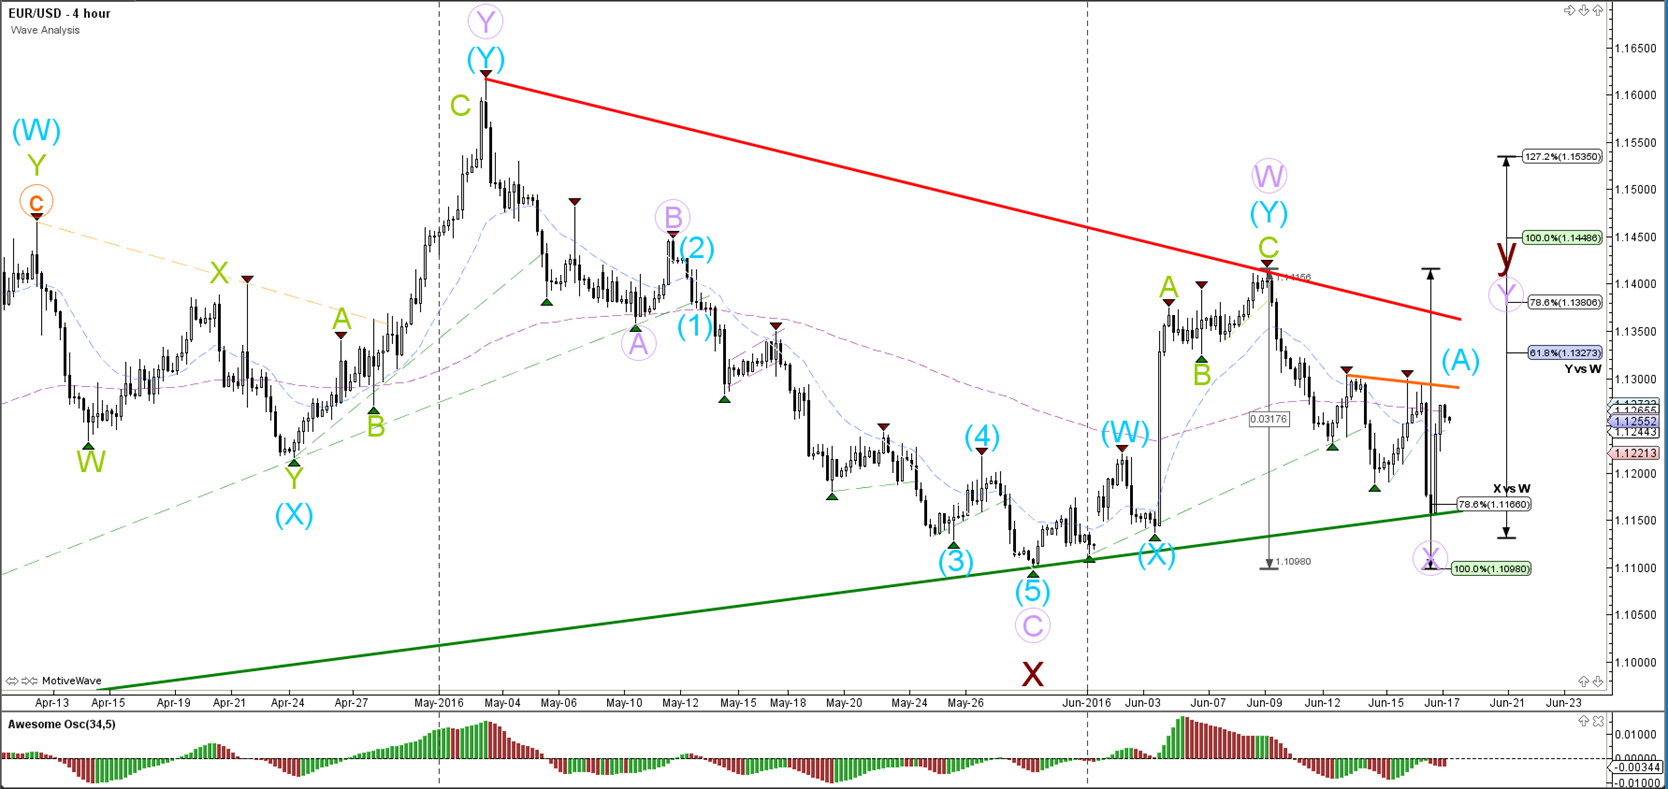
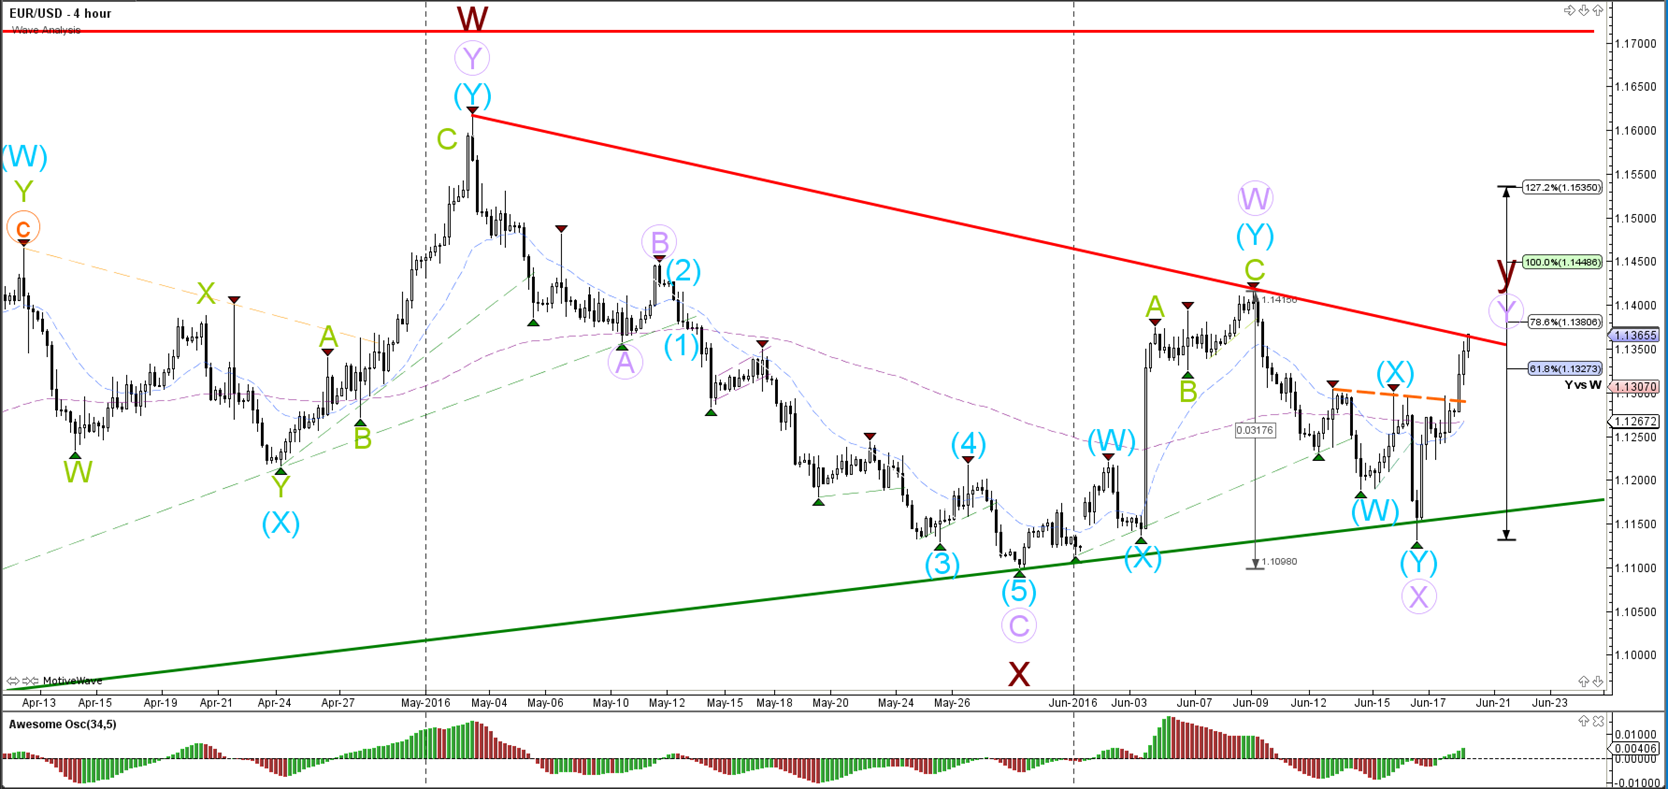
The current bearish momentum has been marked as a retracement for a wave X (purple), but this wave structure is invalidated if price manages to break below the long-term support trend line (green) and 100% Fibonacci level. The 61.8% and 78.6% Fibonacci retracement levels could become bullish bounce spots.
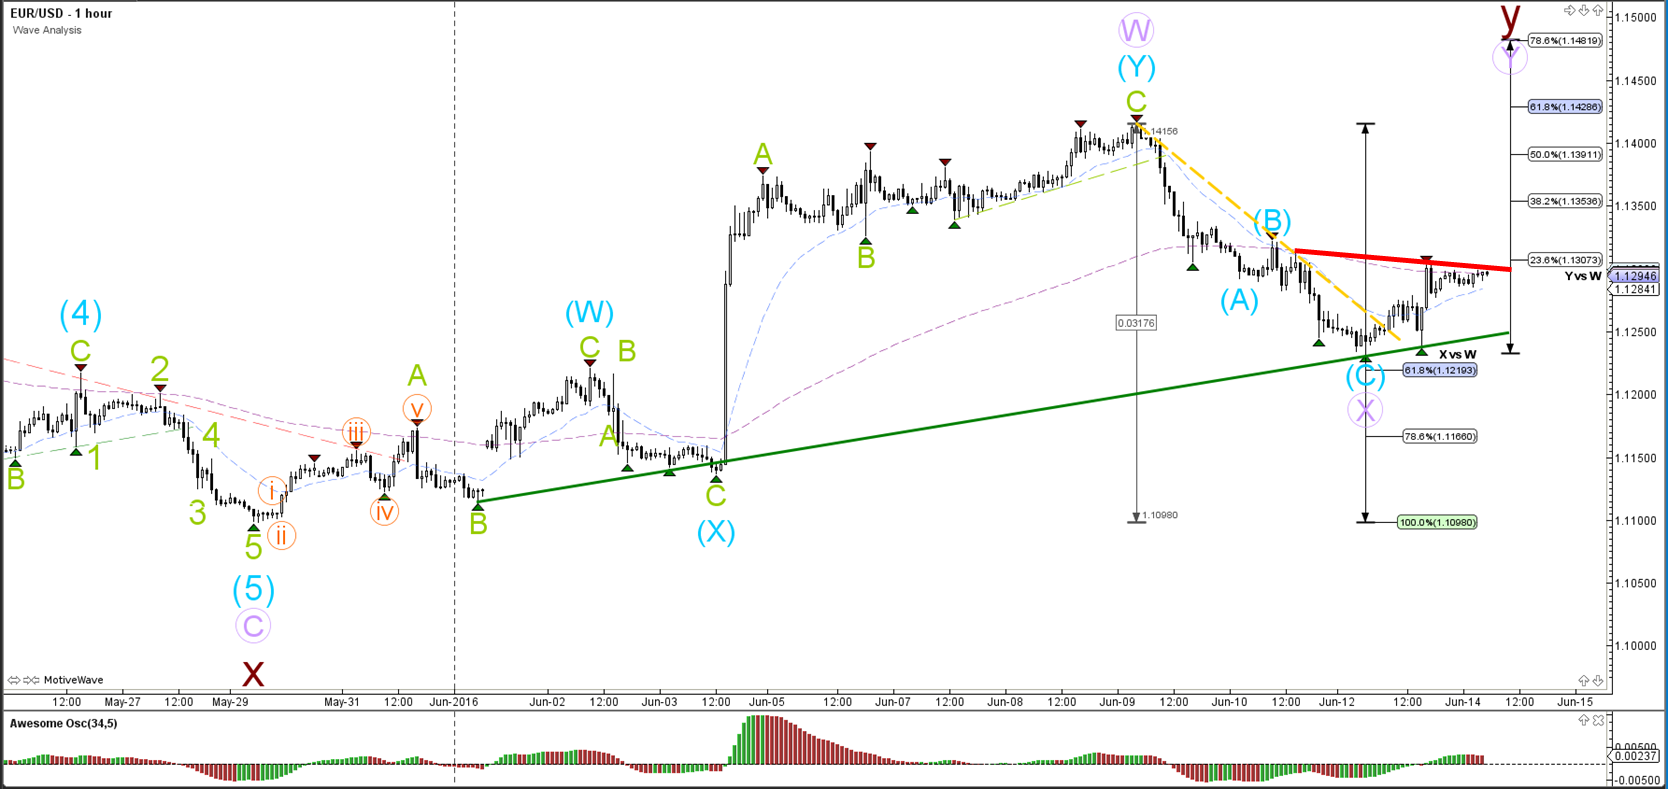
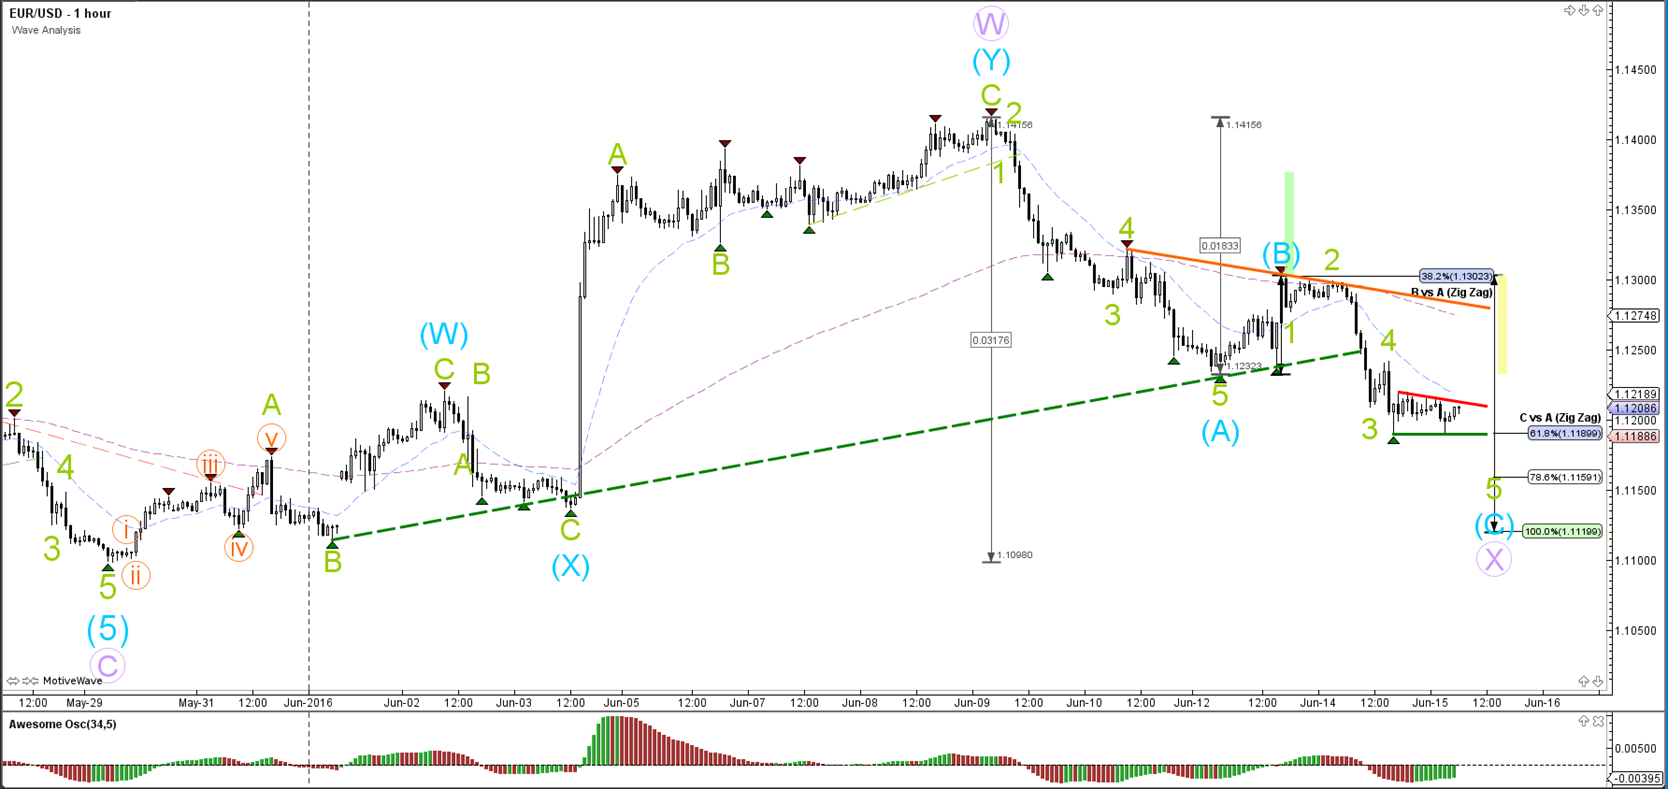
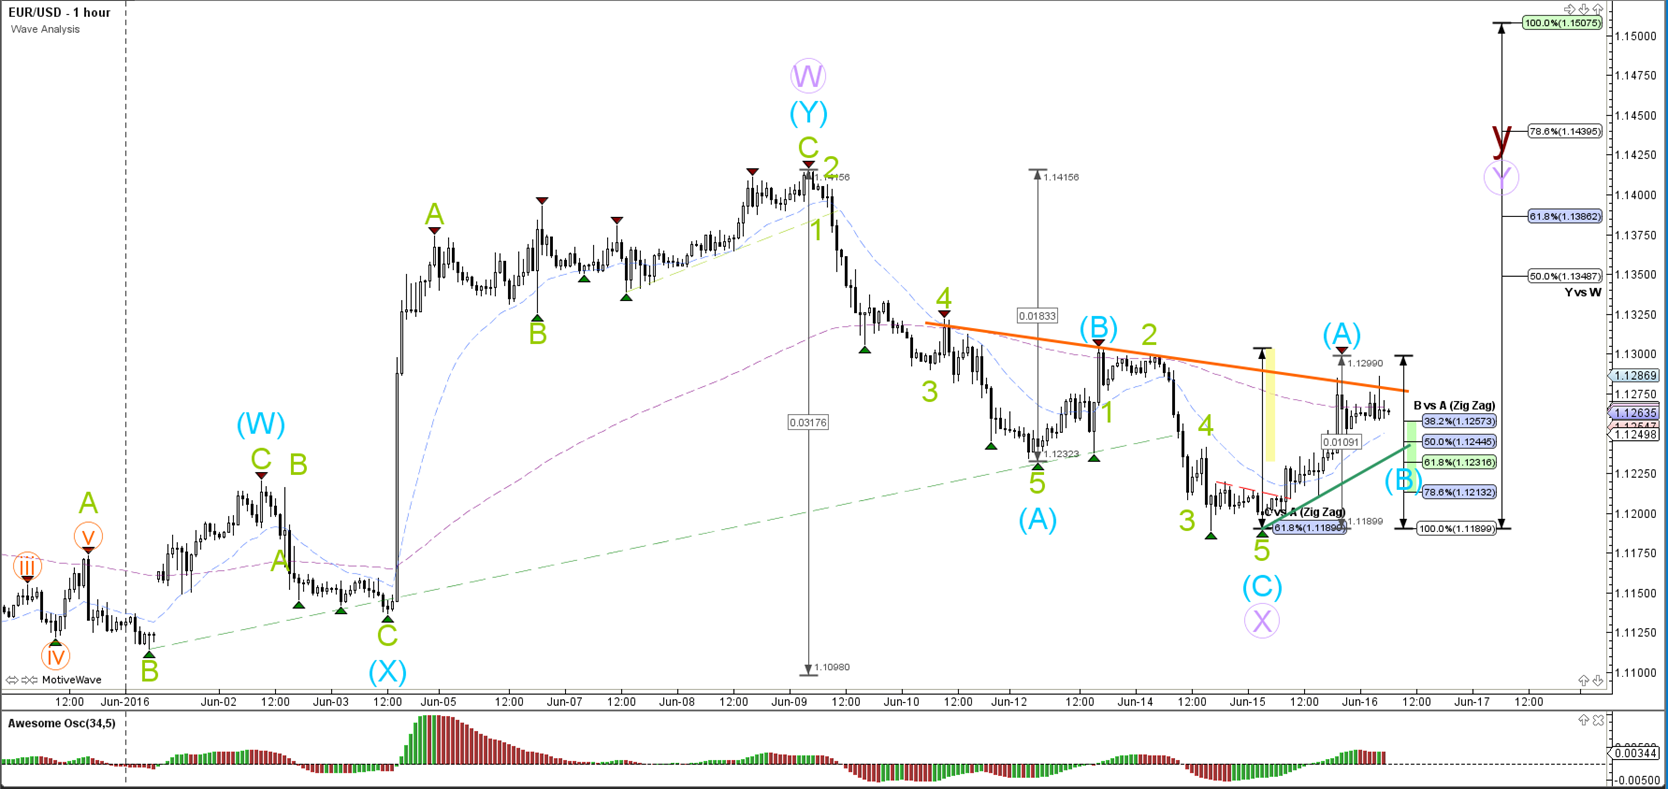
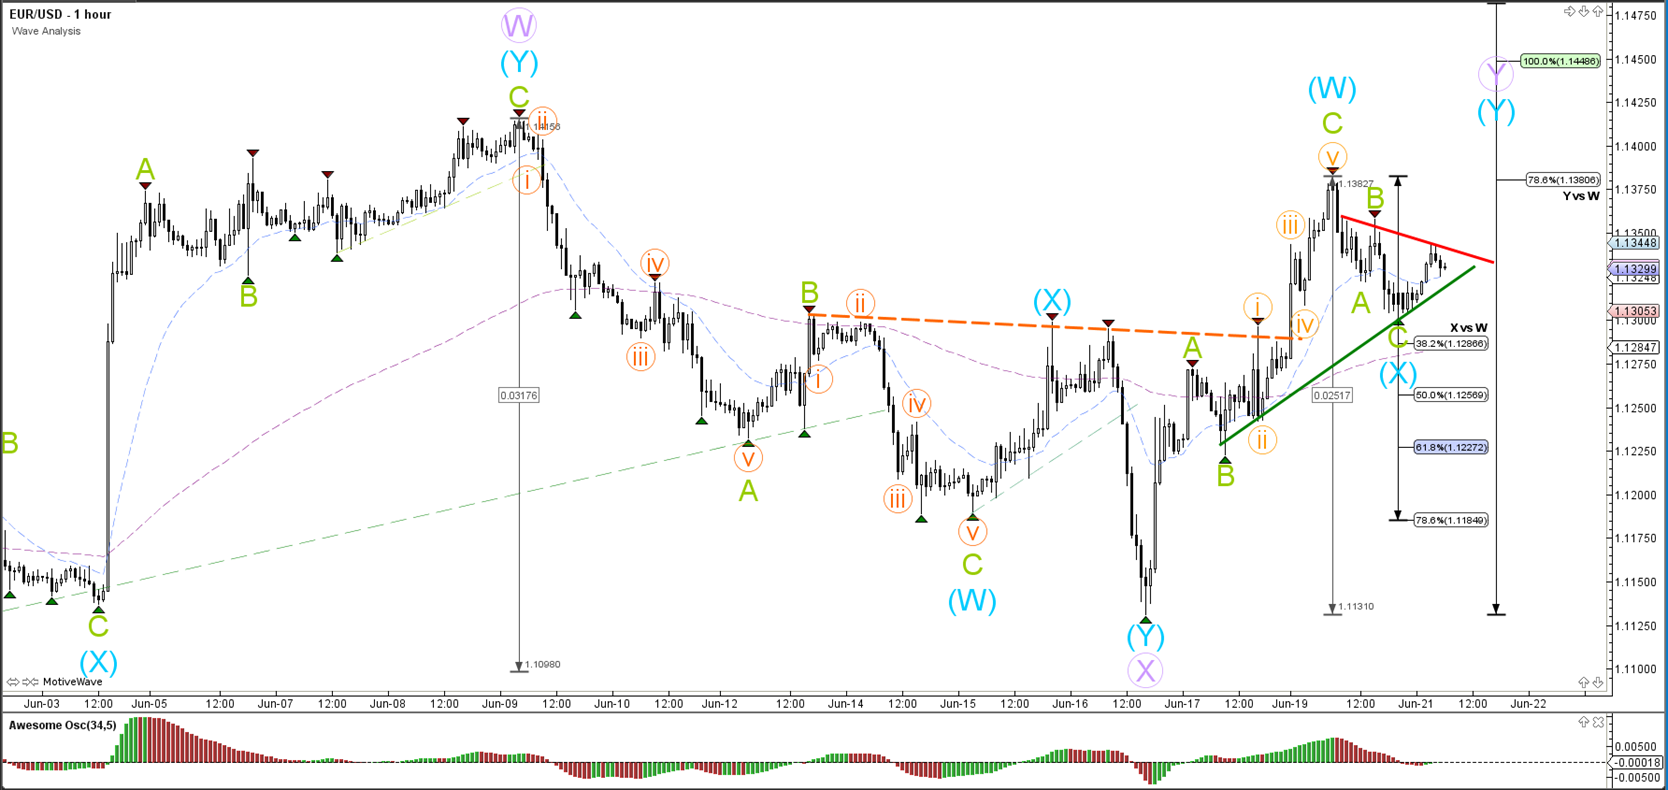
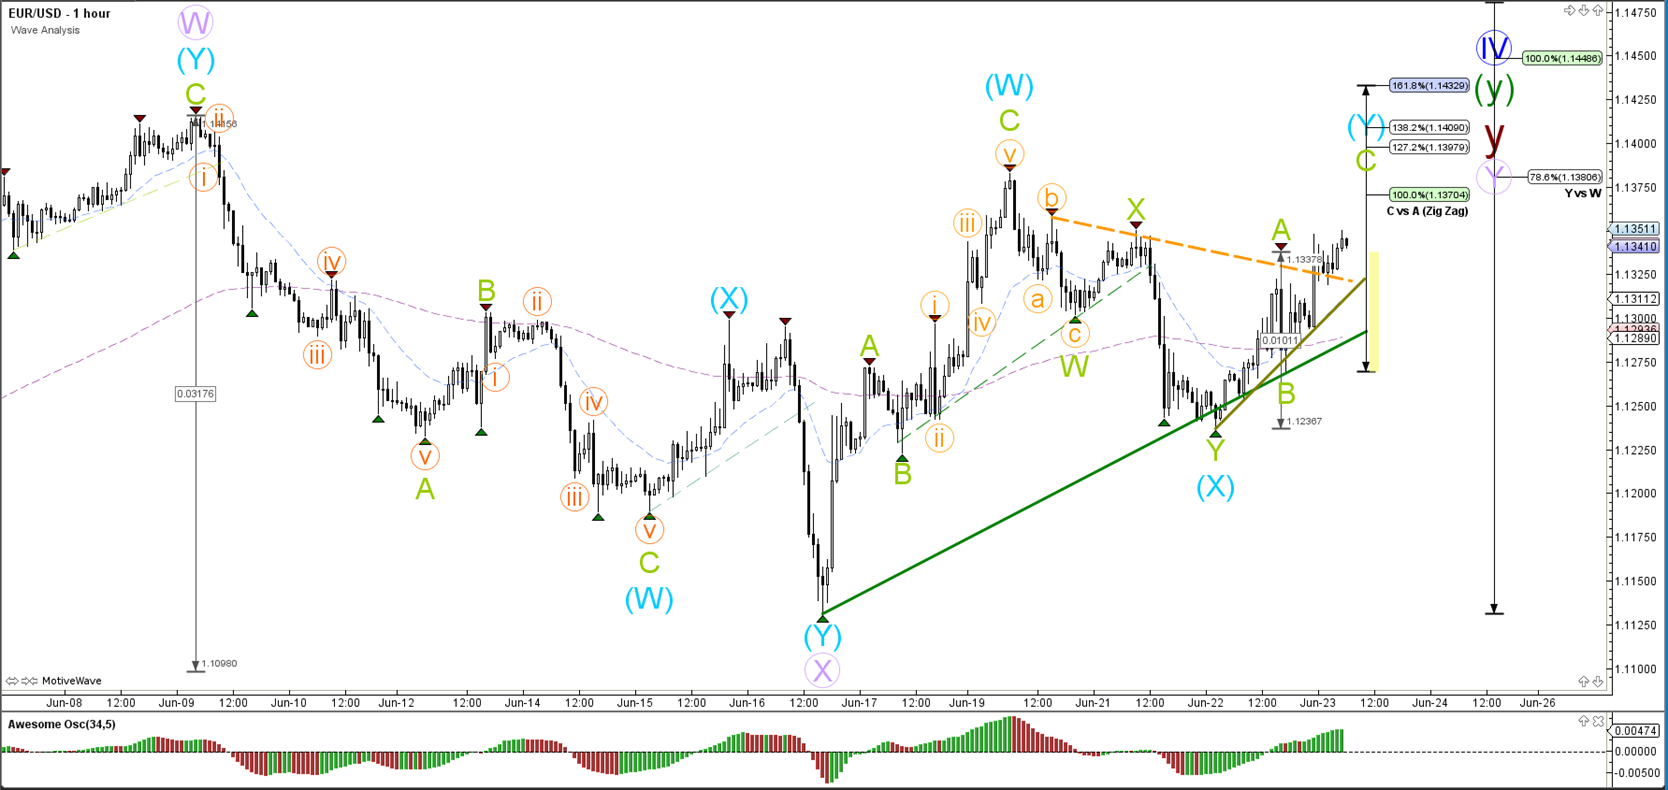
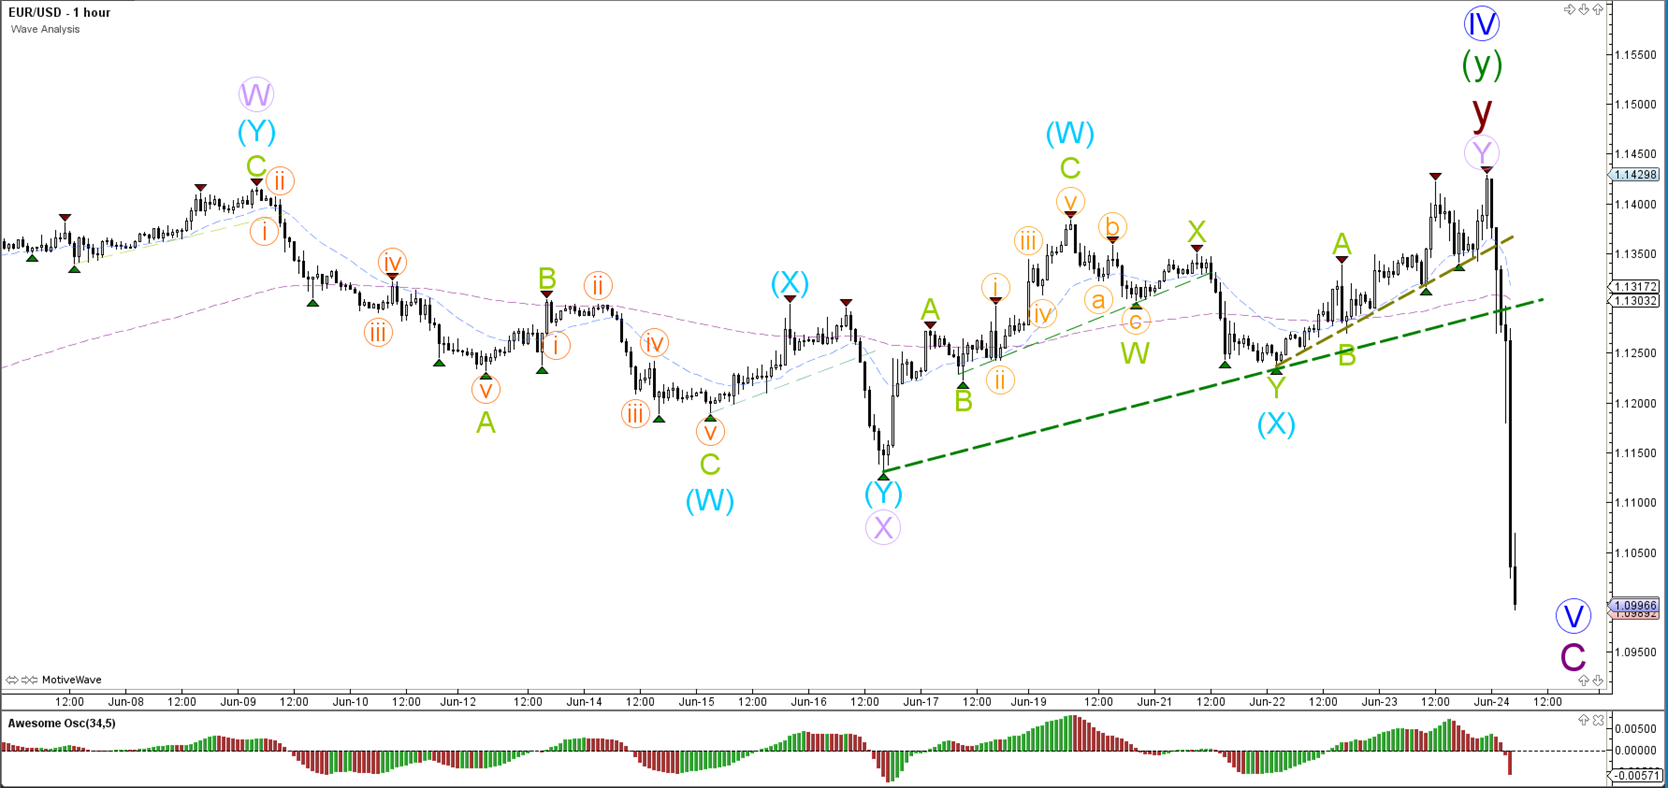
1 hour

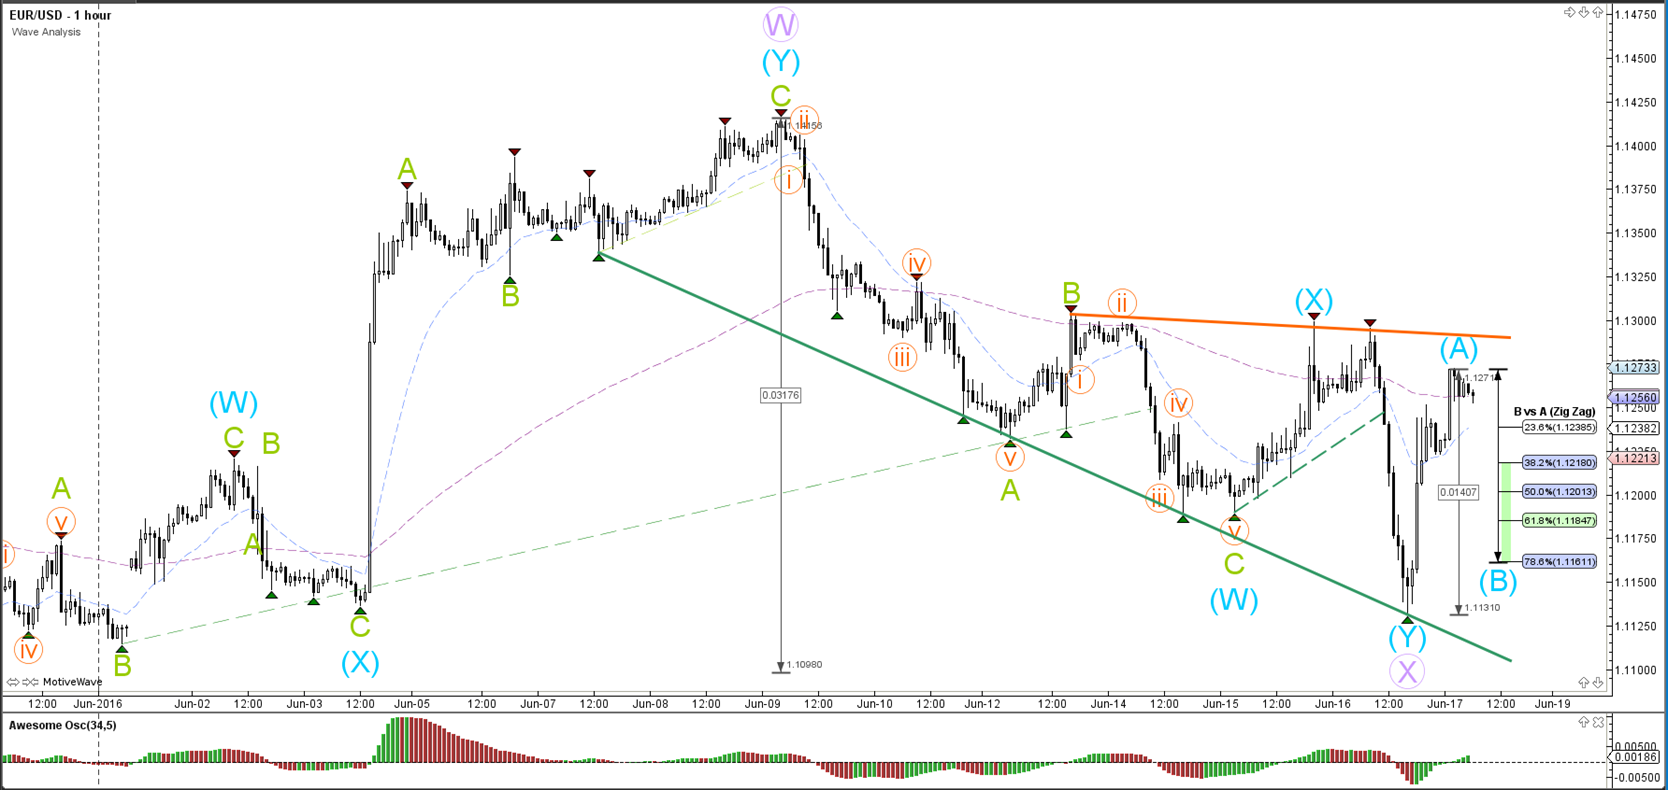
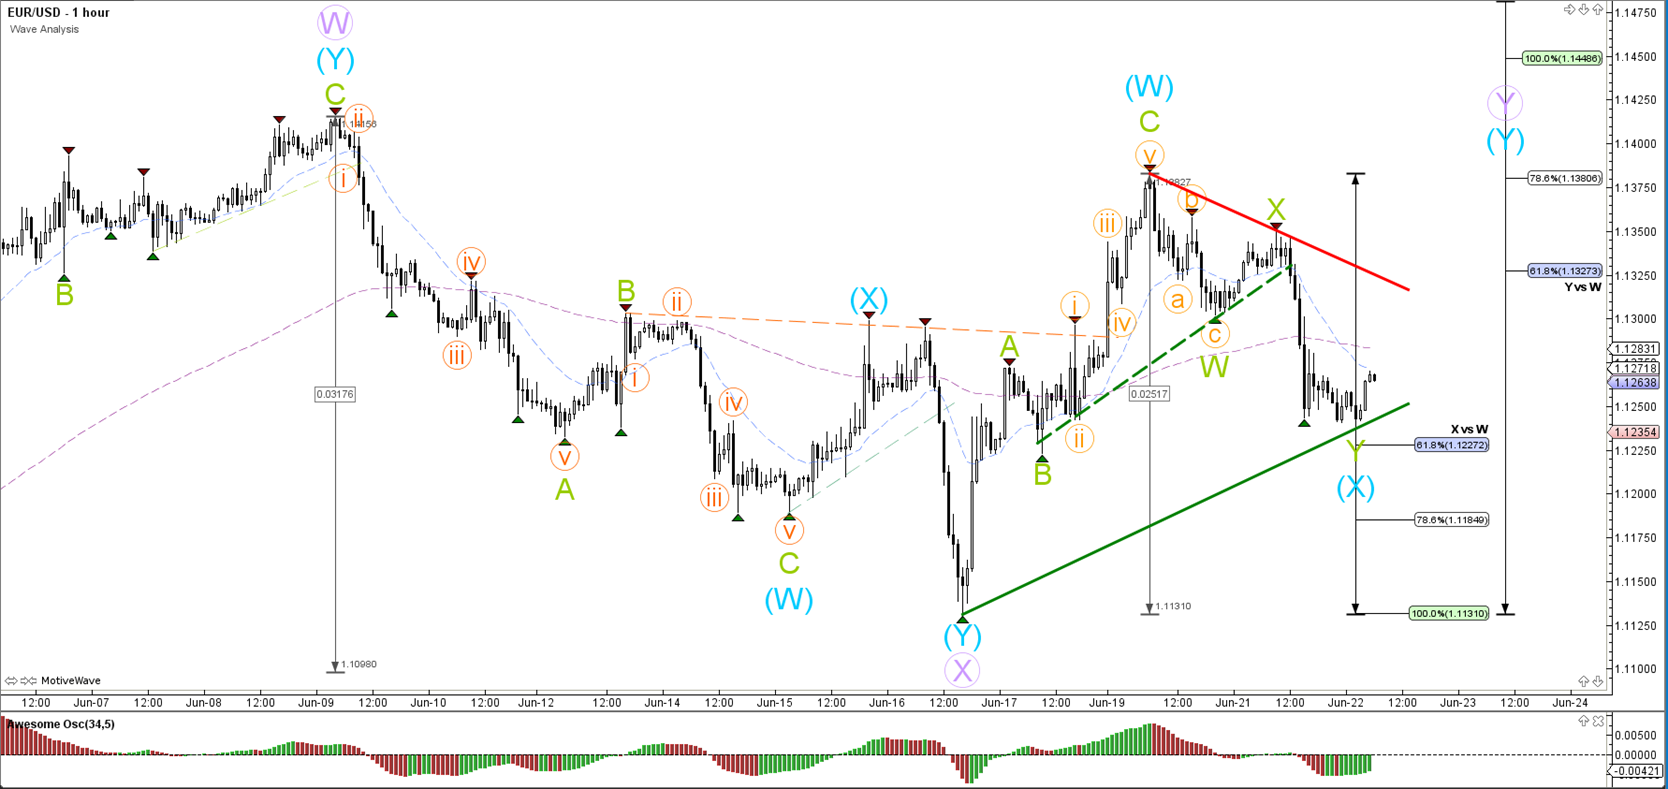
The EUR/USD bearish momentum seems to be building an ABC zigzag (blue) within wave X (purple).
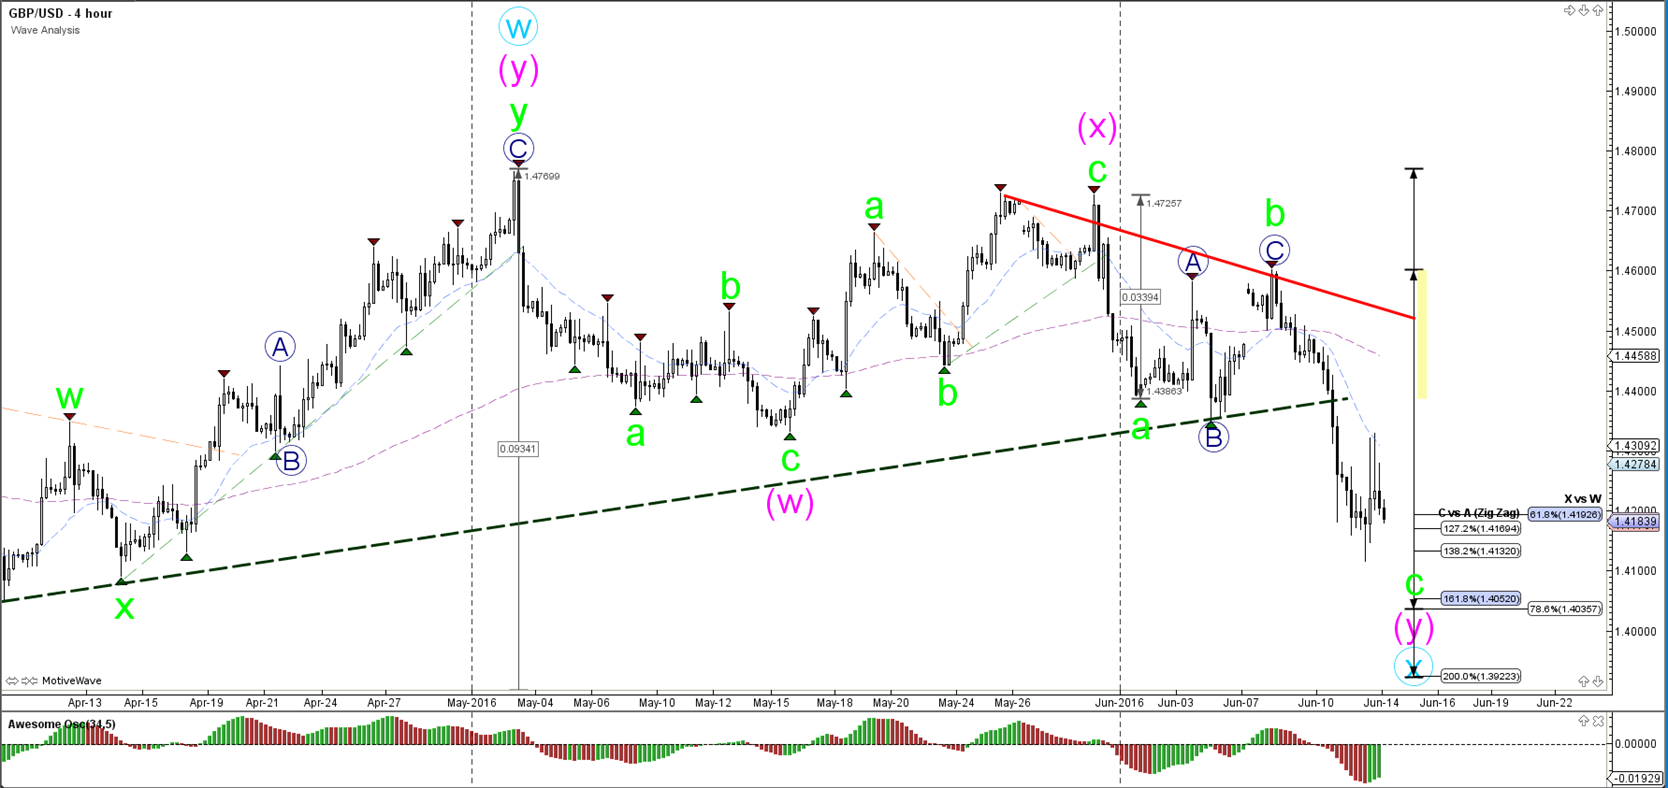
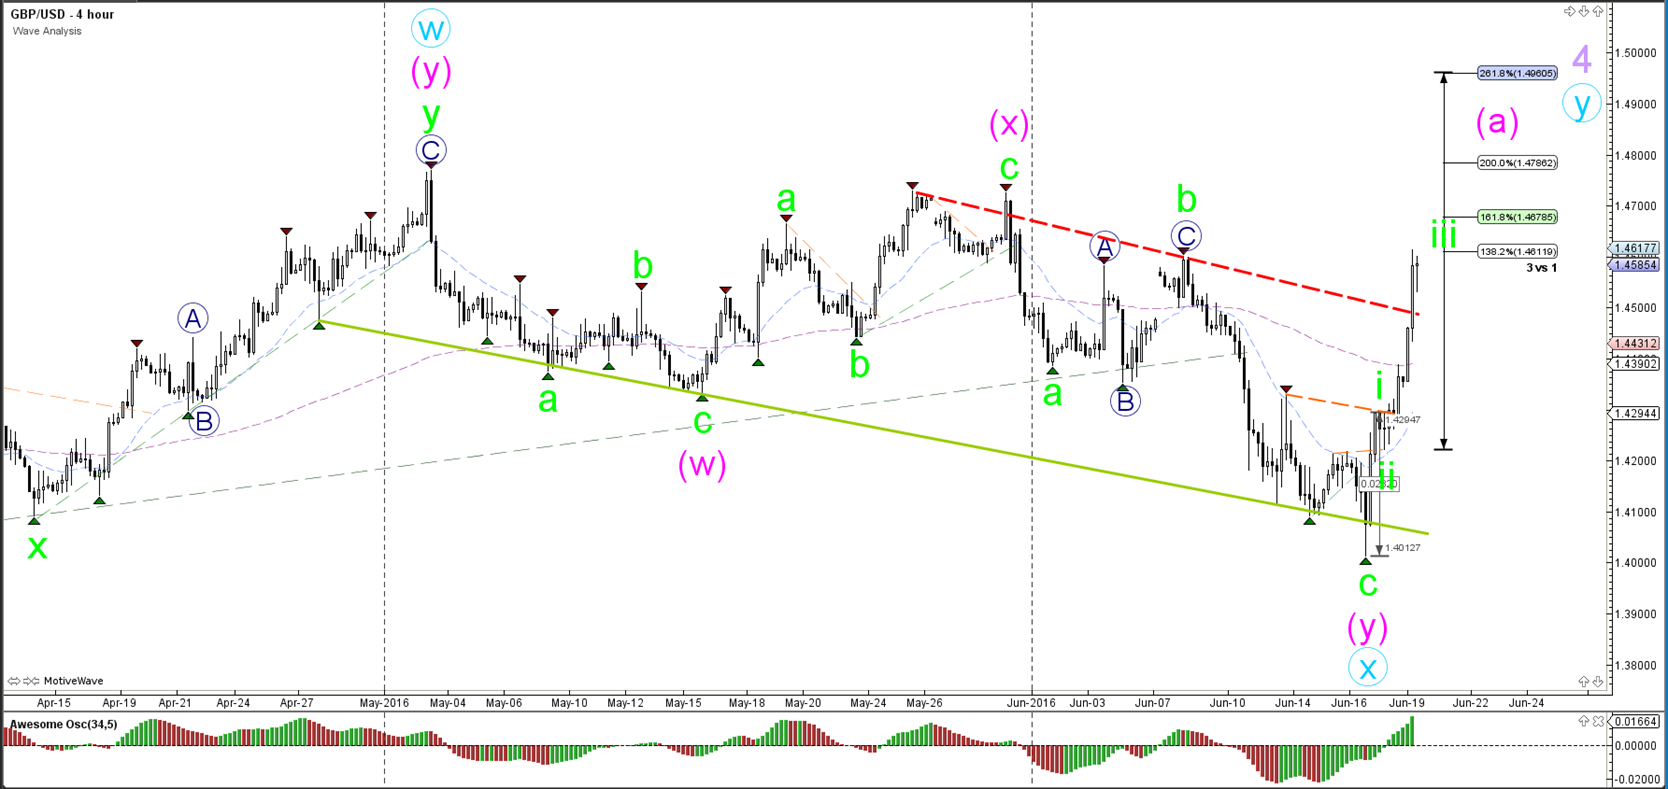
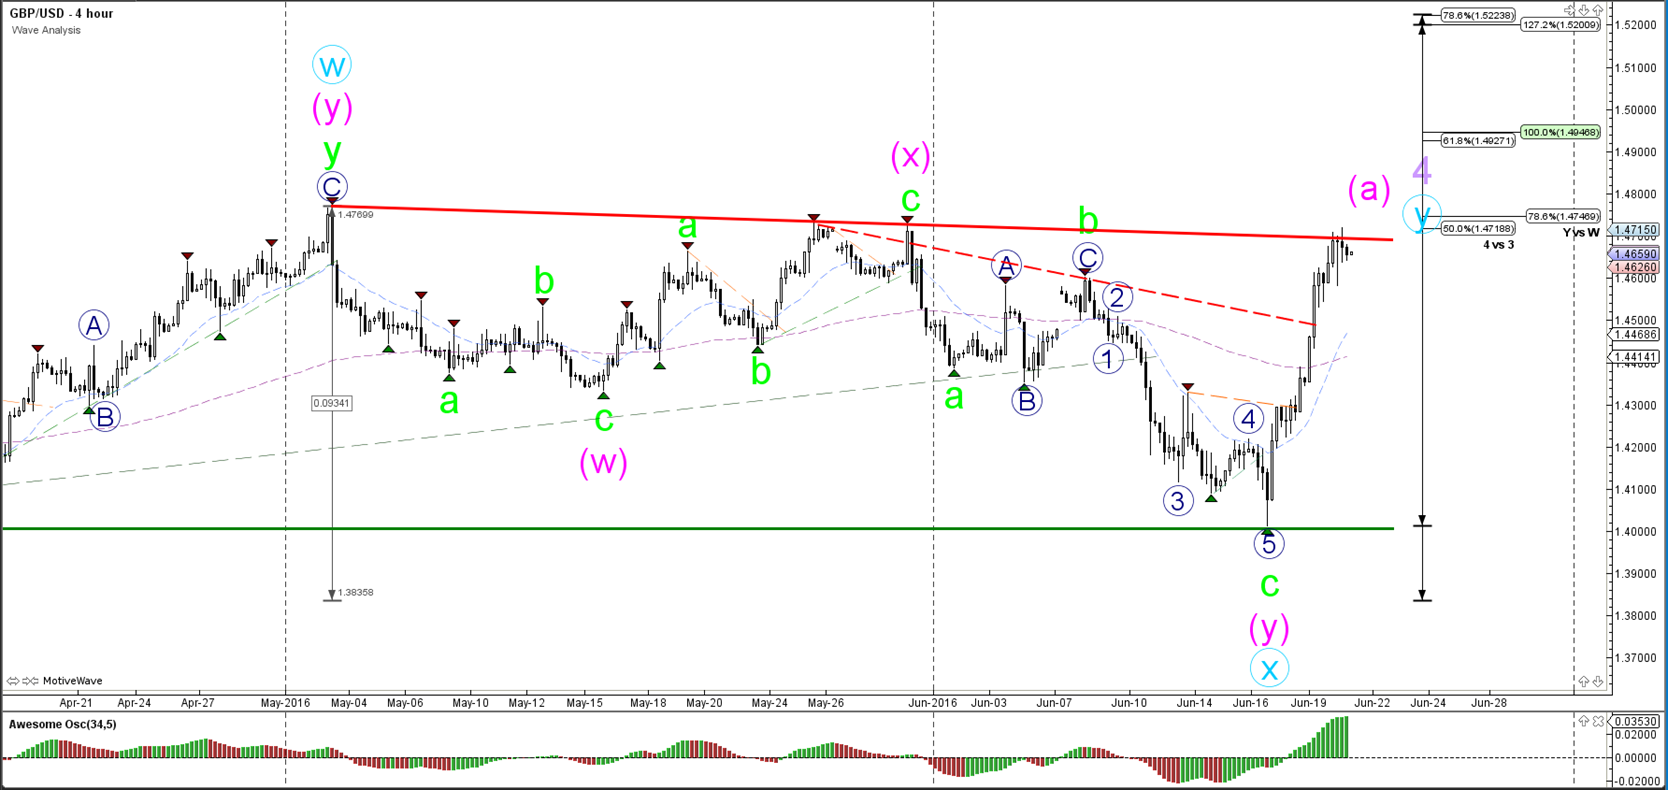
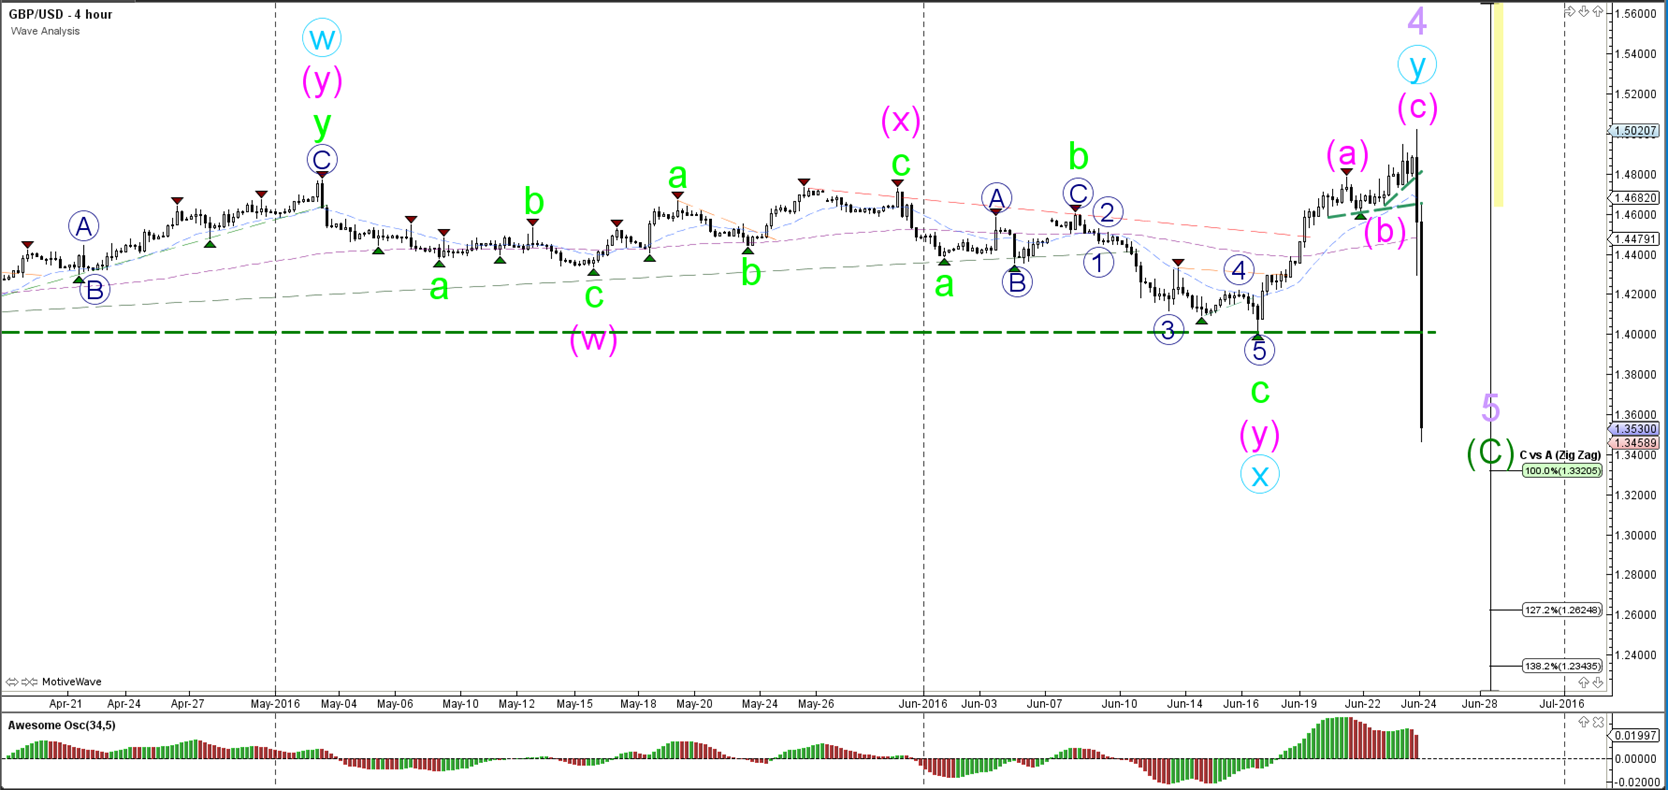
GBP/USD
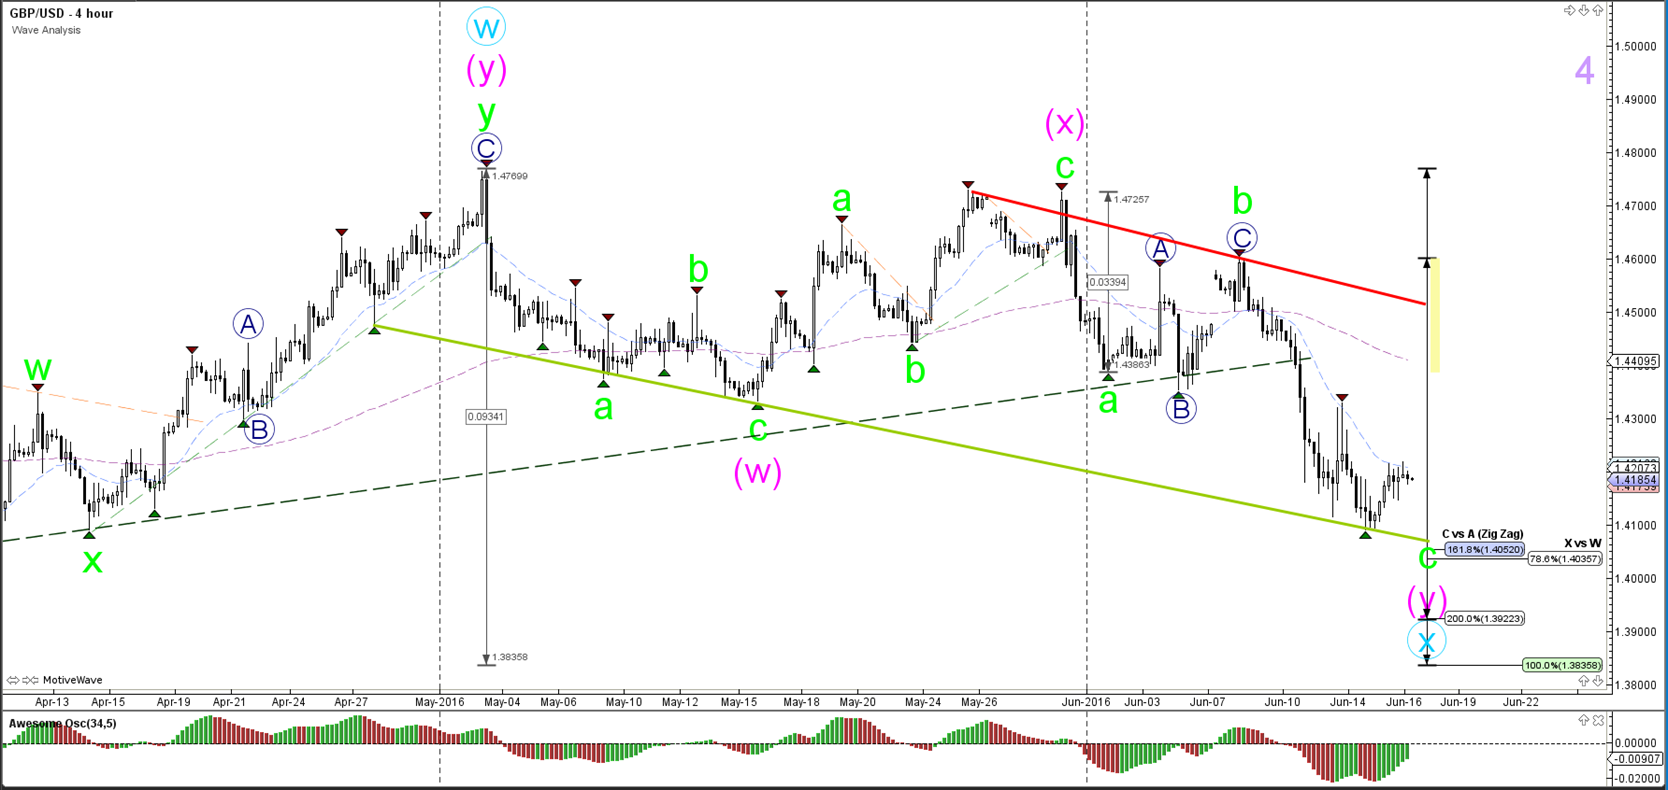
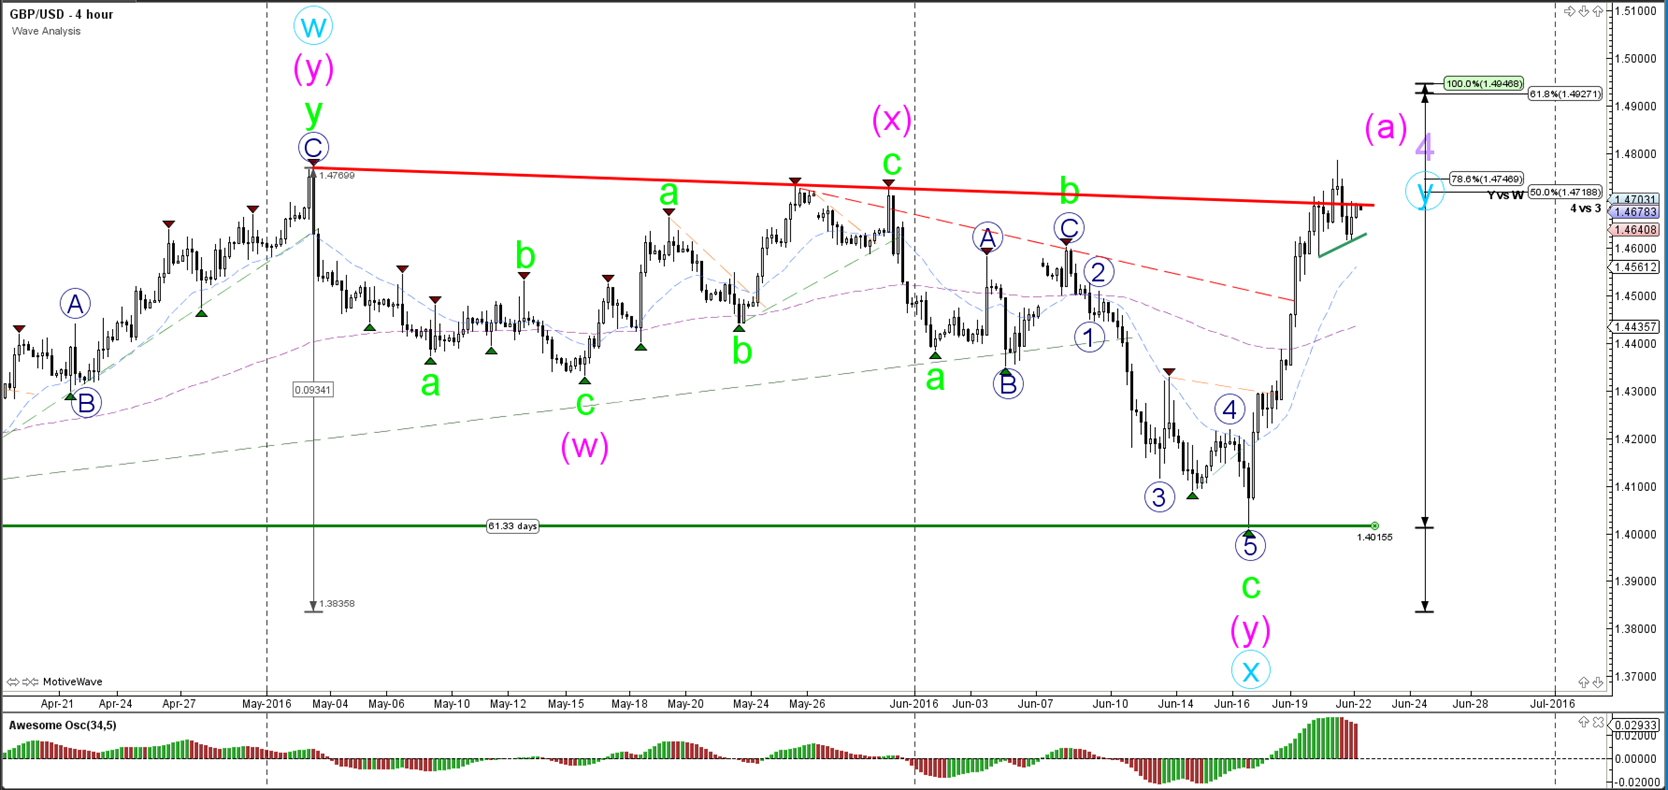
4 hour

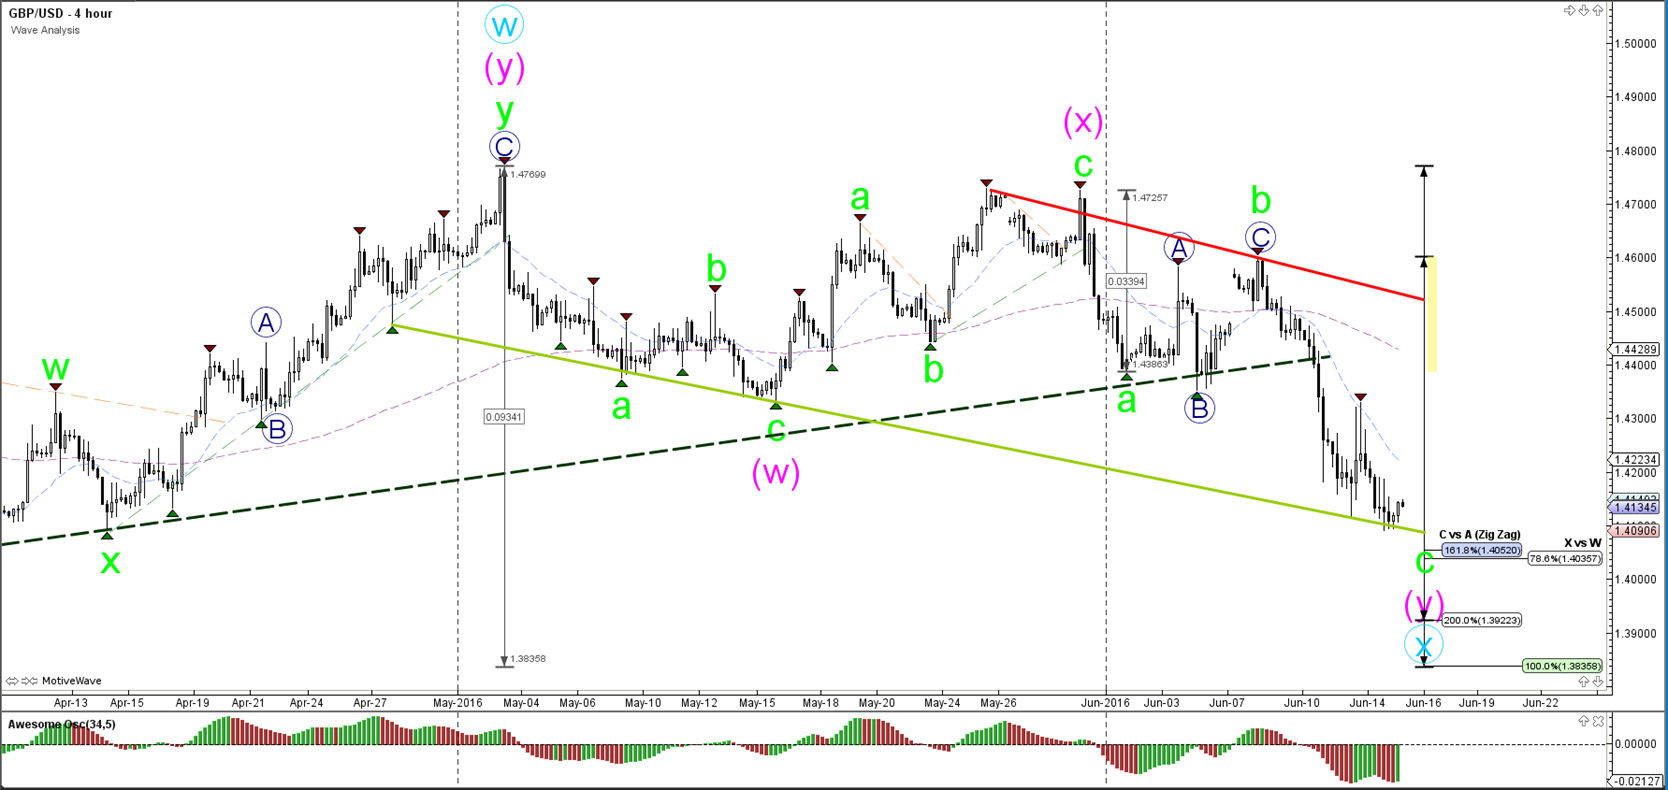
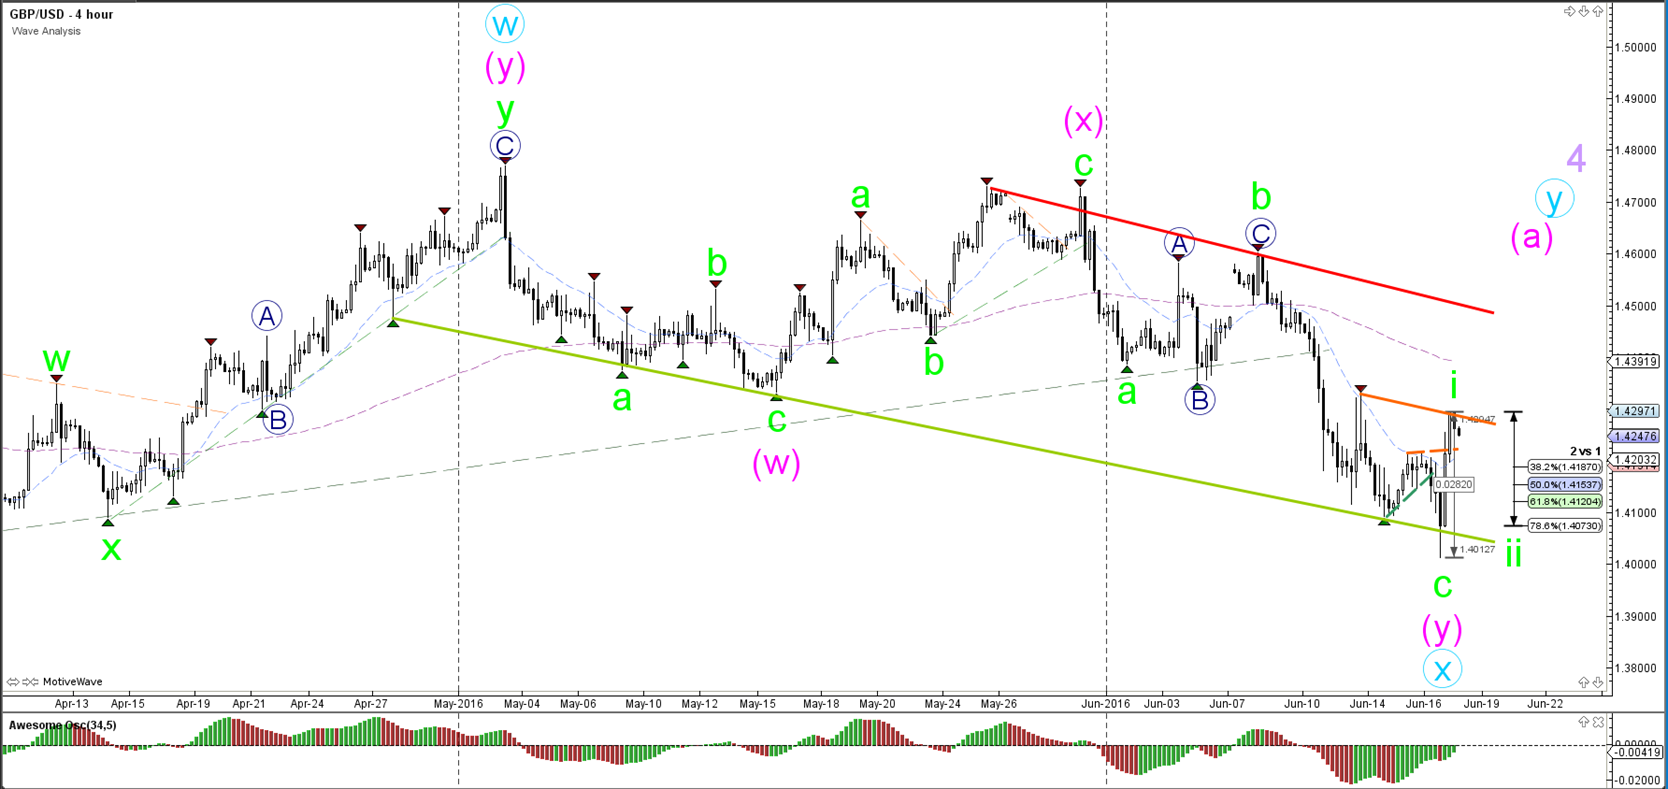
The GBP/USD broke below the support trend line (dotted green). For the moment price action remains marked as corrective unless price manages to break below the 161.8% target, which makes a 123 wave pattern more likely than the current ABC (green).
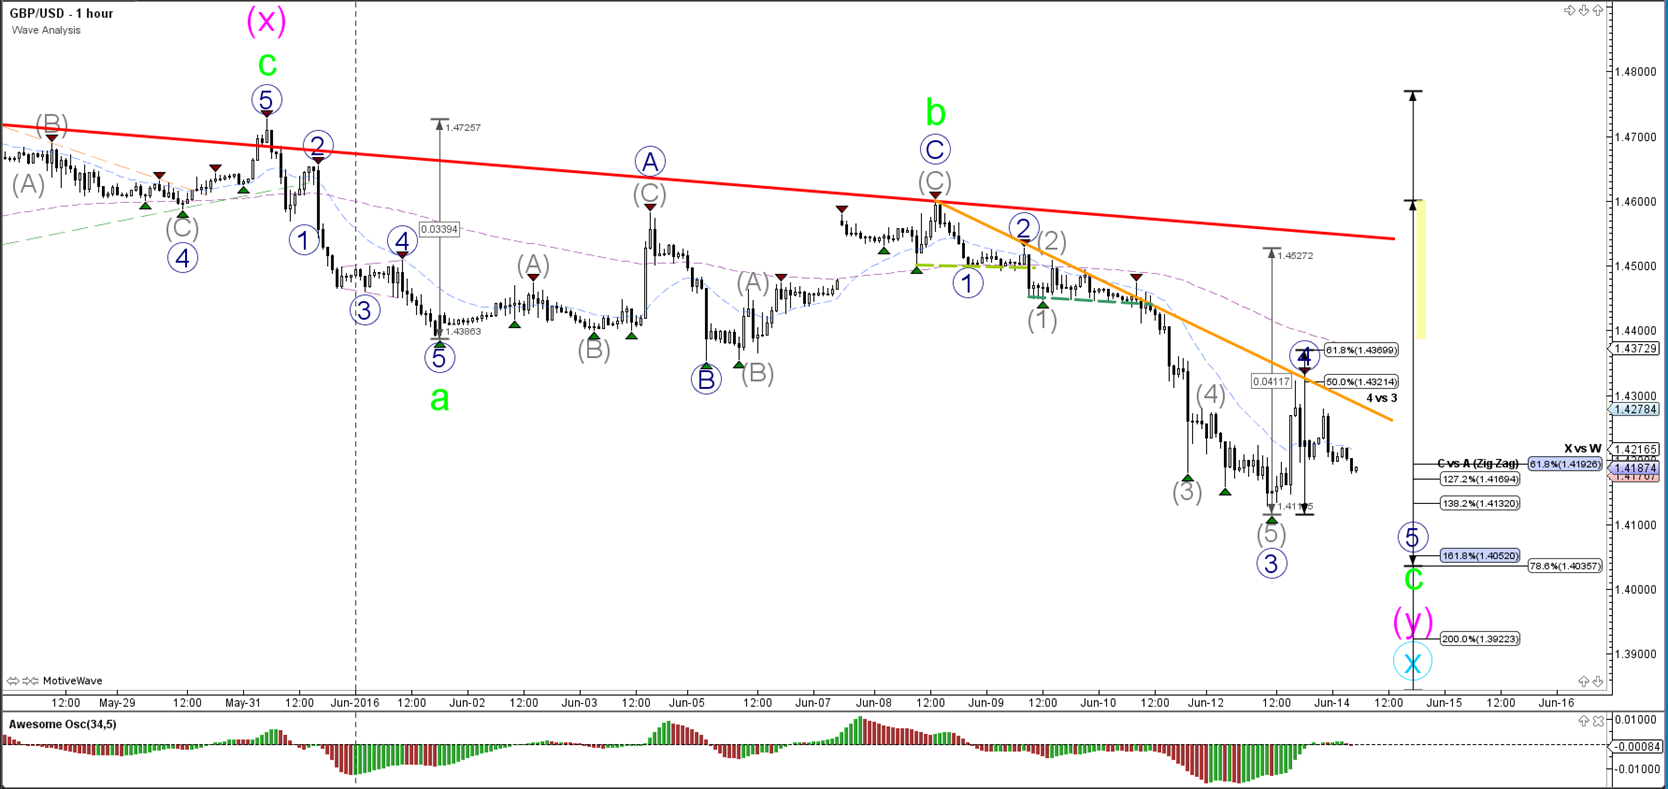
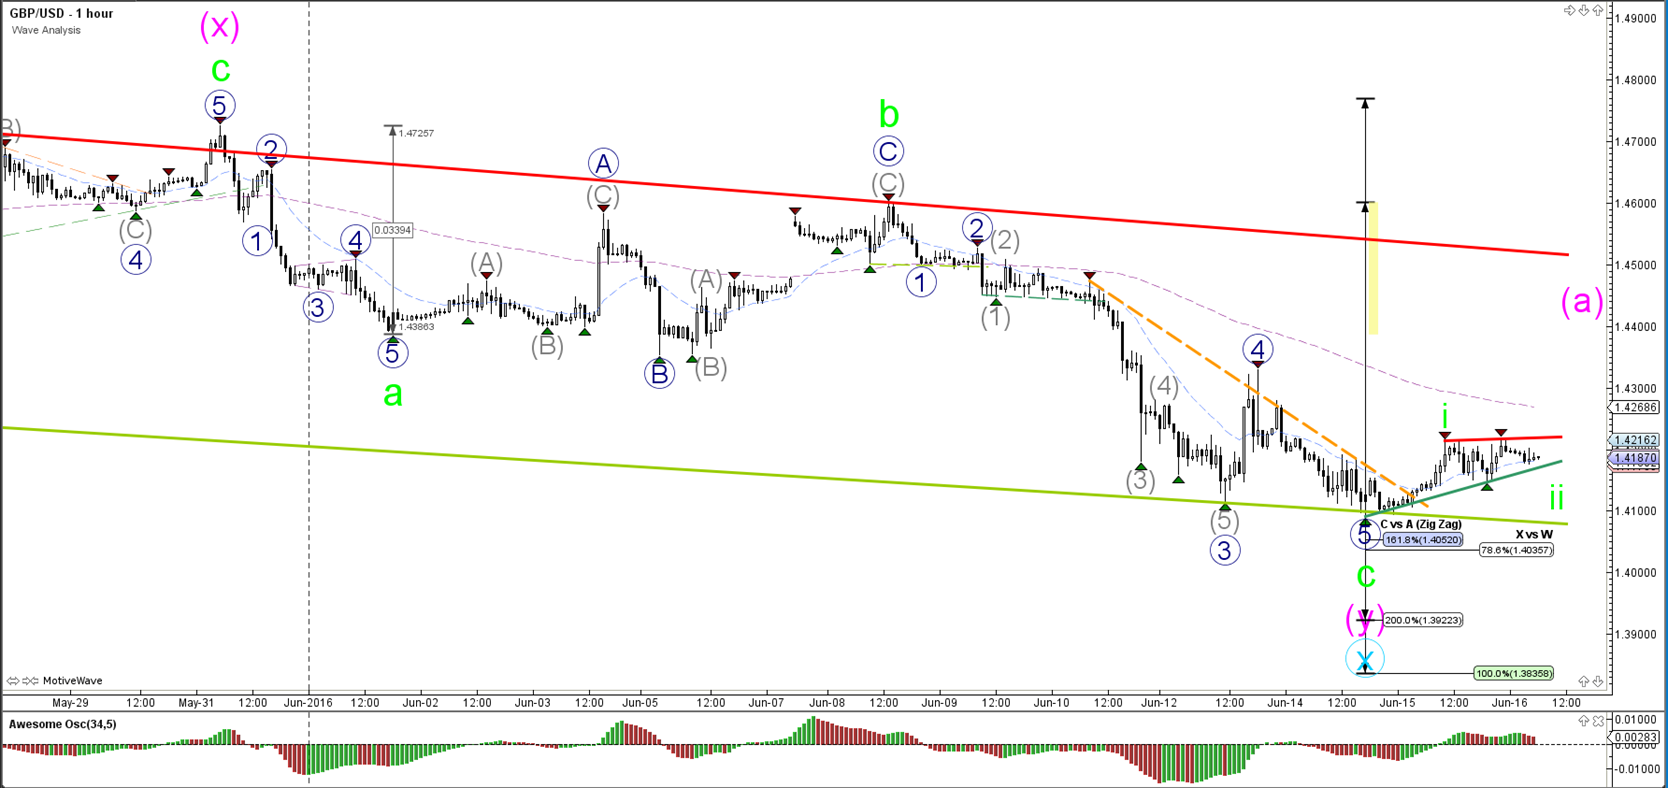
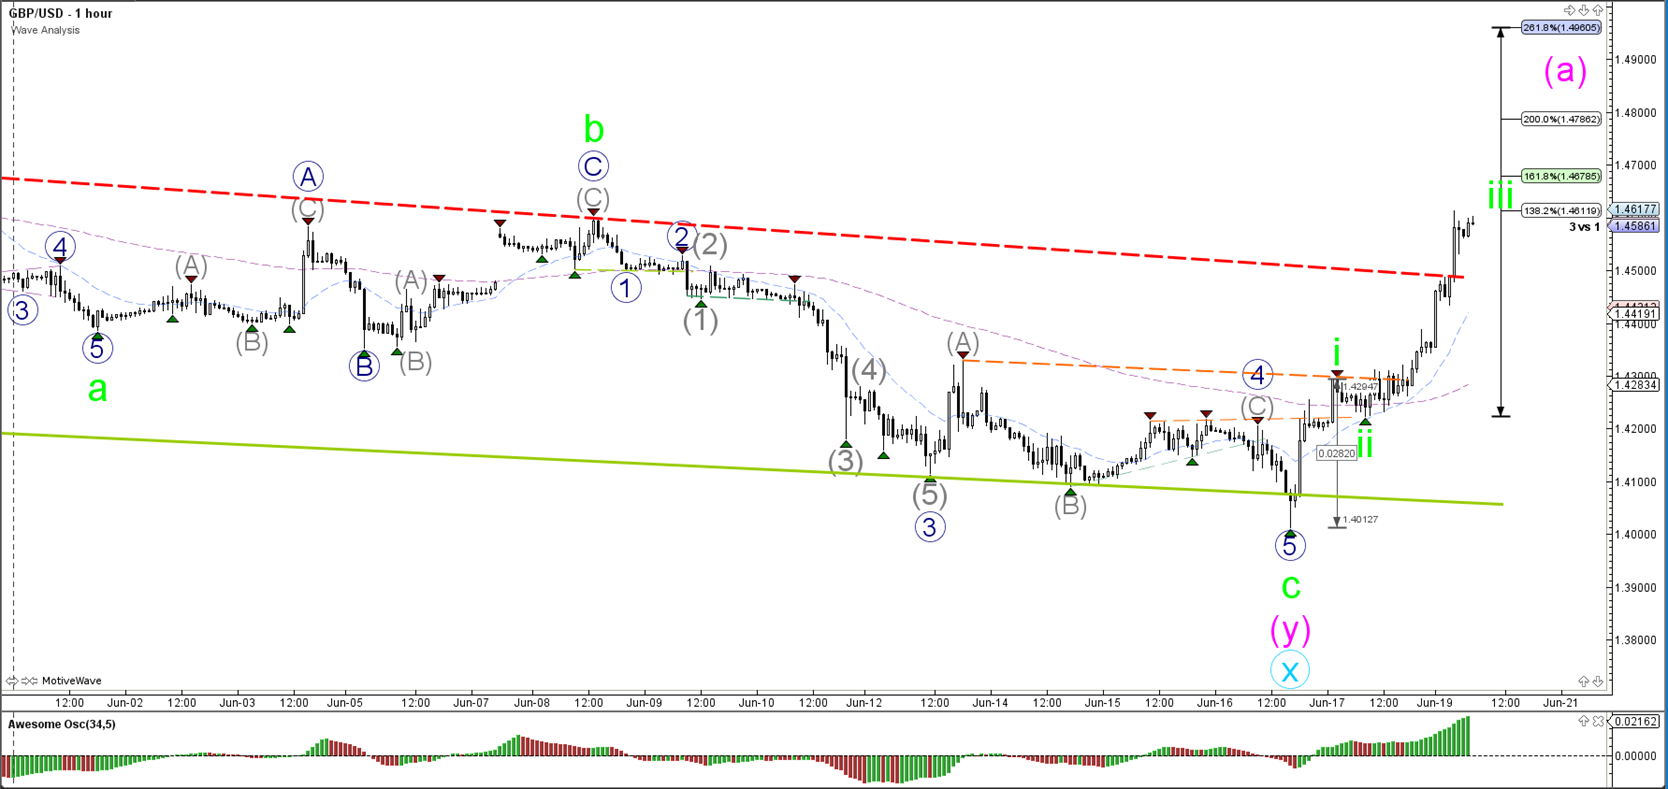
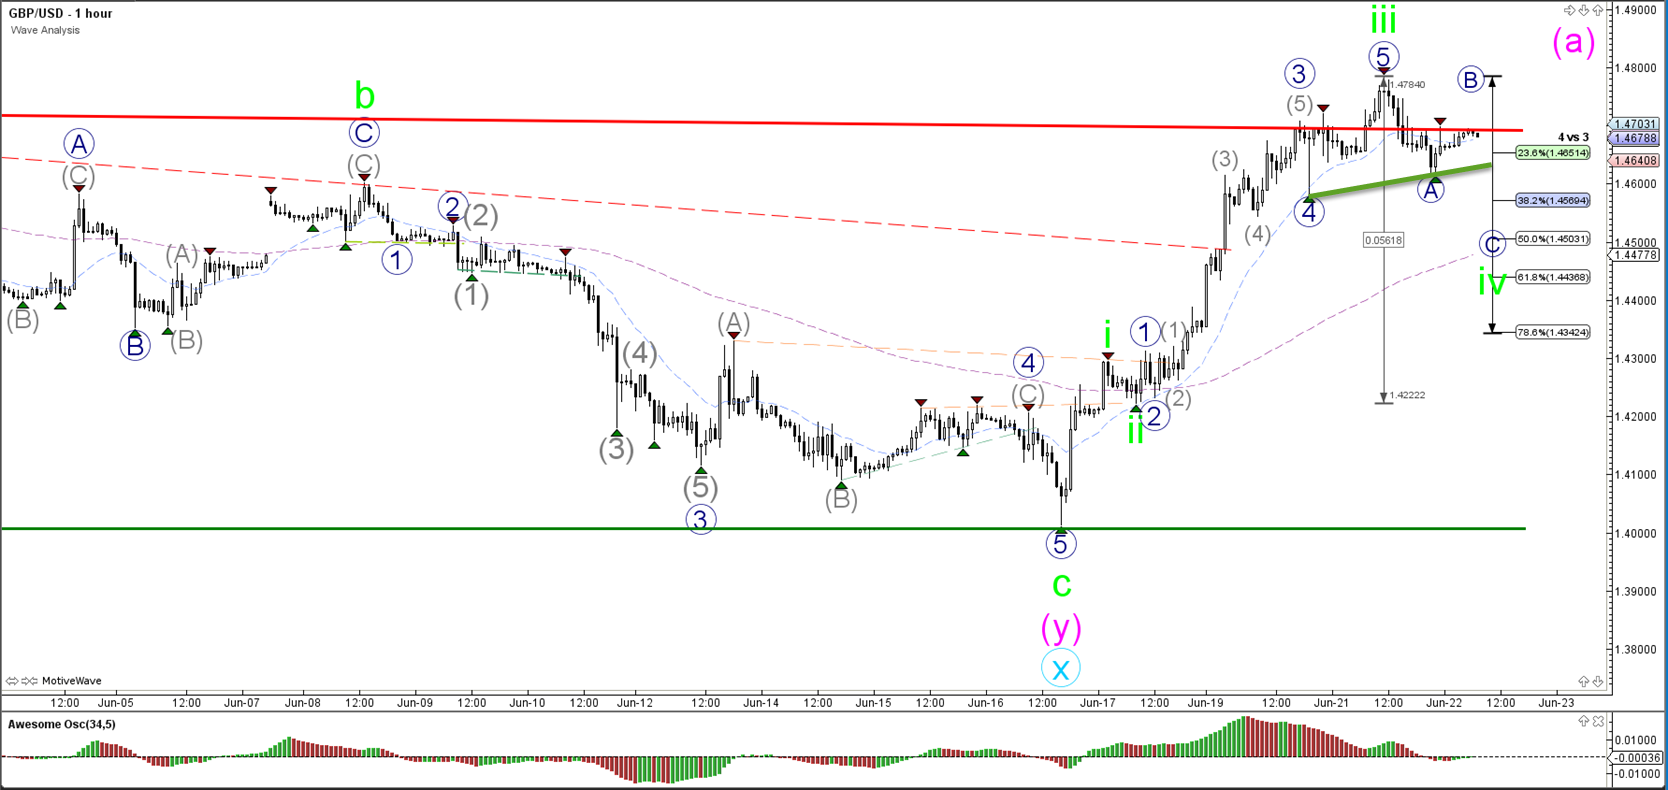
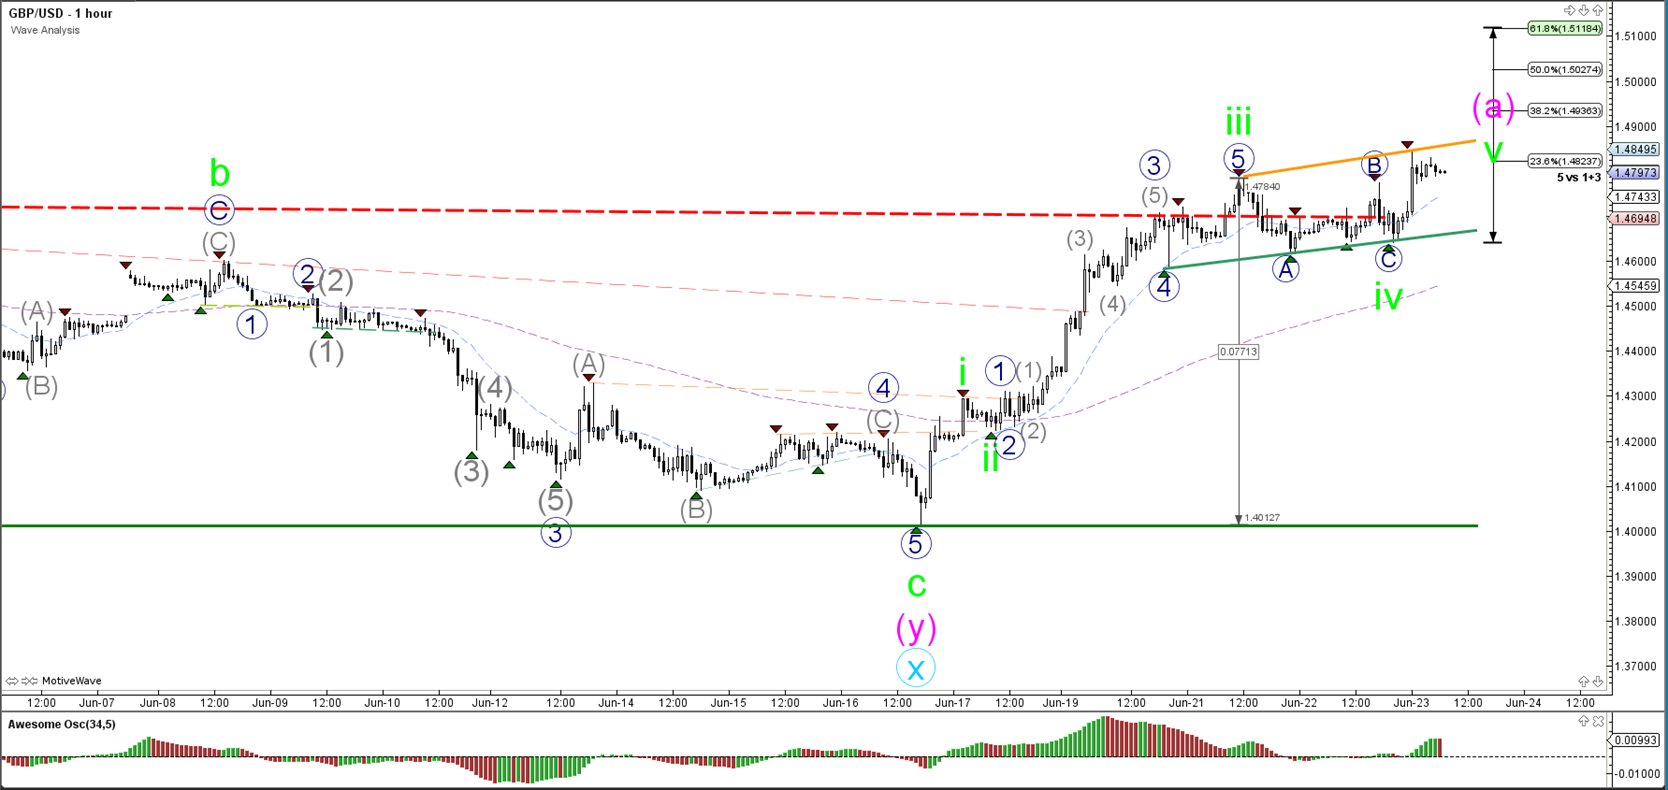
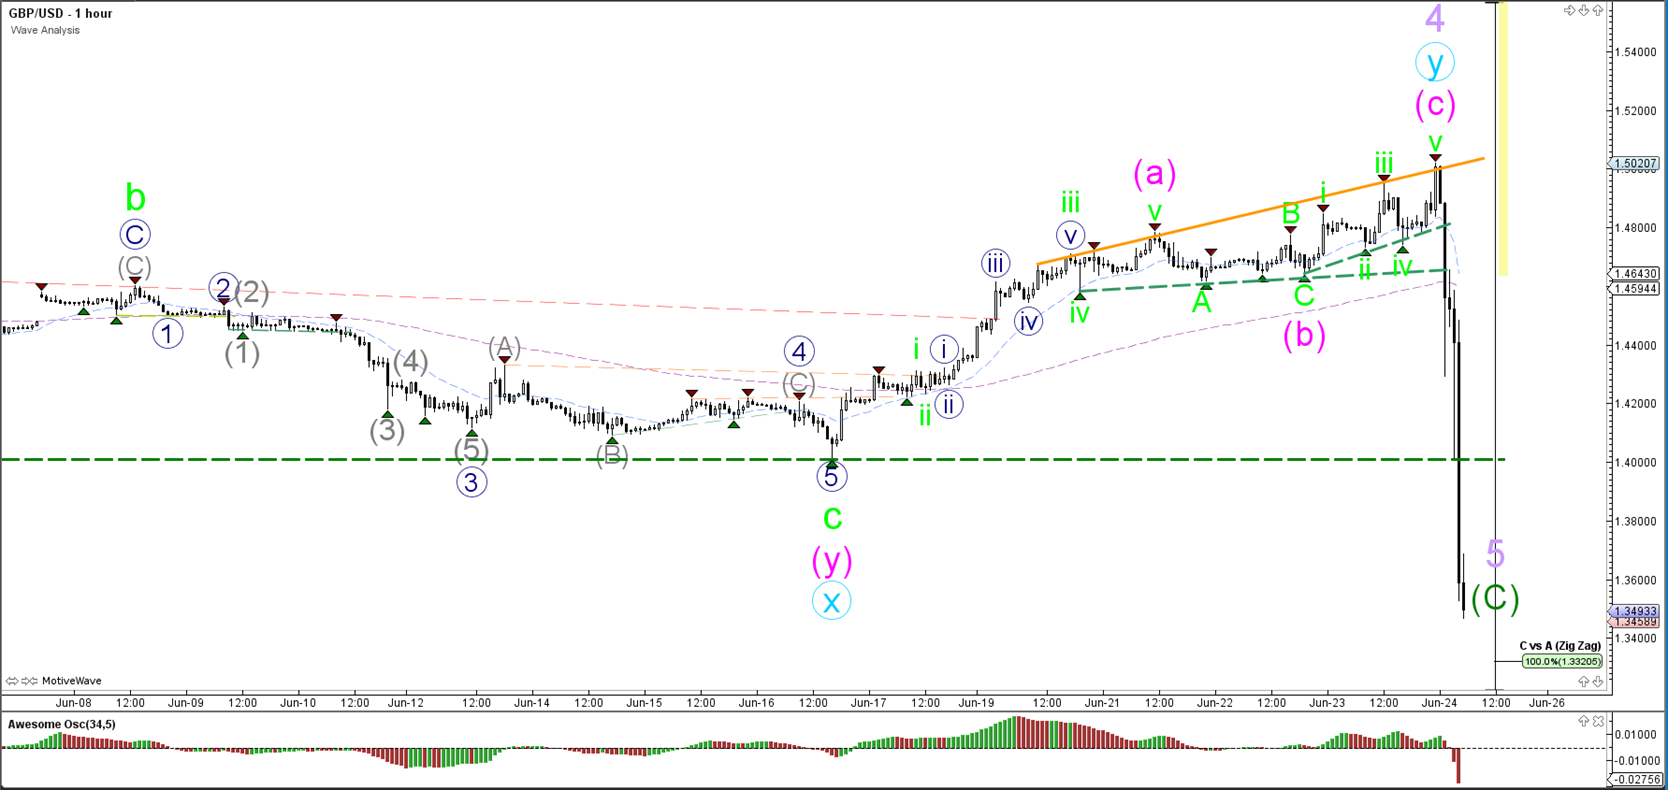
1 hour

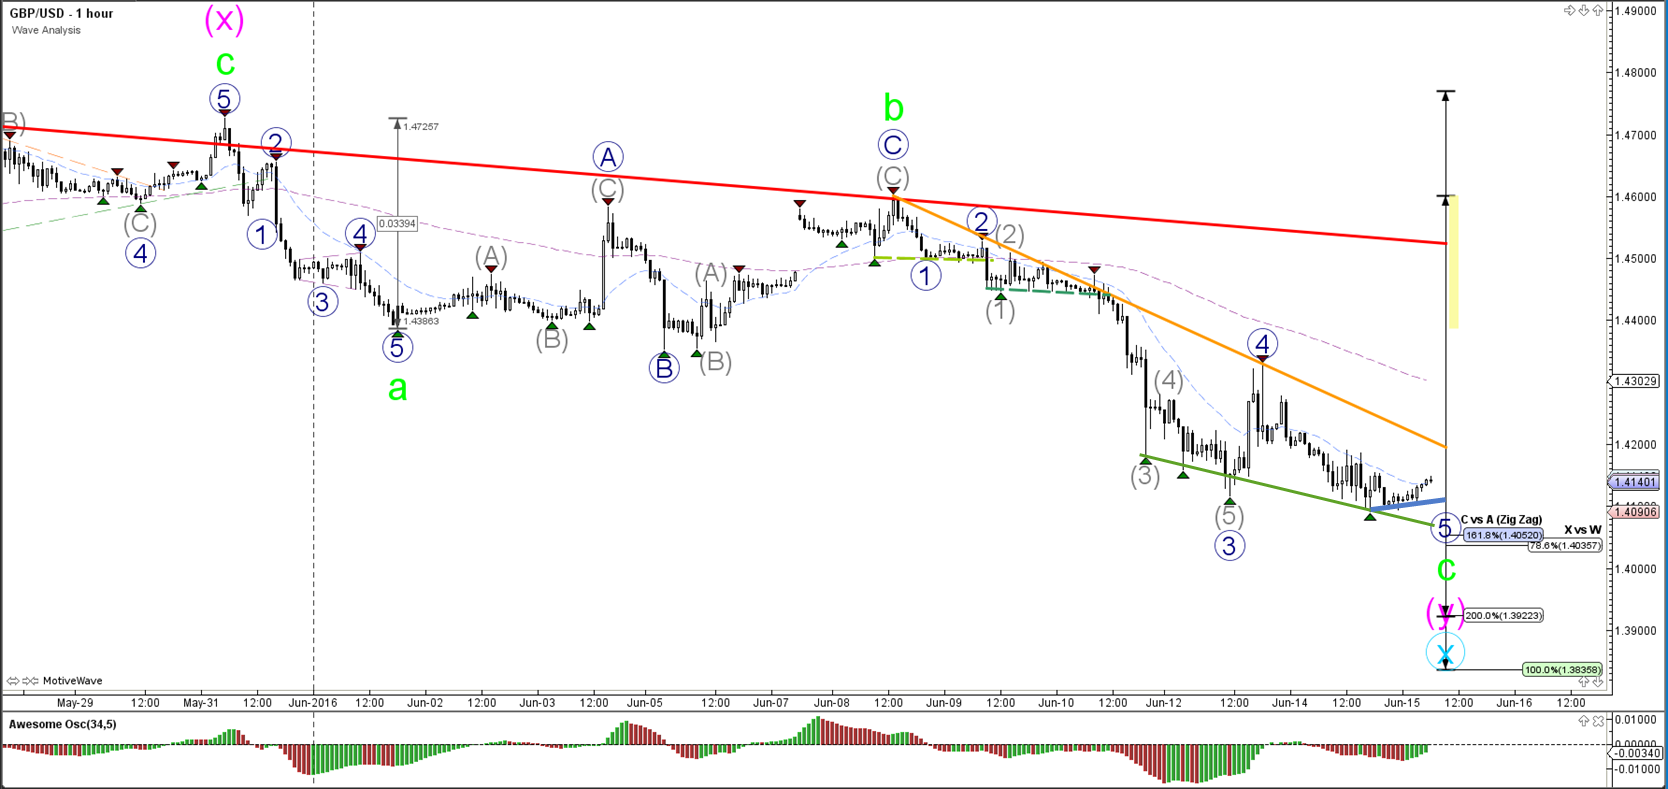
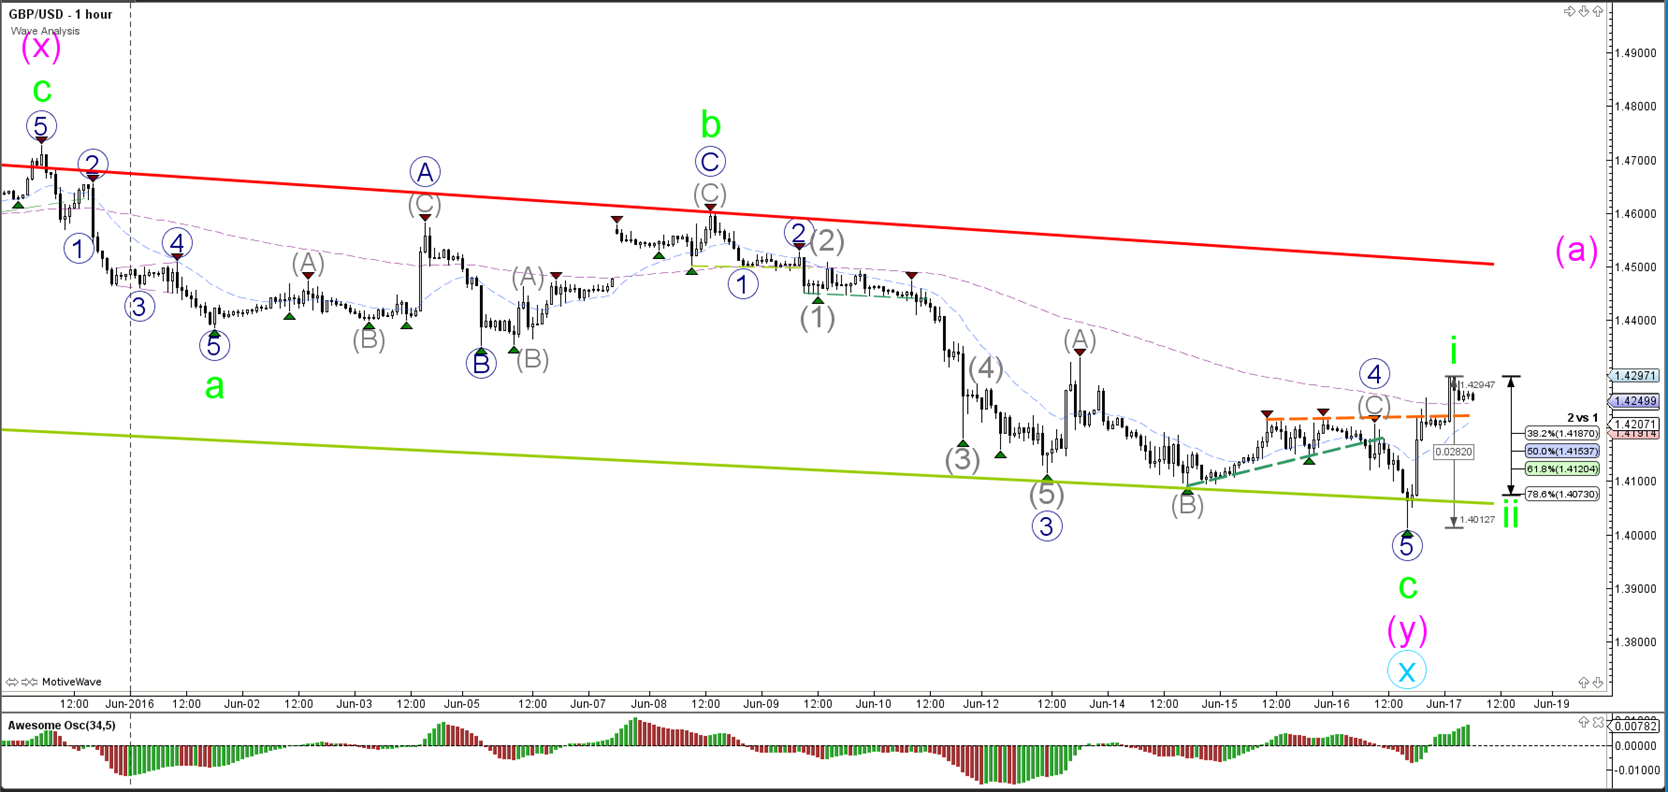
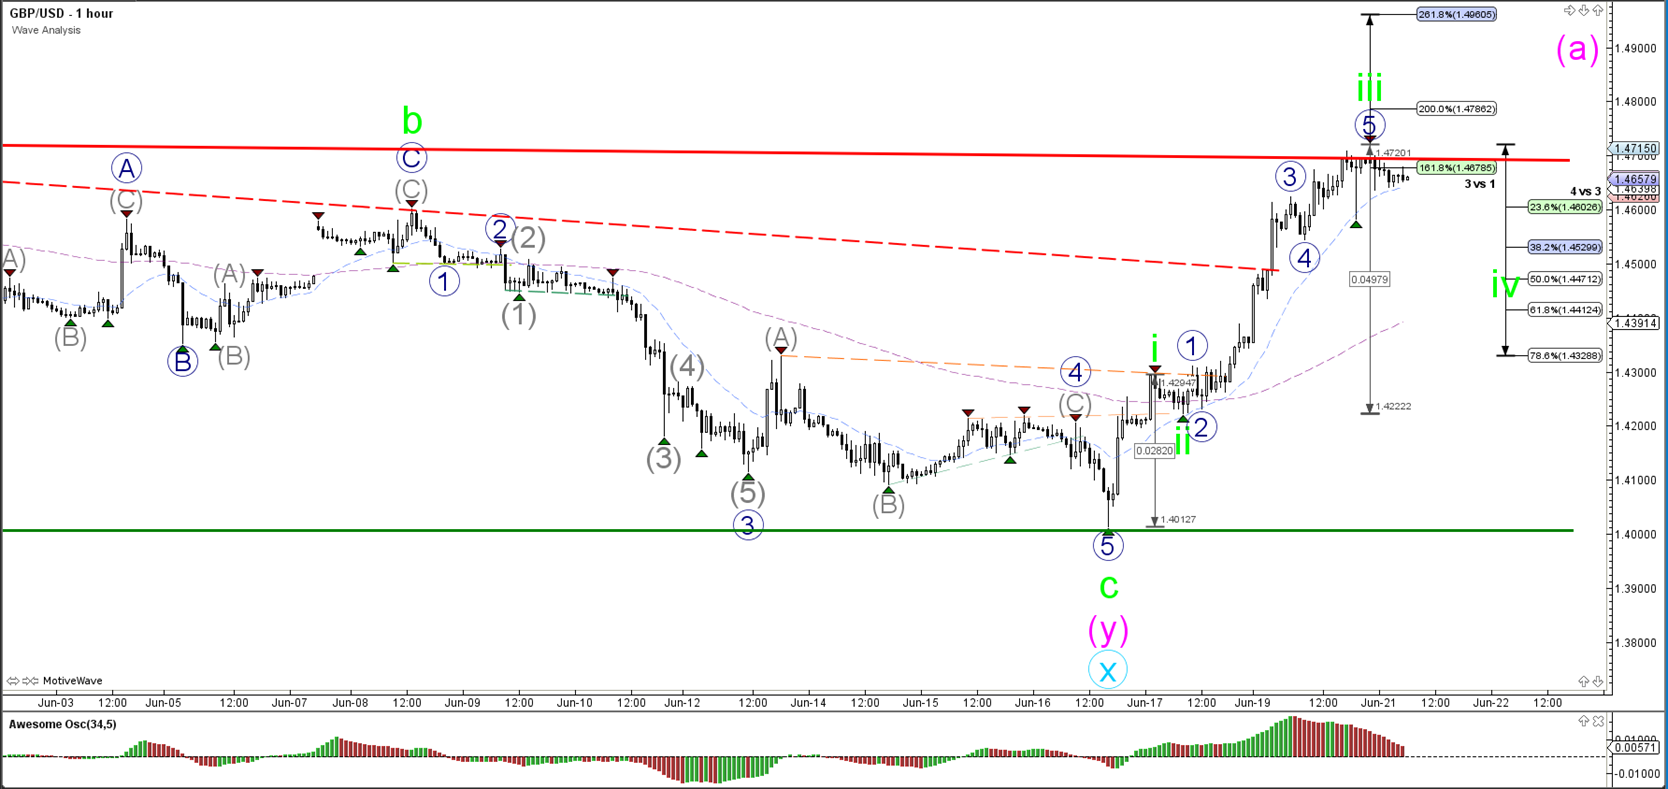
The GBP/USD broke the support of the normally bullish falling wedge chart pattern. The bearish momentum saw price accelerate quickly towards the Fibonacci levels. Price seems to be in a spot where it could make one more bearish fall for wave 5 (blue).
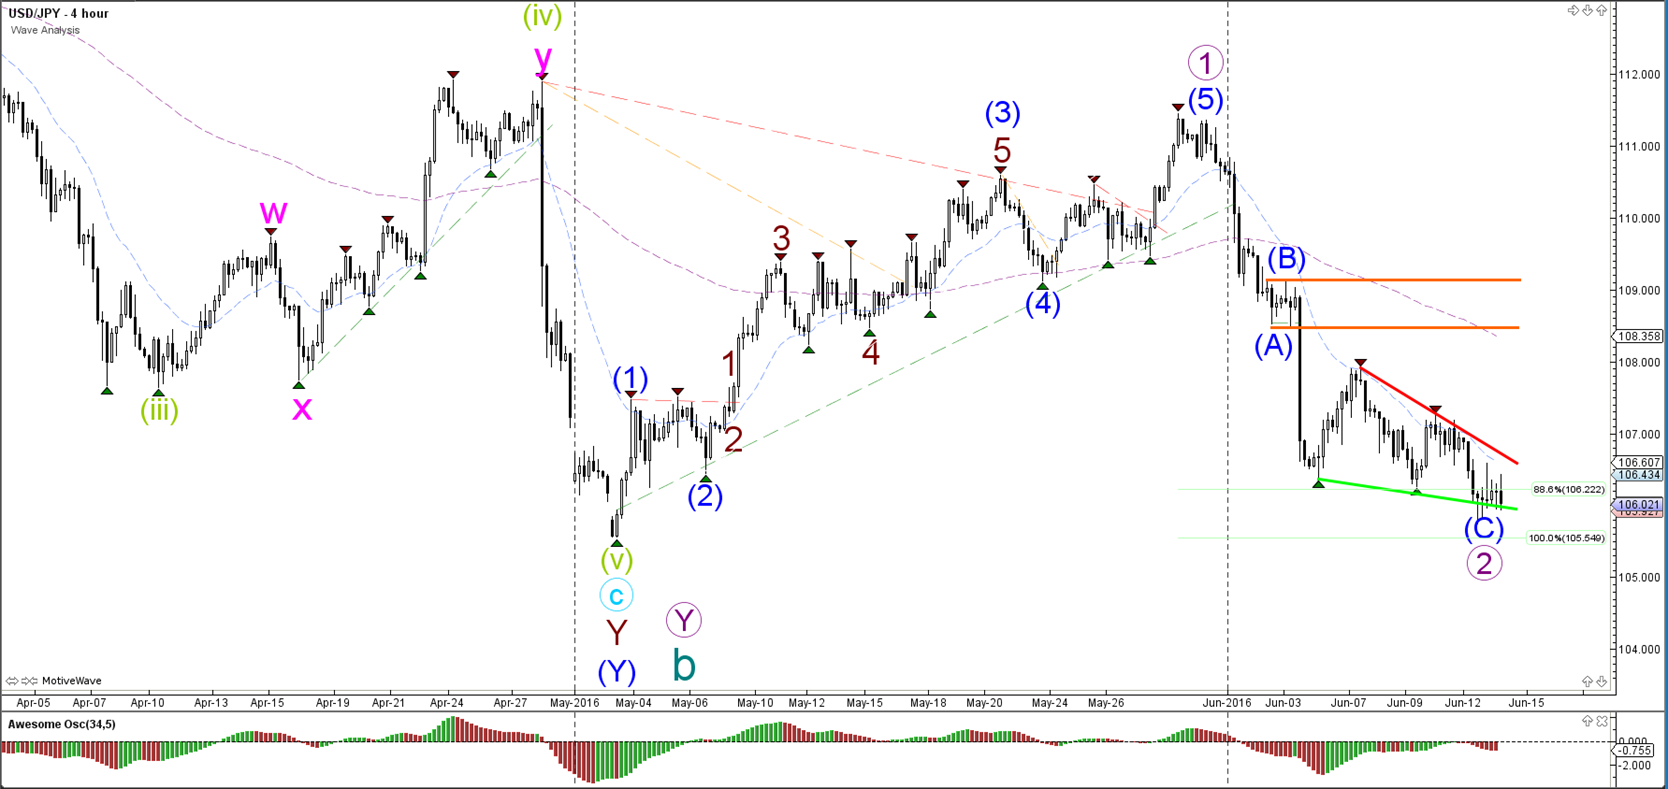
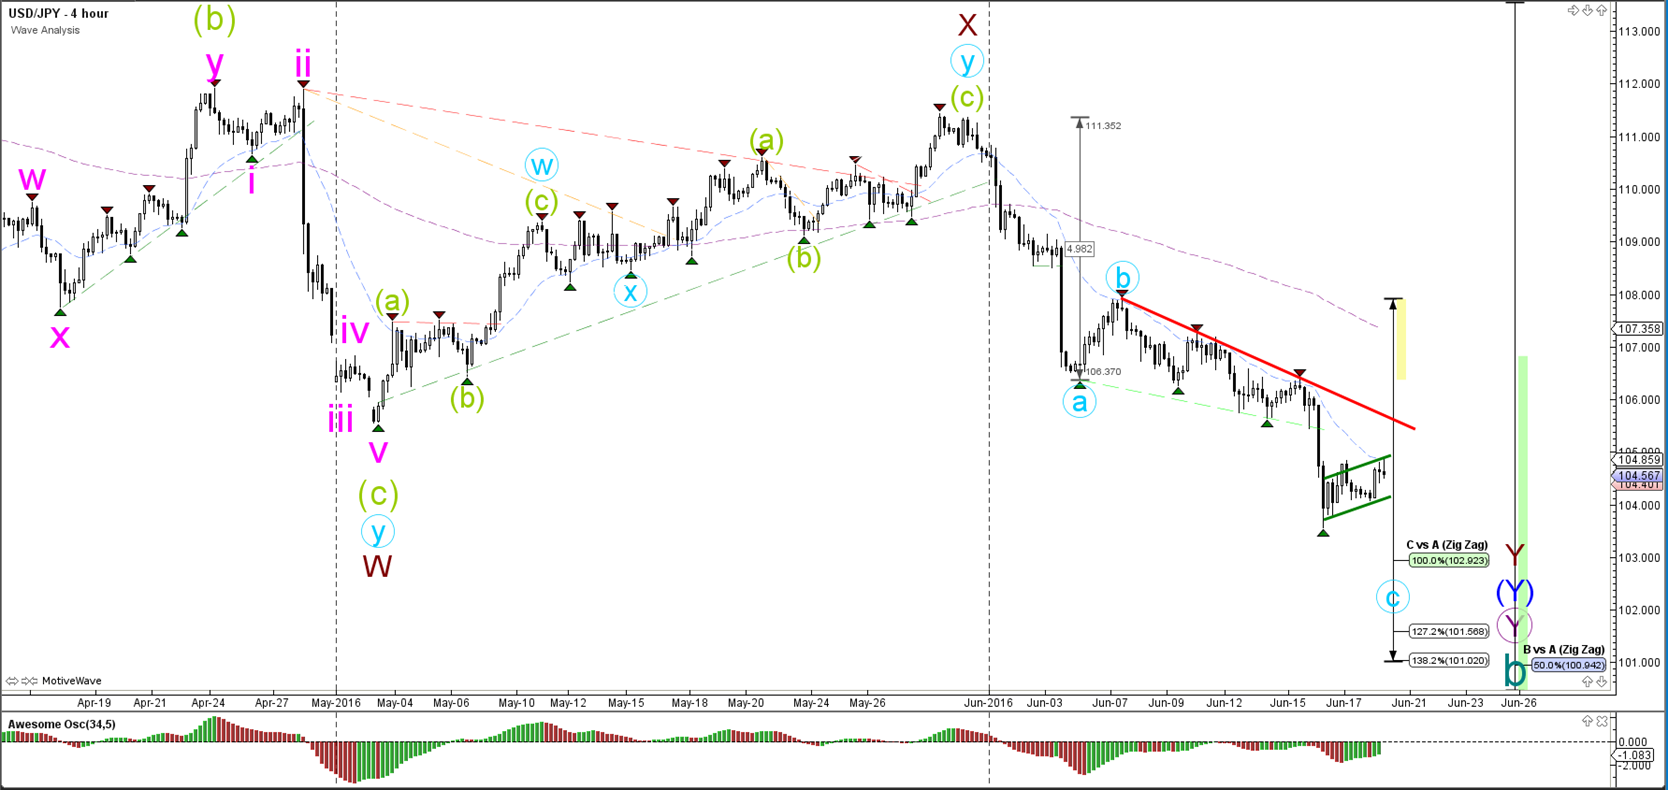
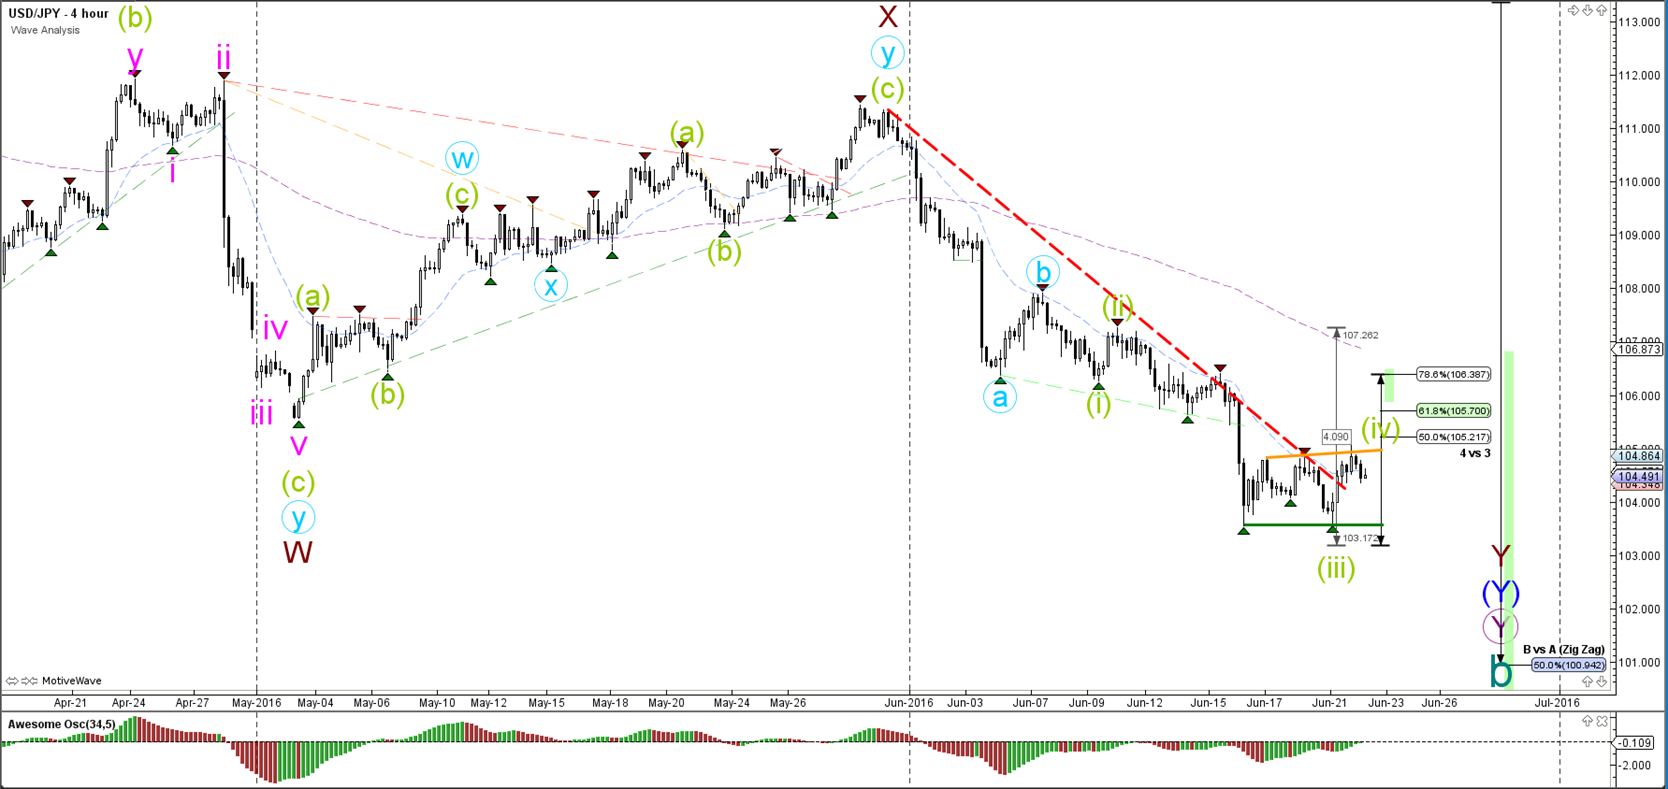
USD/JPY
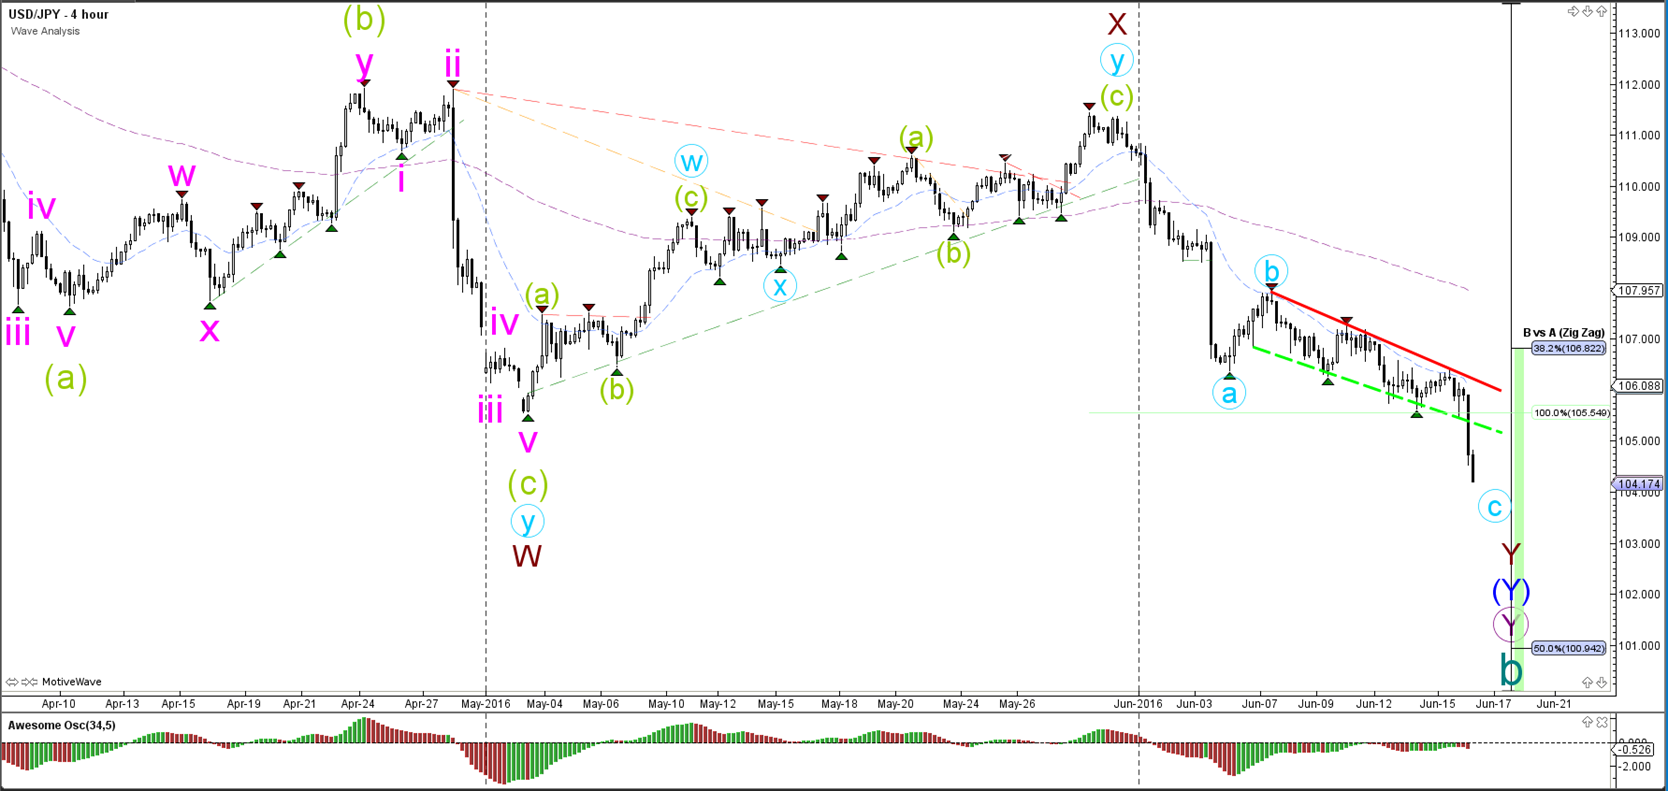
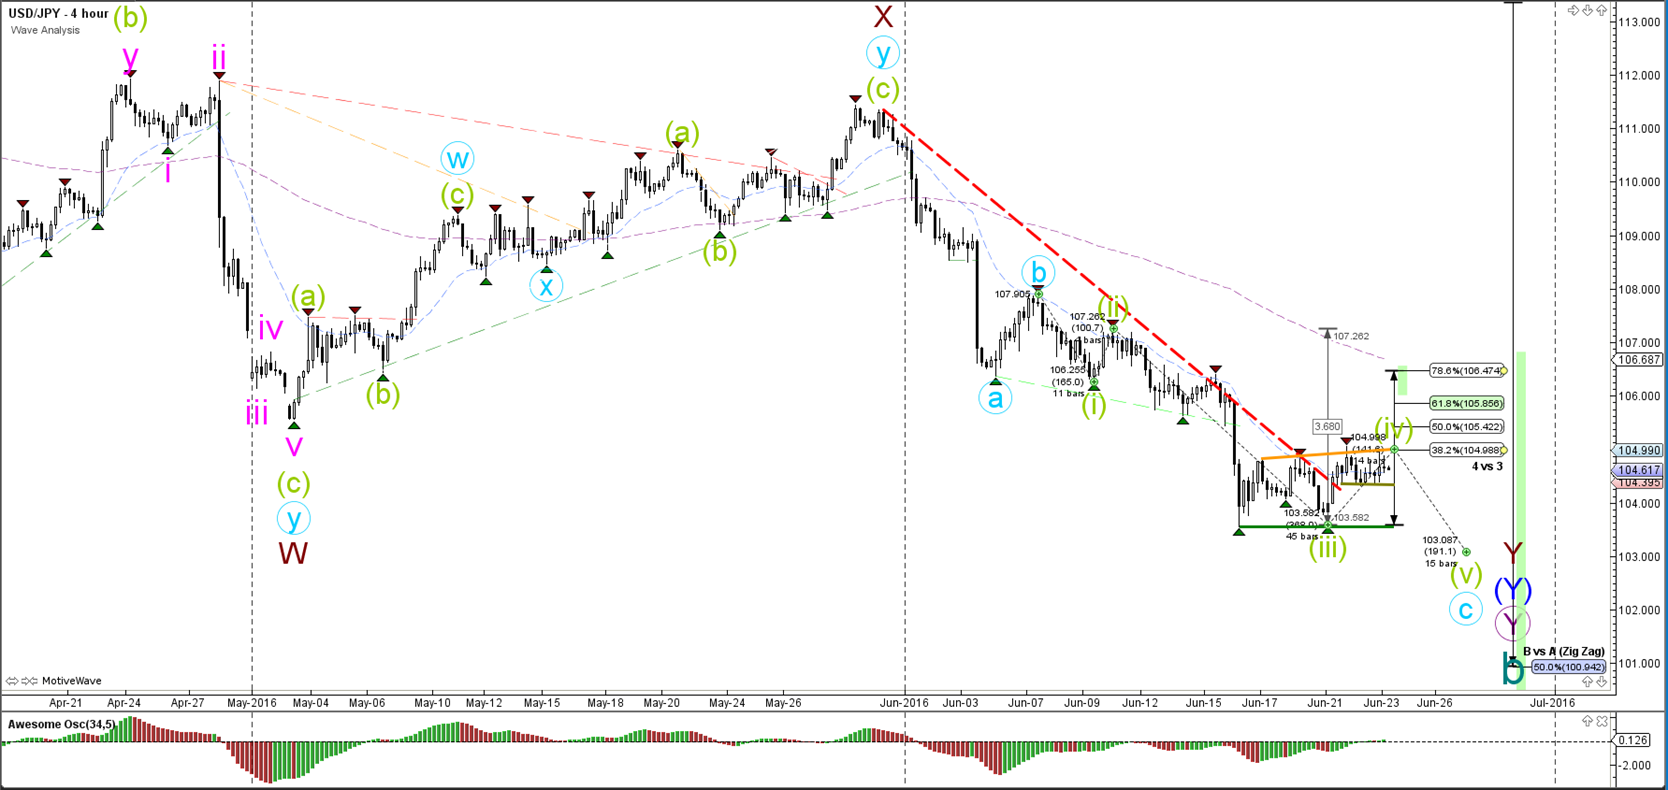
4 hour

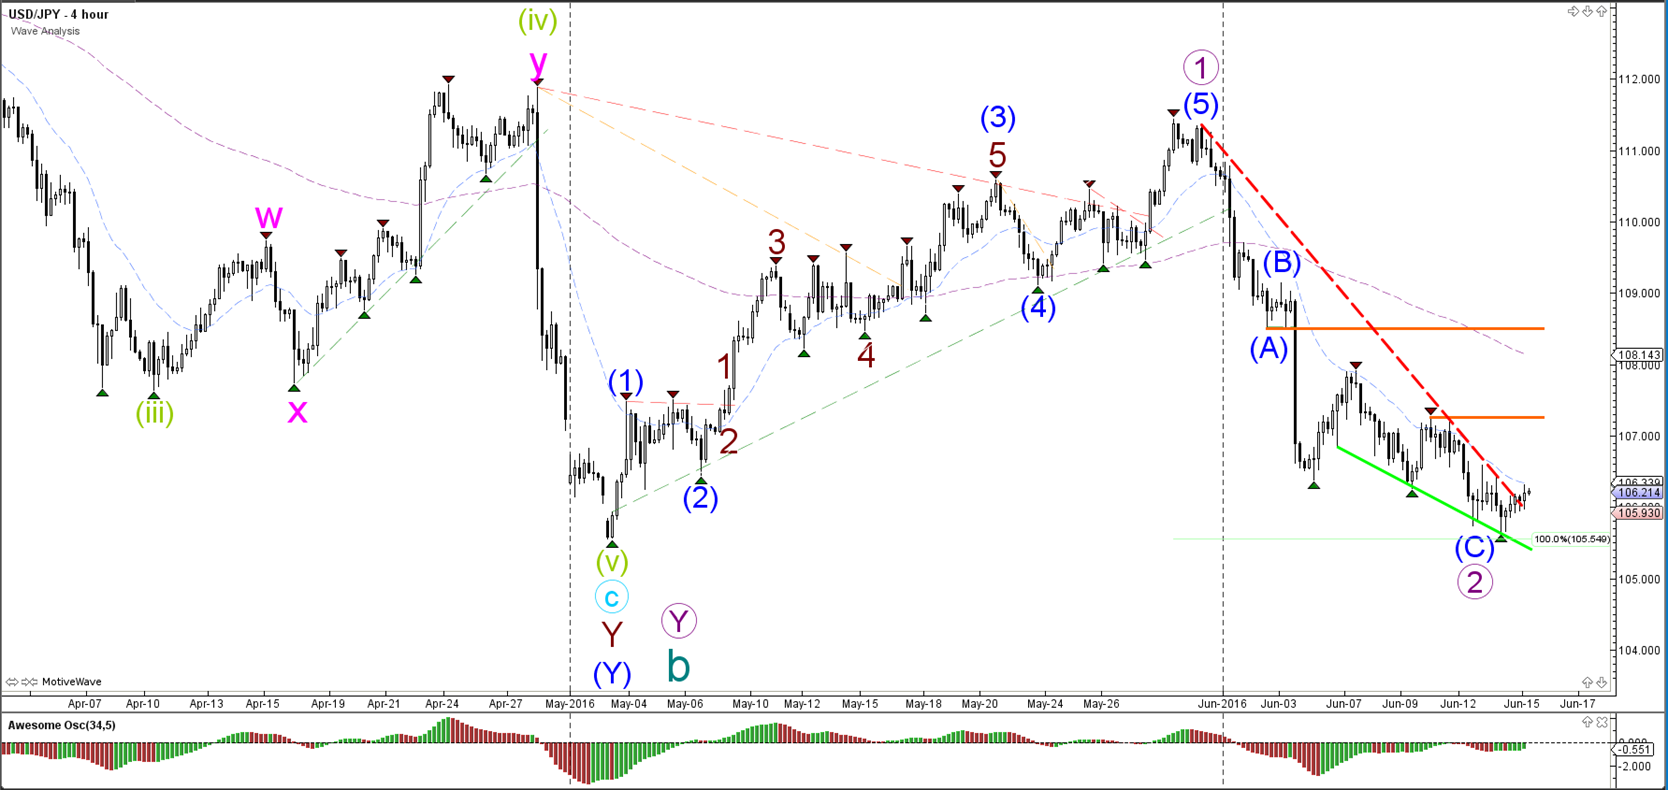
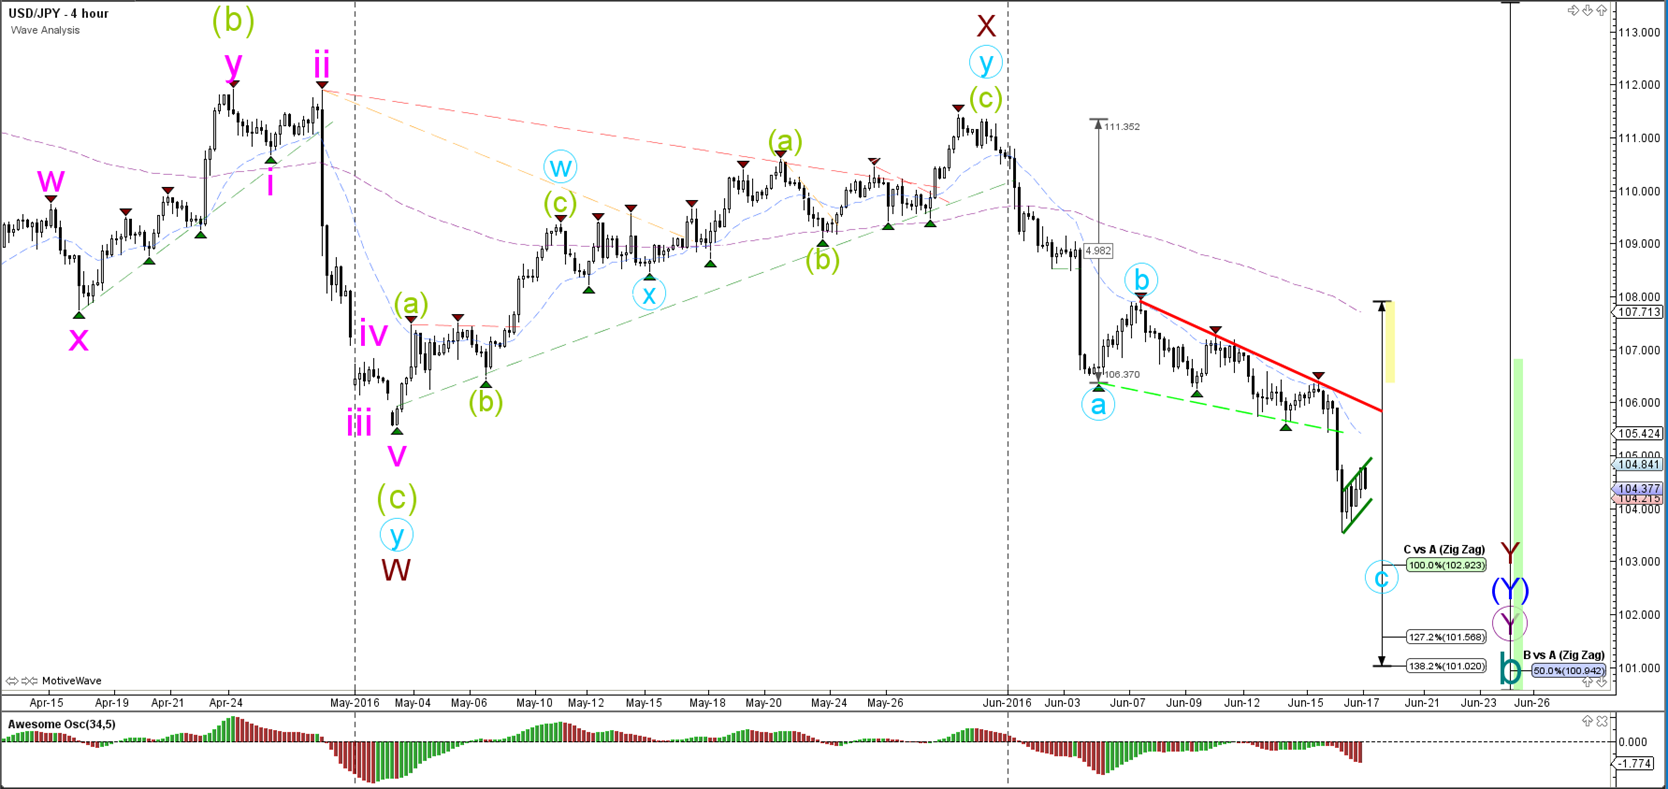
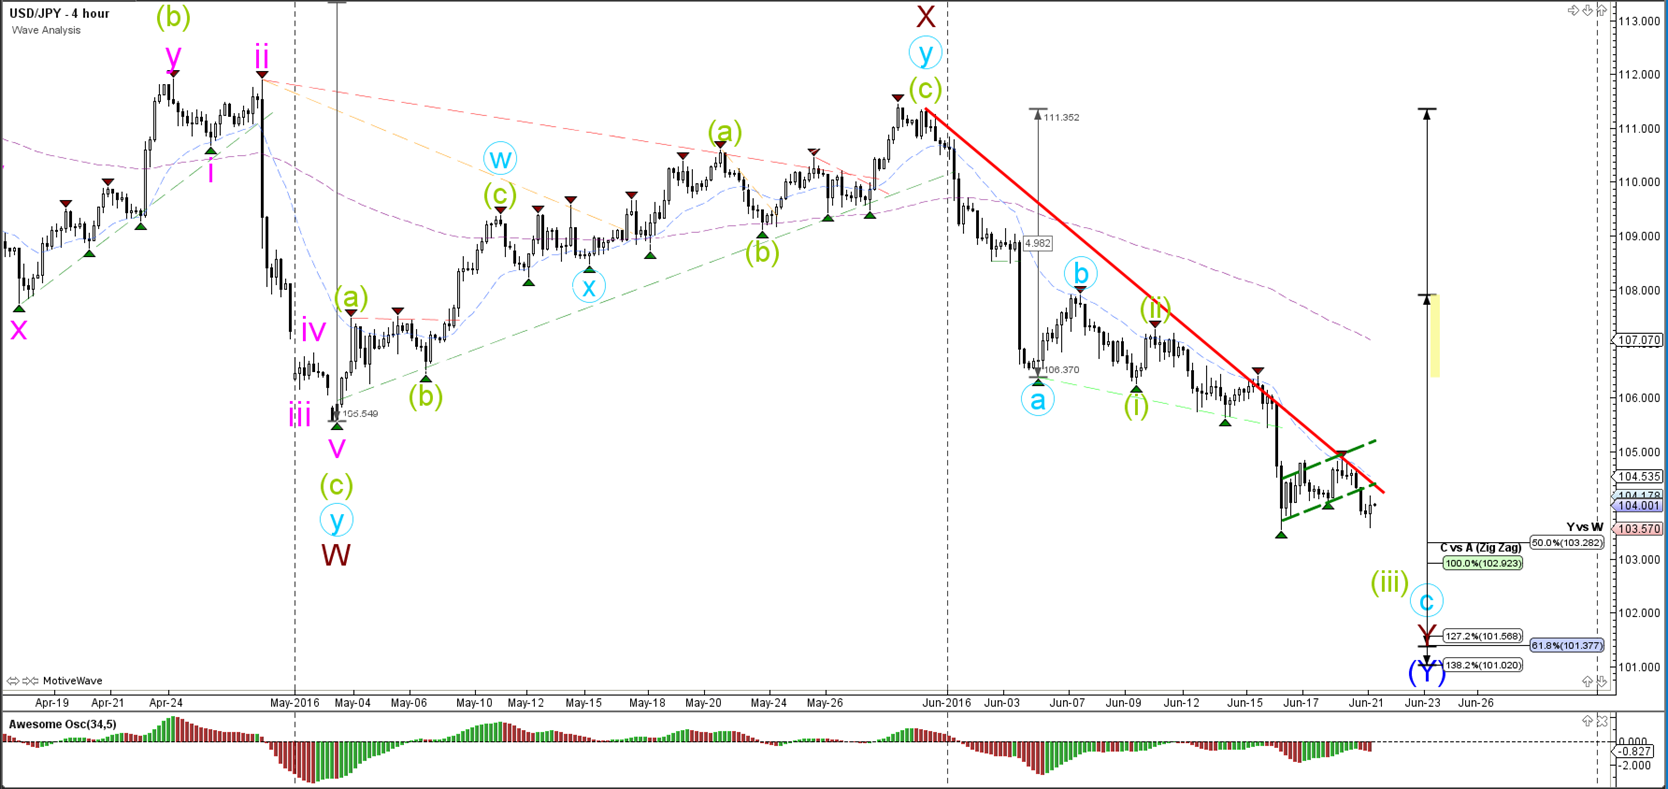
The USD/JPY is not able to show a strong bullish rally at the 88.6% Fibonacci level either. A break below the 100% level invalidates the wave 1-2 (purple) structure.
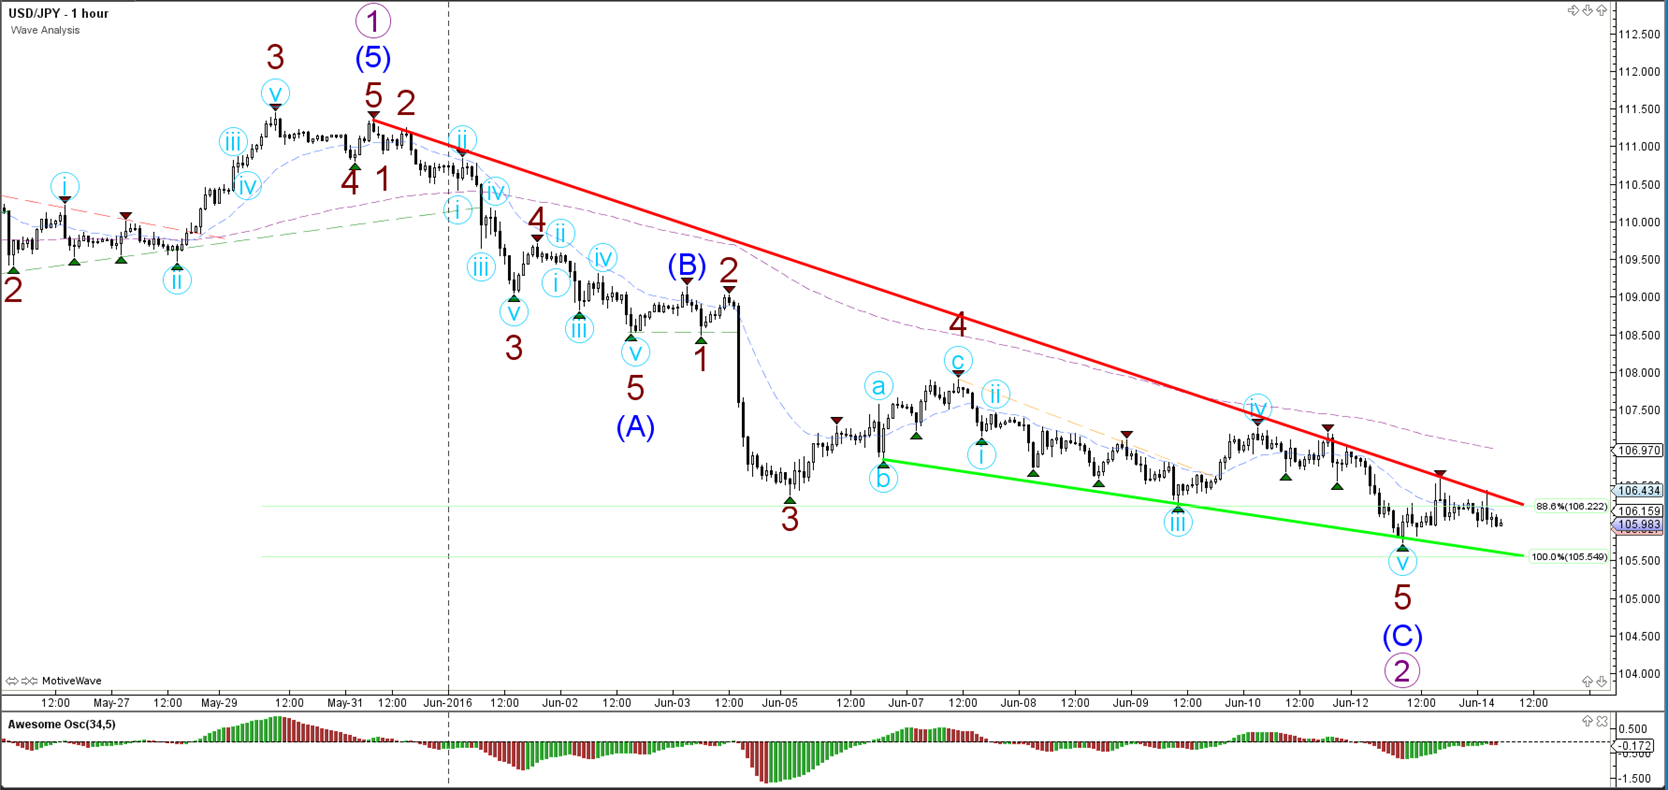
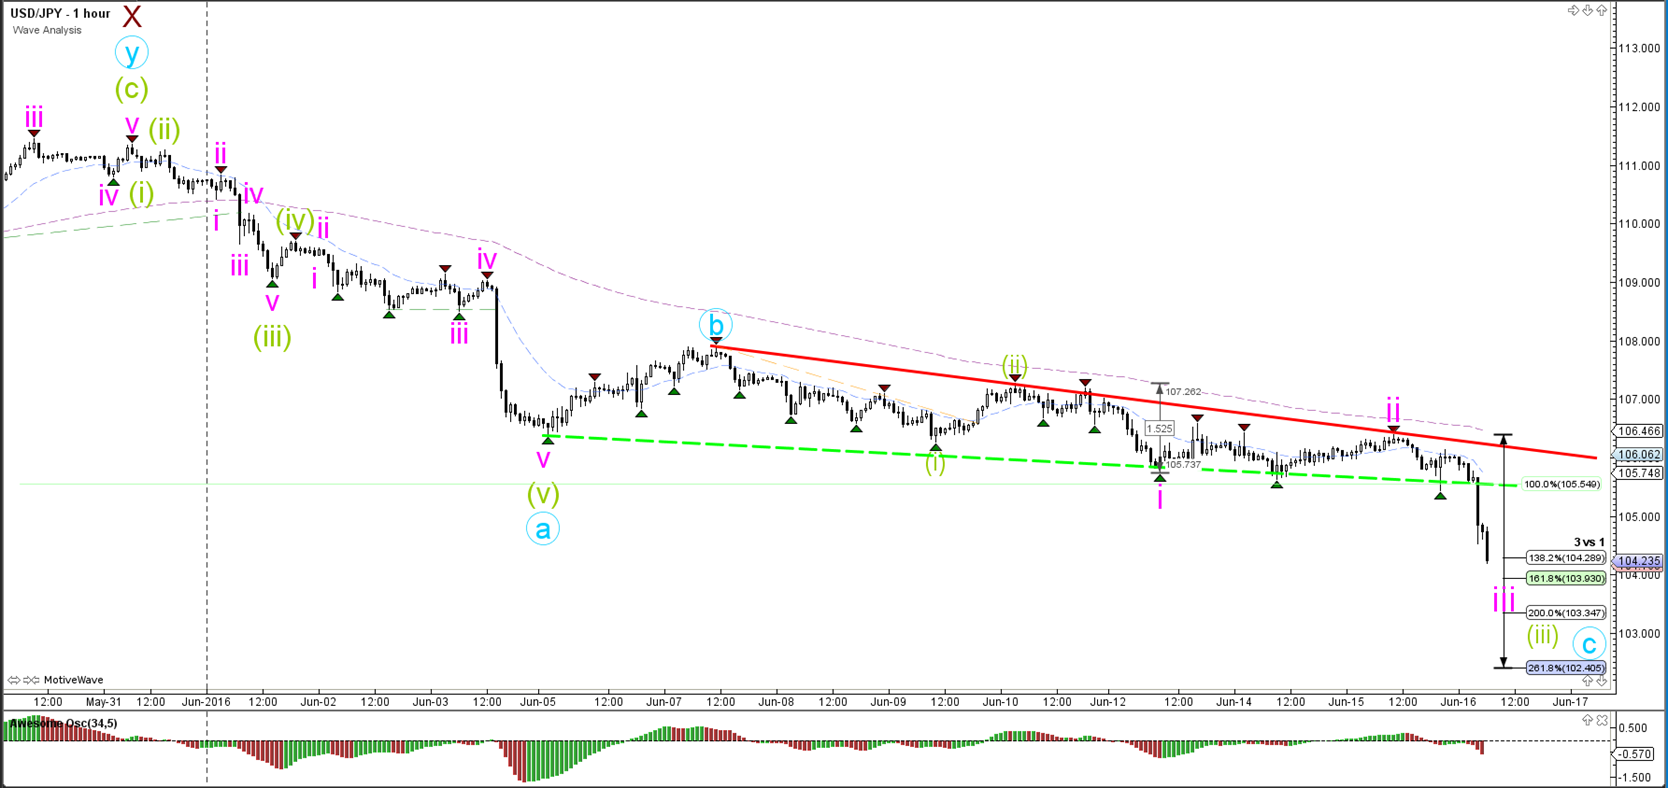
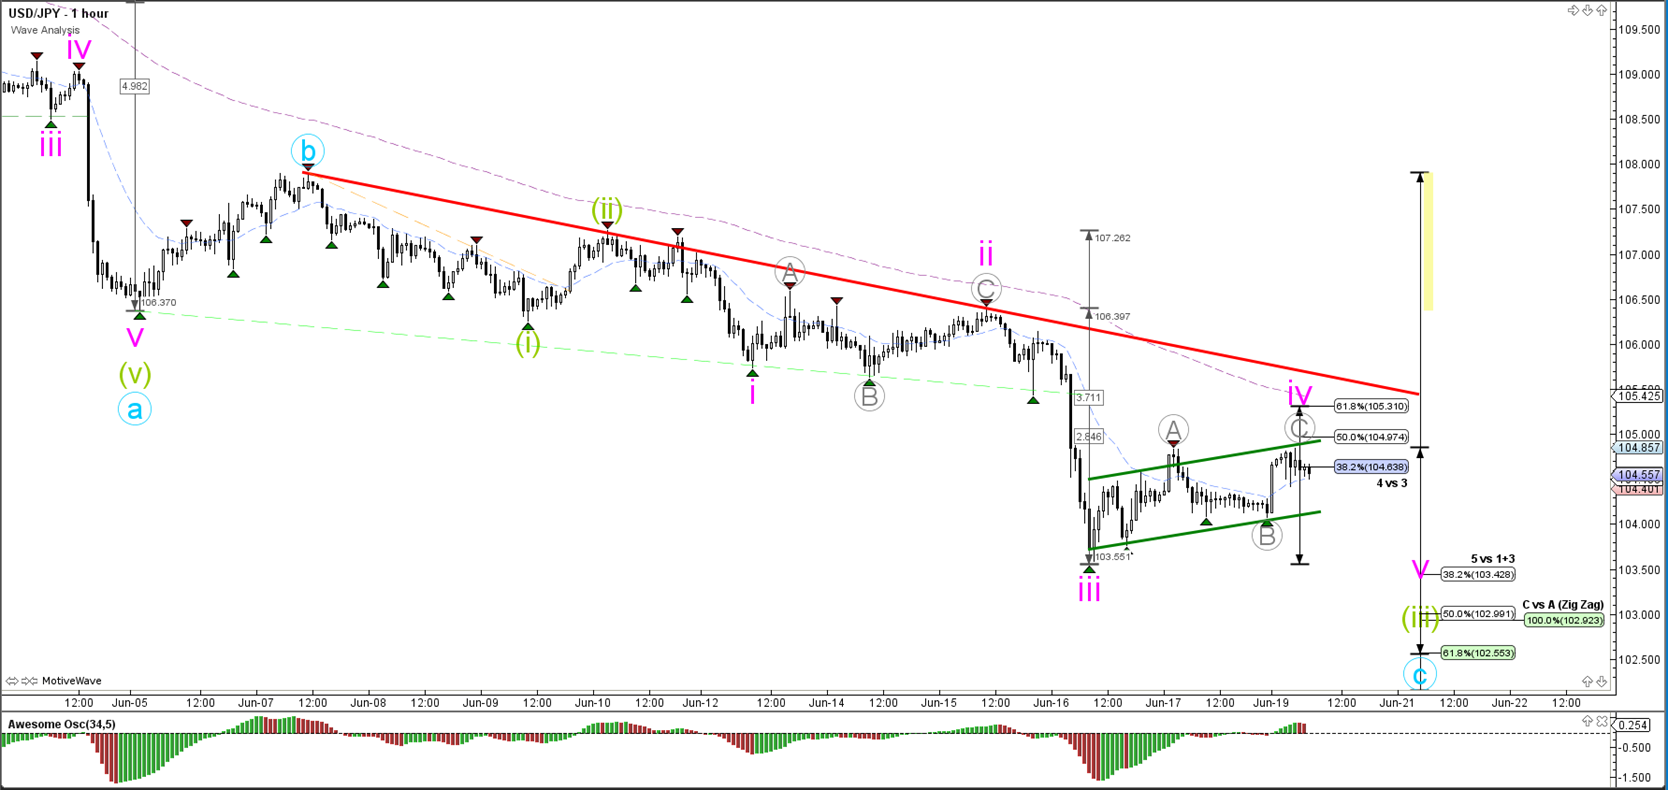
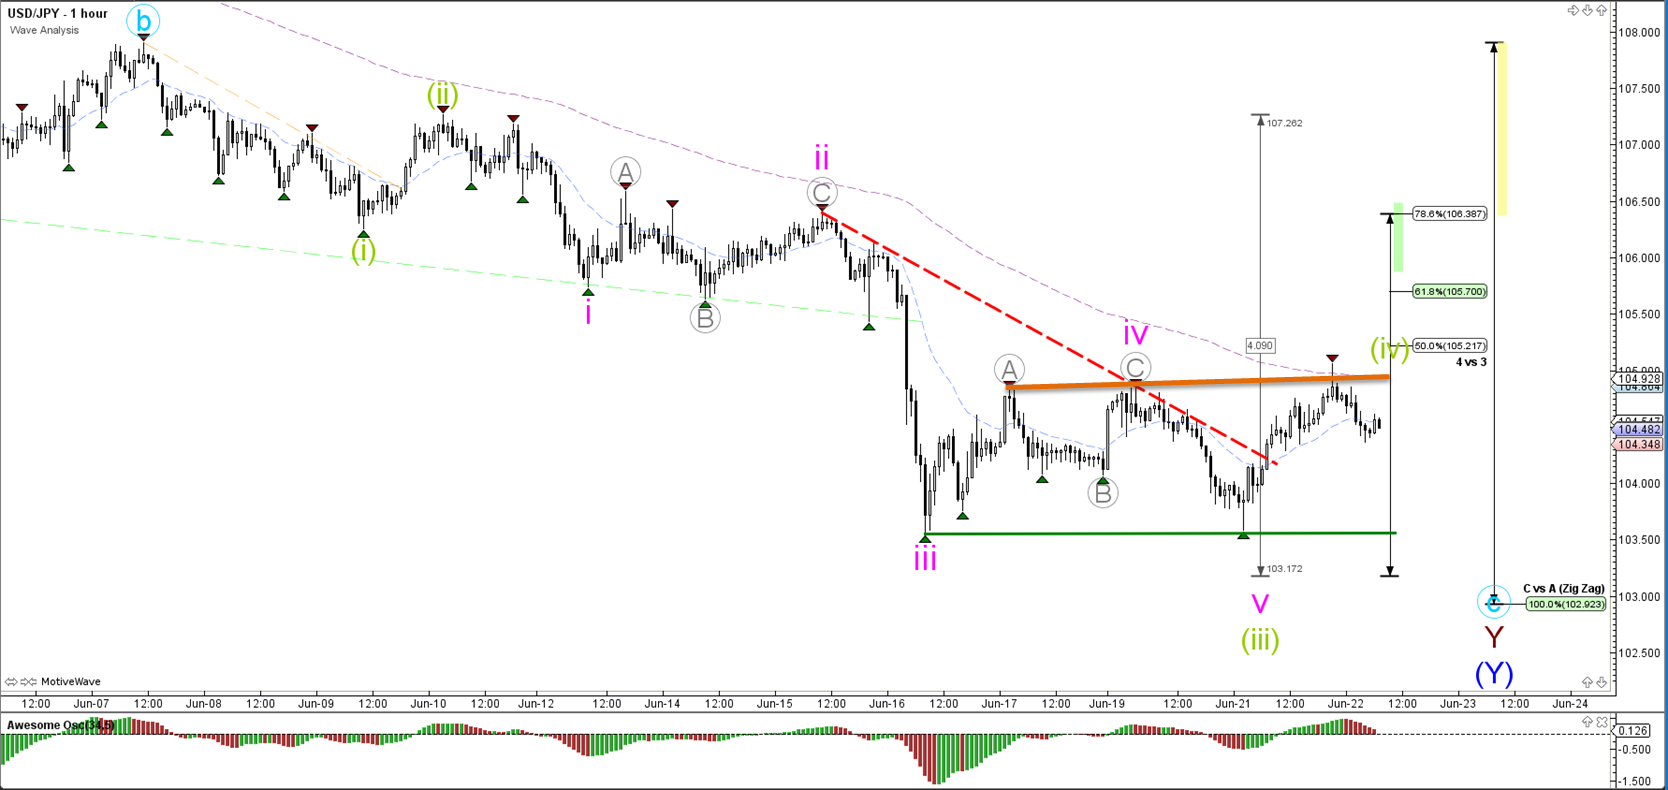
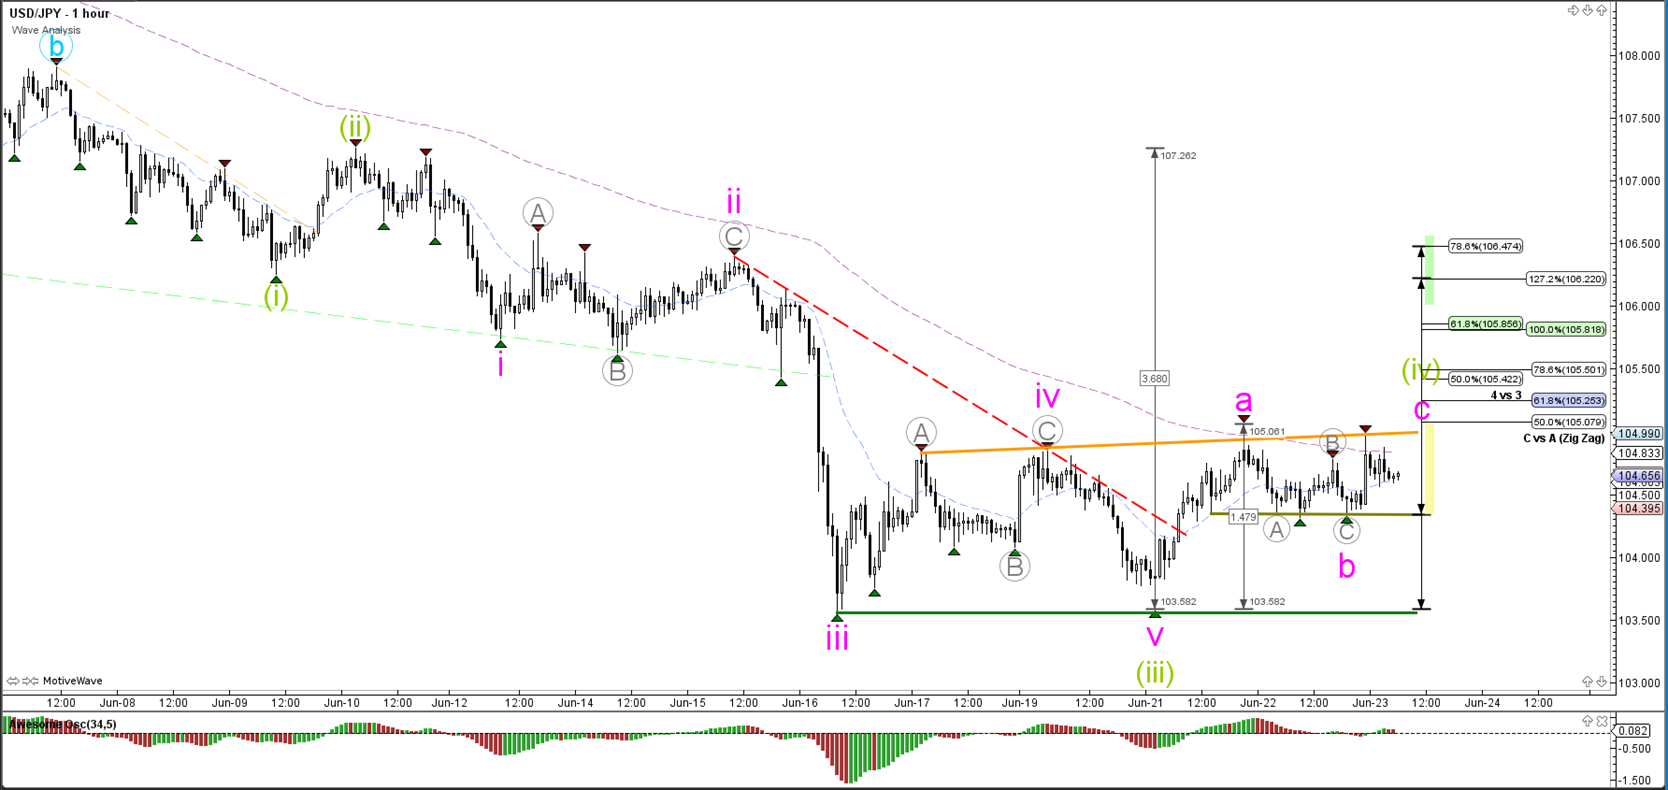
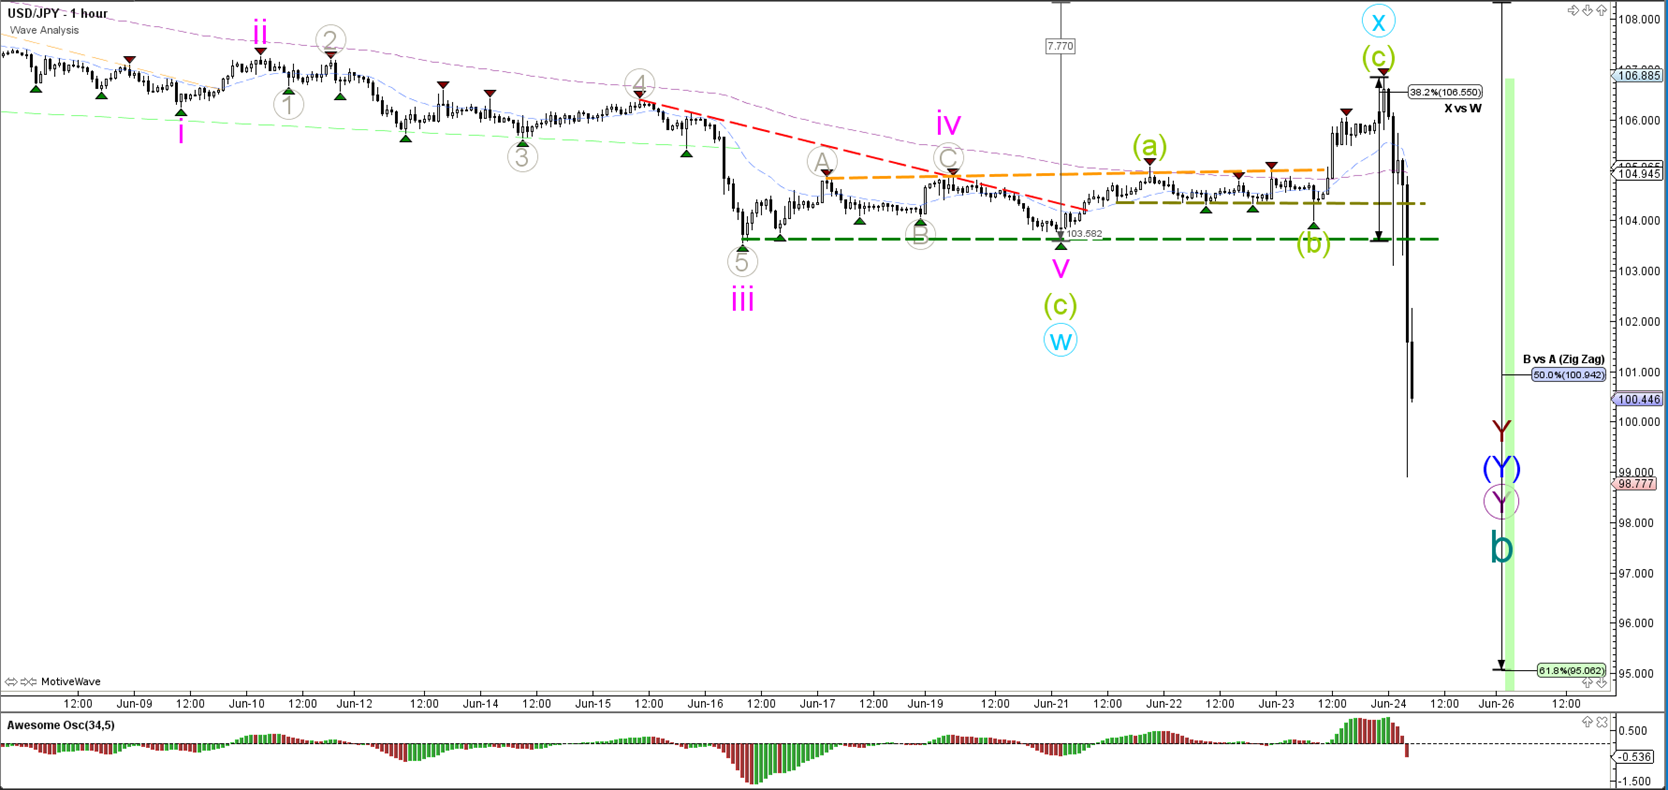
1 hour

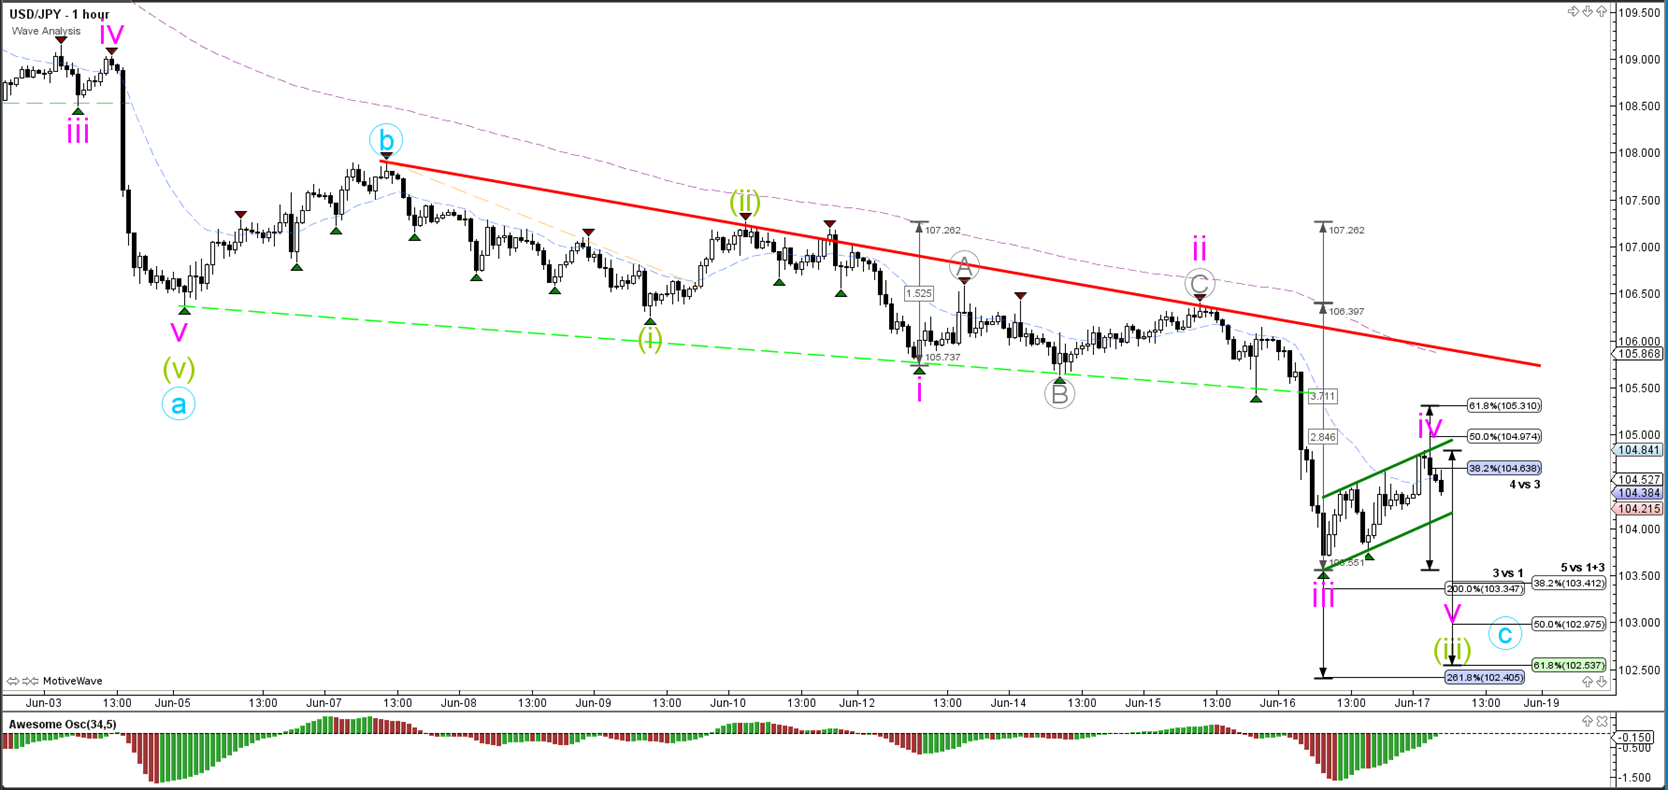
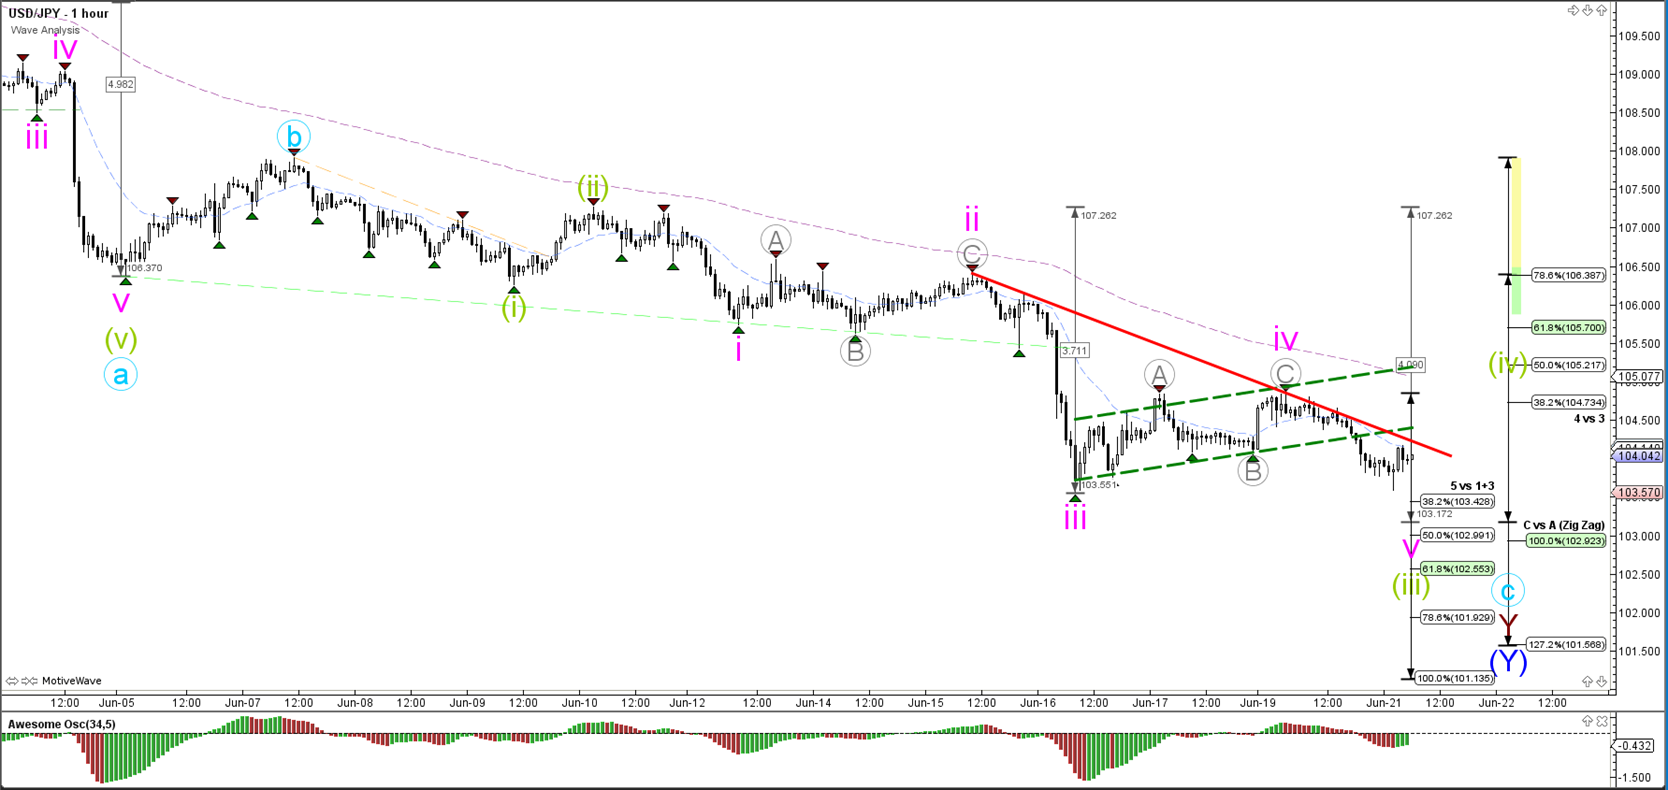
The USD/JPY is testing a support trend line (green). A break below it could see price challenge the 100% Fib level of the 4 hour chart. A break above resistance could start a reversal.
“Original analysis is provided by Admiral Markets”
EUR/USD
4 hour
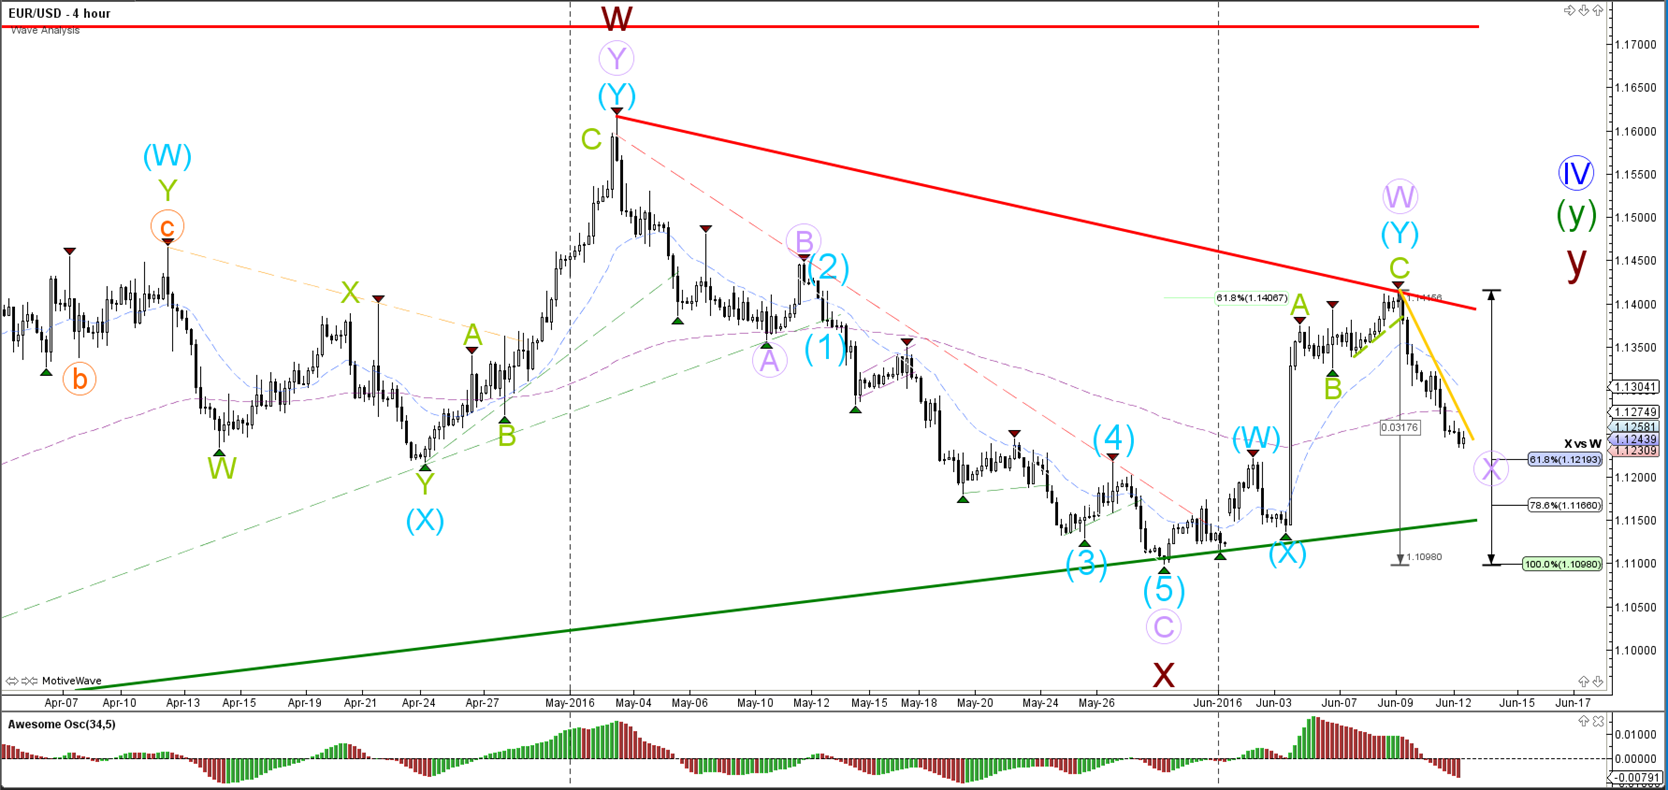
The current bearish momentum has been marked as a retracement for a wave X (purple), but this wave structure is invalidated if price manages to break below the long-term support trend line (green) and 100% Fibonacci level. The 61.8% and 78.6% Fibonacci retracement levels could become bullish bounce spots.
1 hour
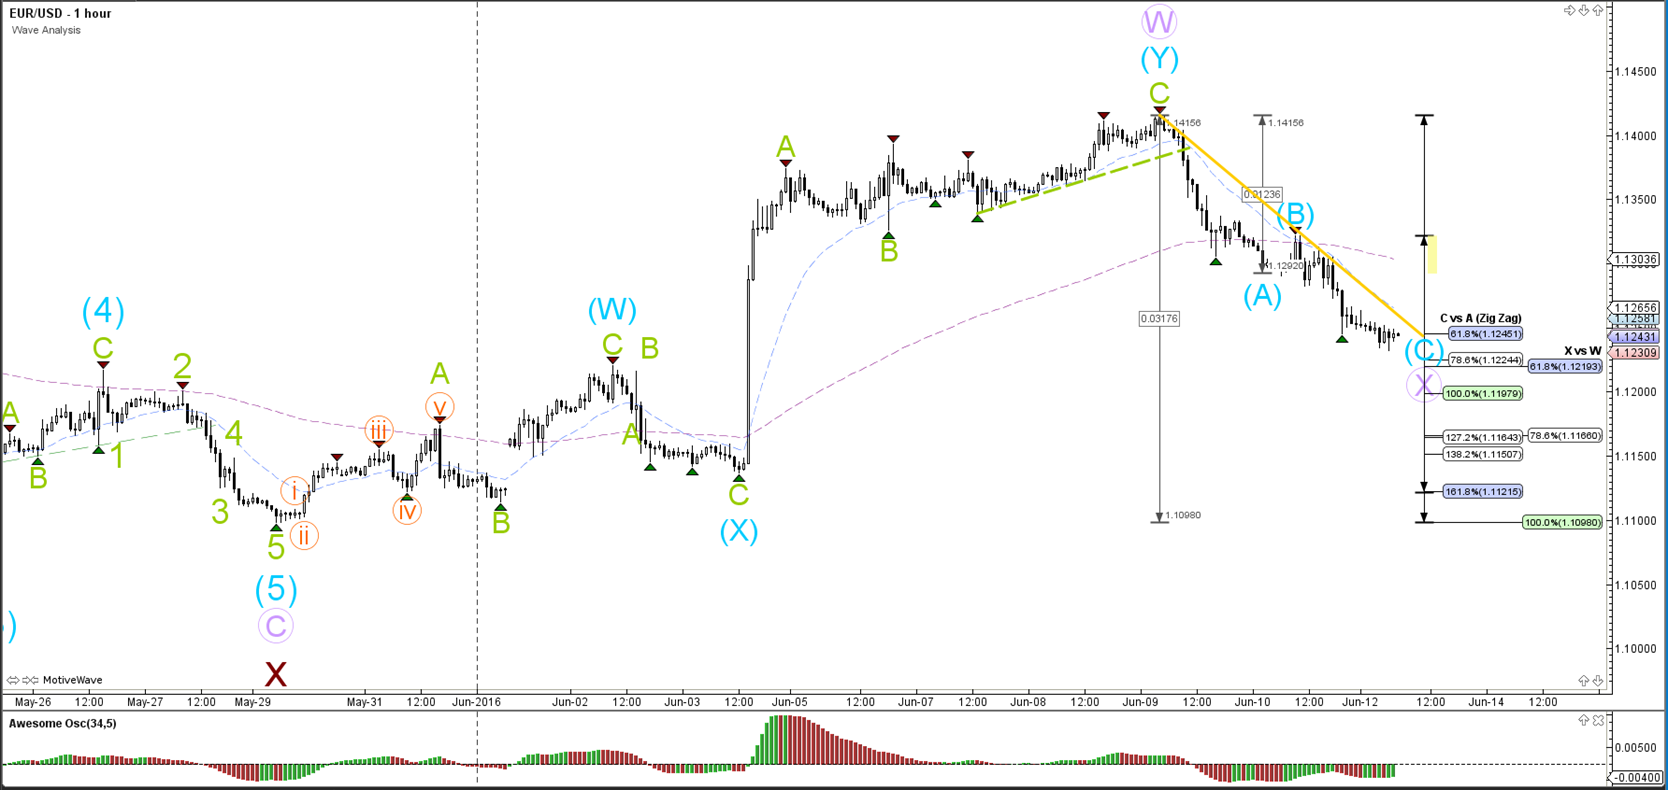
The EUR/USD bearish momentum seems to be building an ABC zigzag (blue) within wave X (purple).
GBP/USD
4 hour
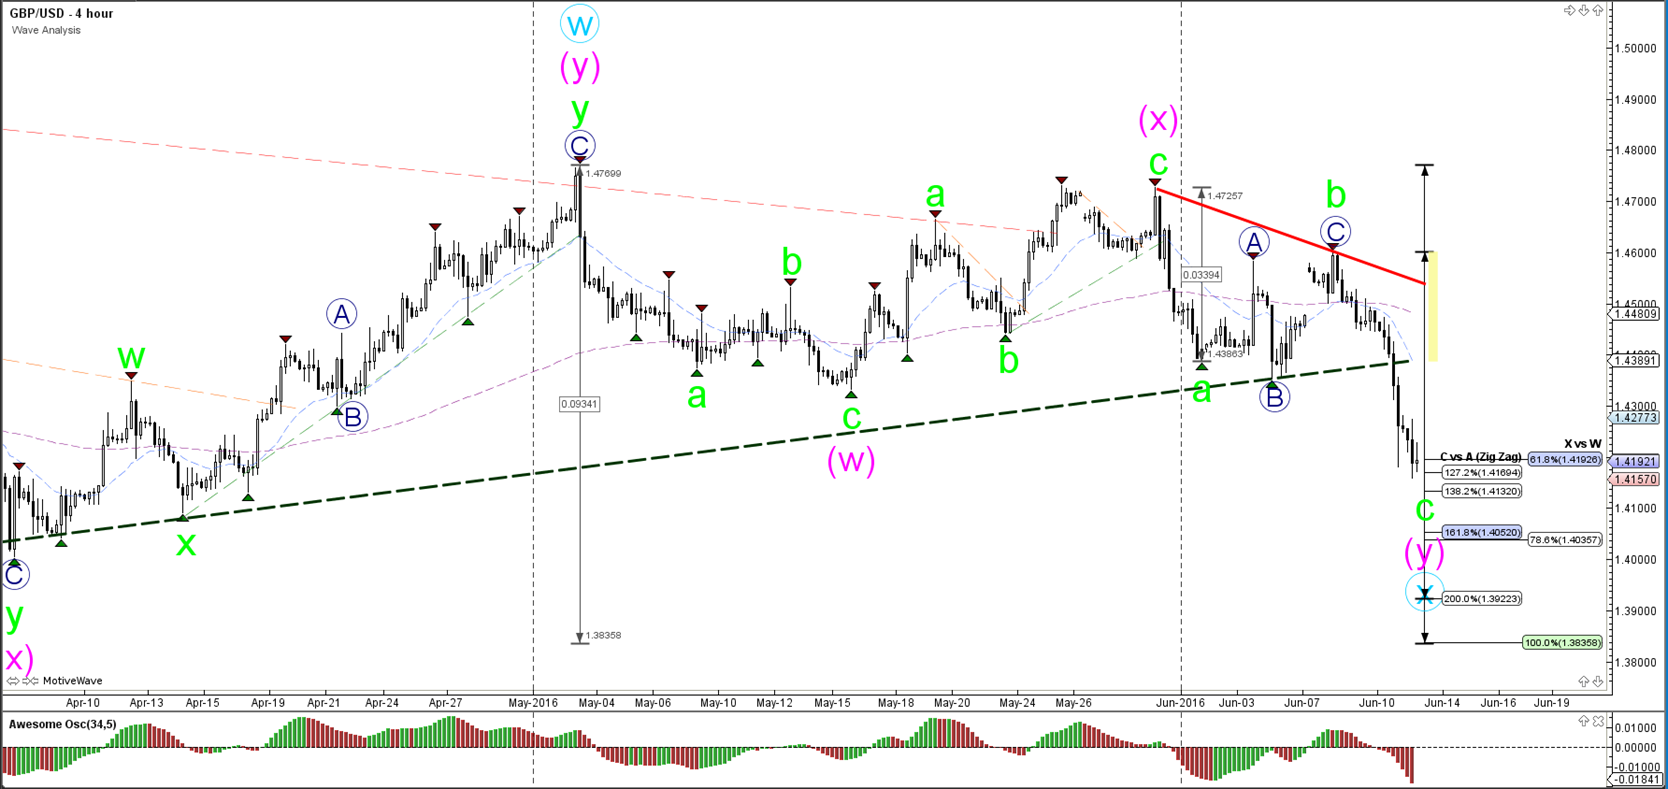
The GBP/USD broke below the support trend line (dotted green). For the moment price action remains marked as corrective unless price manages to break below the 161.8% target, which makes a 123 wave pattern more likely than the current ABC (green).
1 hour
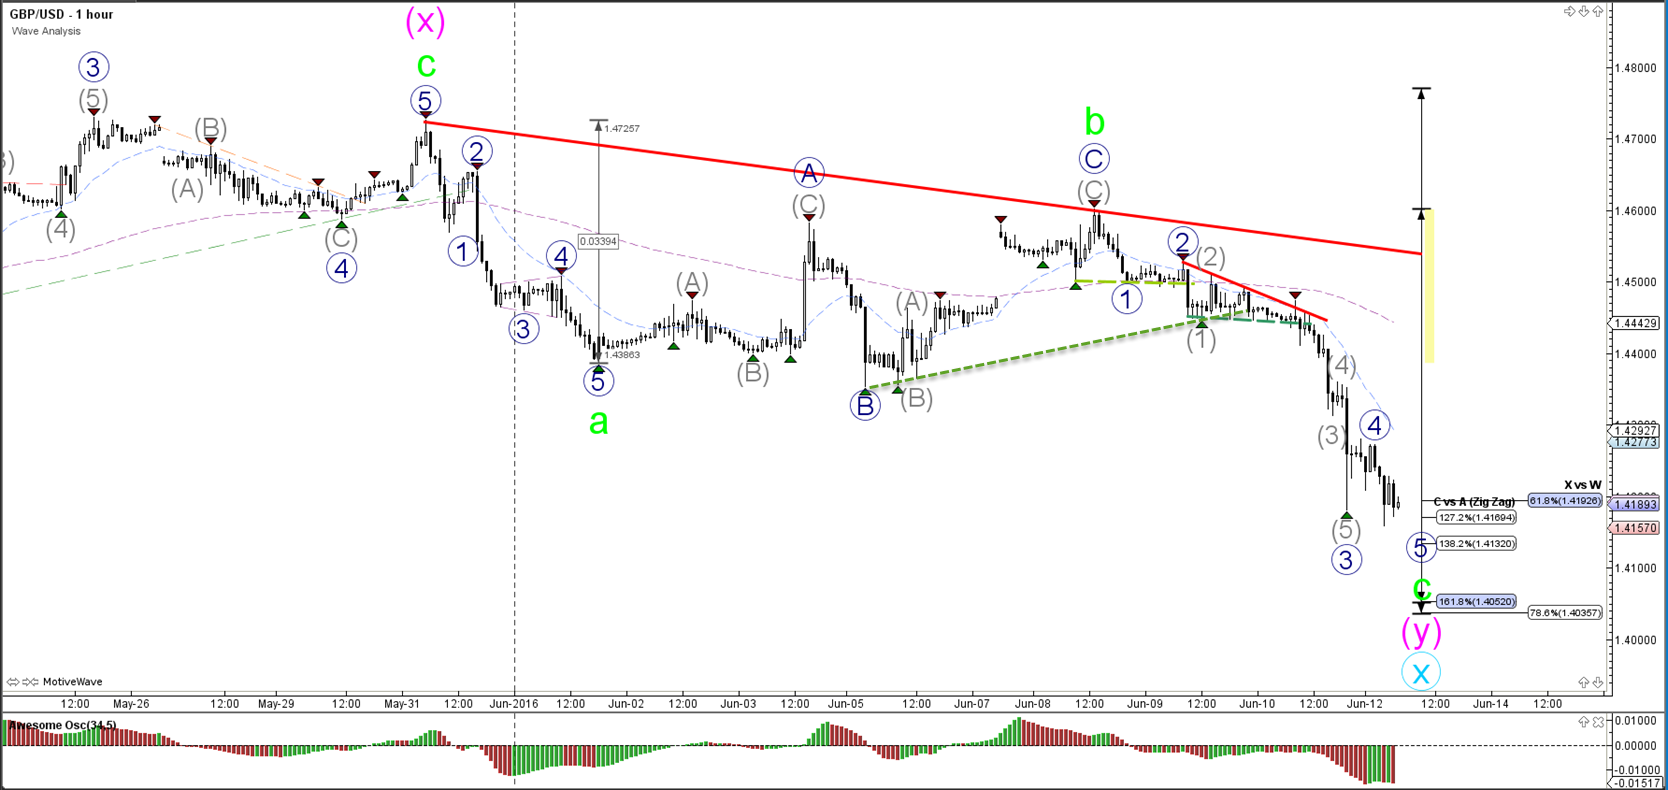
The GBP/USD broke the support of the normally bullish falling wedge chart pattern. The bearish momentum saw price accelerate quickly towards the Fibonacci levels. Price seems to be in a spot where it could make one more bearish fall for wave 5 (blue).
USD/JPY
4 hour
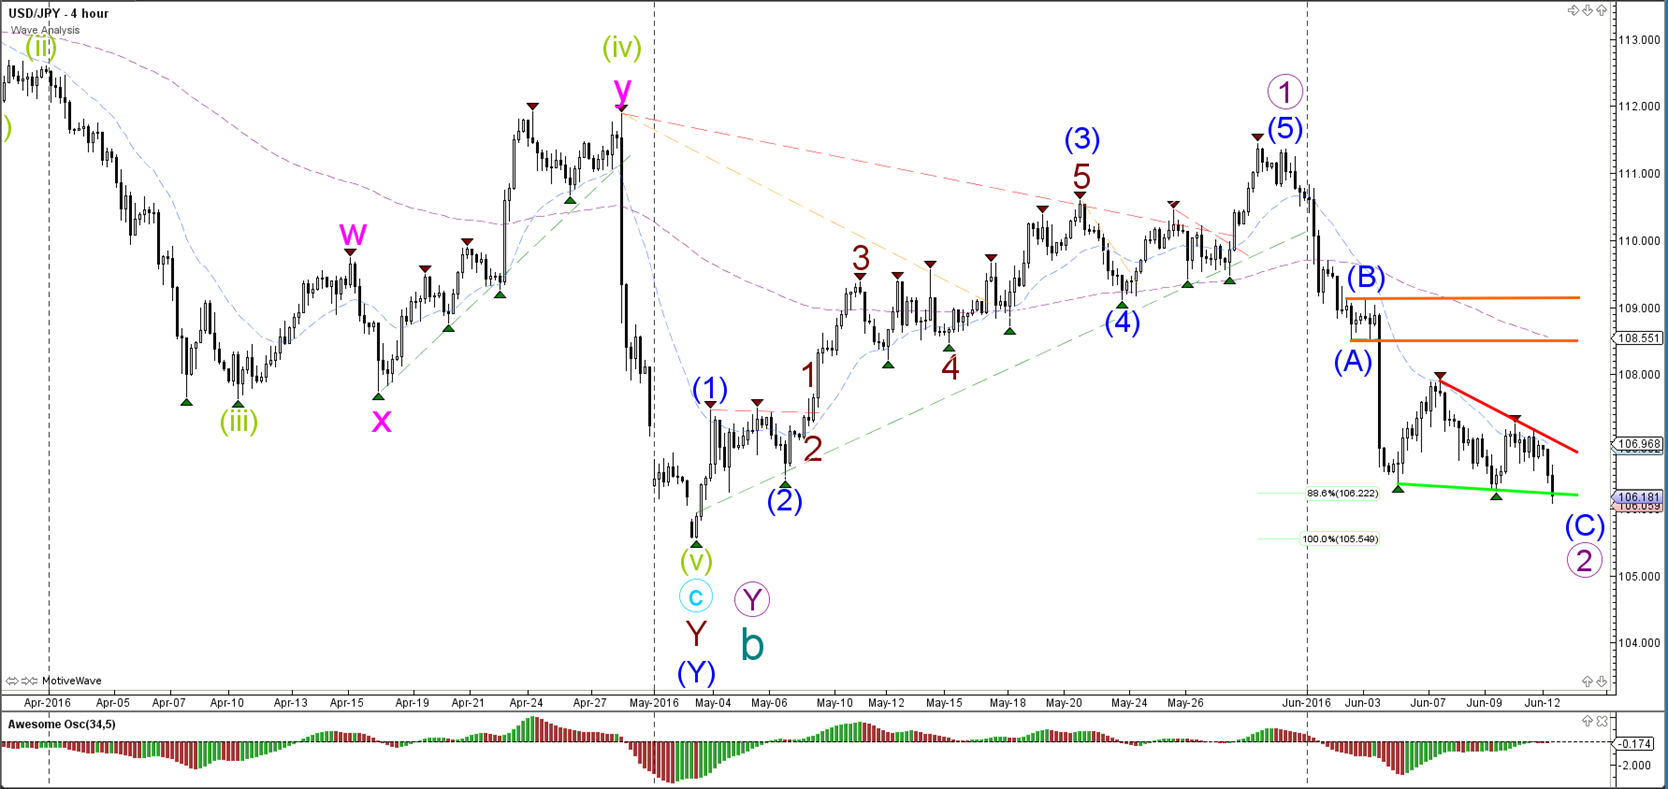
The USD/JPY is not able to show a strong bullish rally at the 88.6% Fibonacci level either. A break below the 100% level invalidates the wave 1-2 (purple) structure.
1 hour
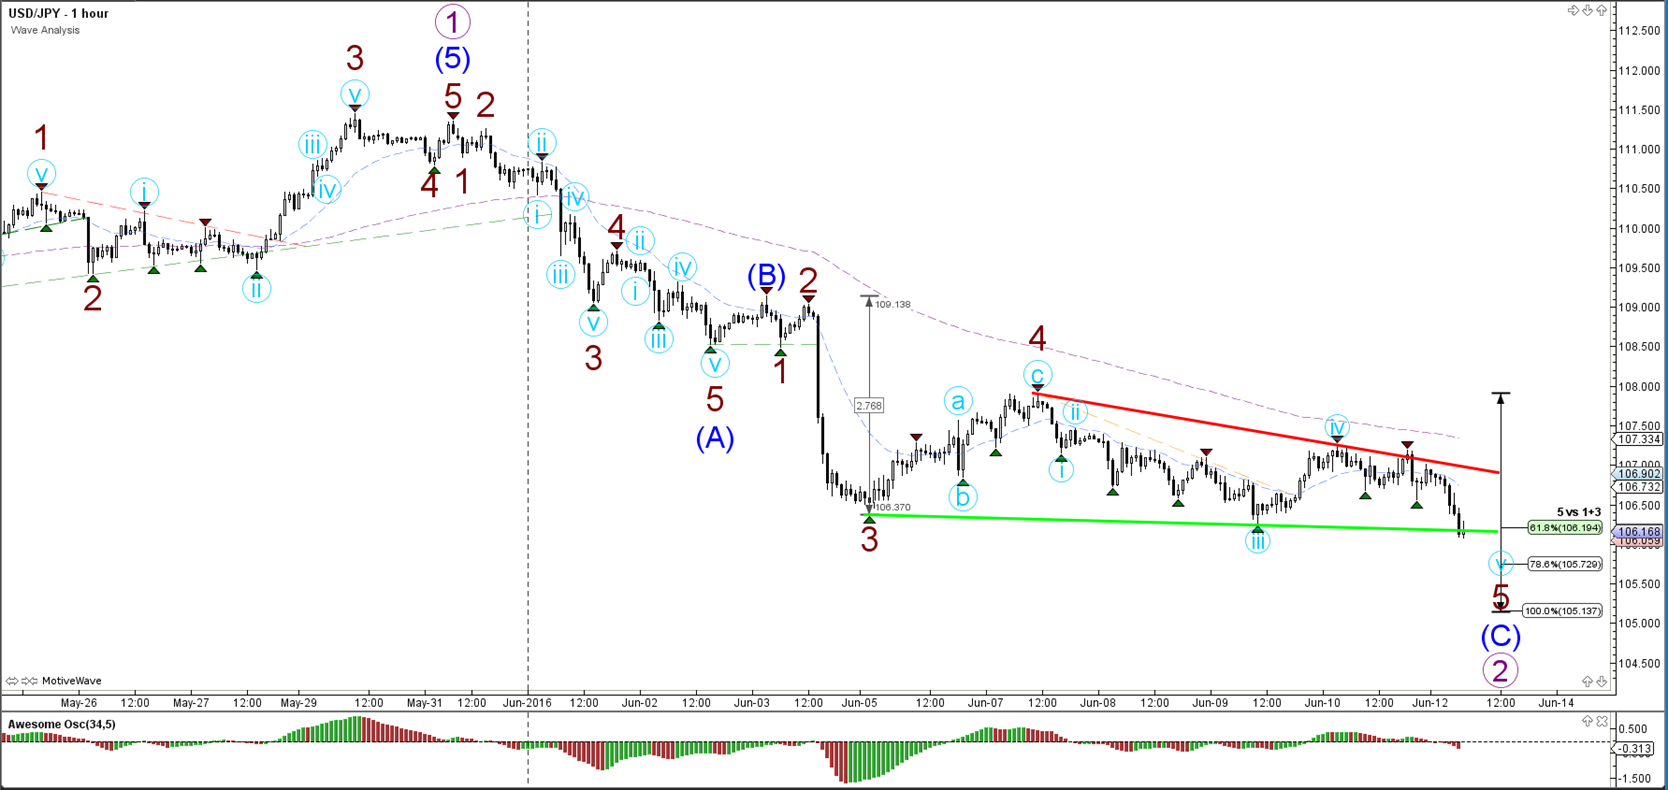
The USD/JPY is testing a support trend line (green). A break below it could see price challenge the 100% Fib level of the 4 hour chart. A break above resistance could start a reversal.
“Original analysis is provided by Admiral Markets”