Elliott Wave Analysis by Admiral Markets

EUR/USD, GBP/USD Build Shallow Retracements after Bearish Breakout

EUR/USD

4 hour

16-08-2017eu4.png


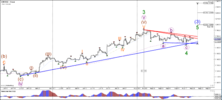
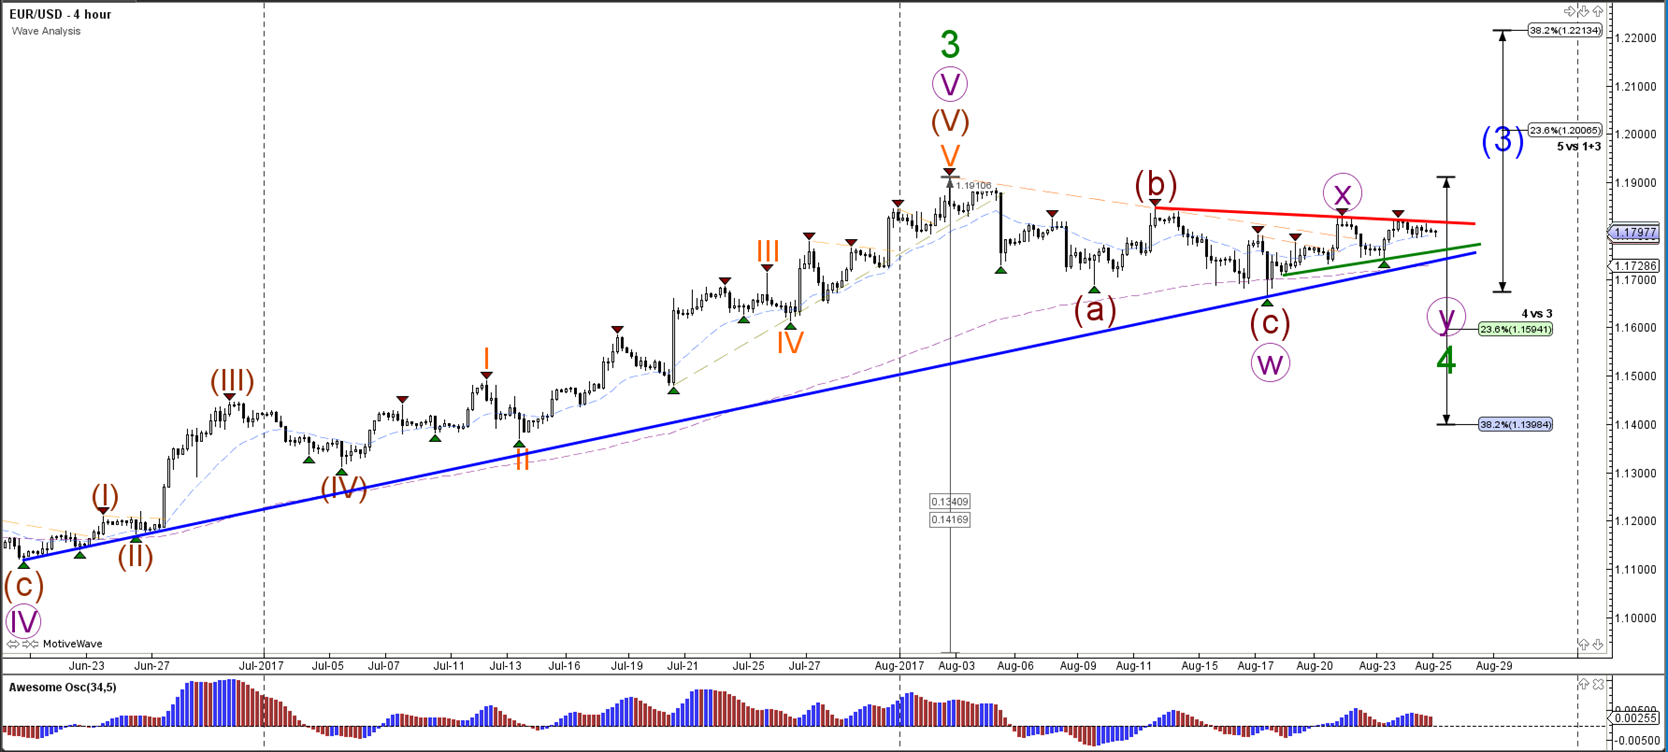
The EUR/USD is showing bearish continuation as expected in the wave analysis earlier this week. Price is building a potential ABC (purple) correction within a larger wave 4 (green). The main target of the ABC are the Fibonacci levels of wave 4 vs 3 (green).

1 hour

16-08-2017eu1.png


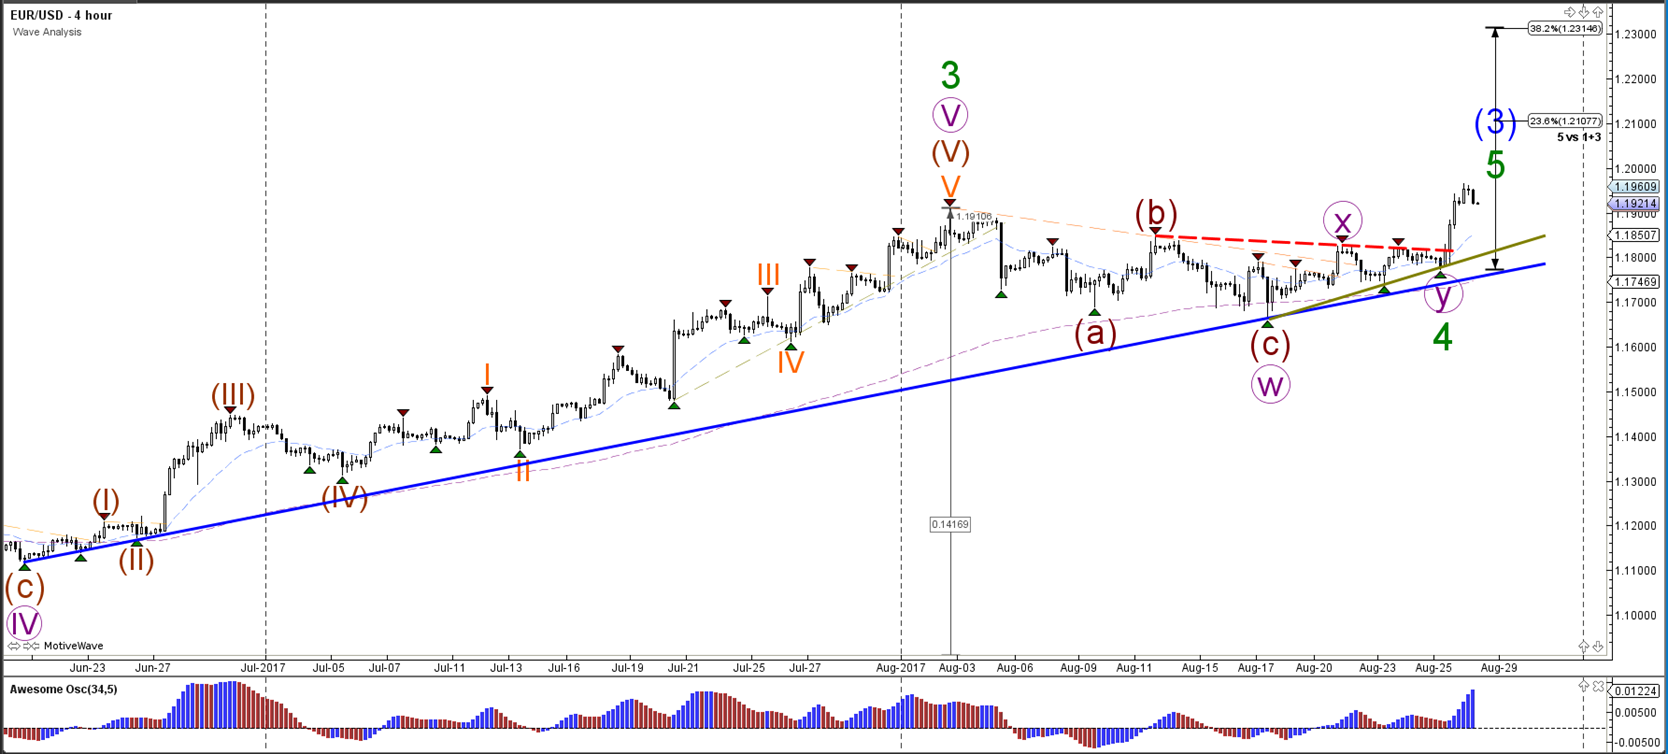
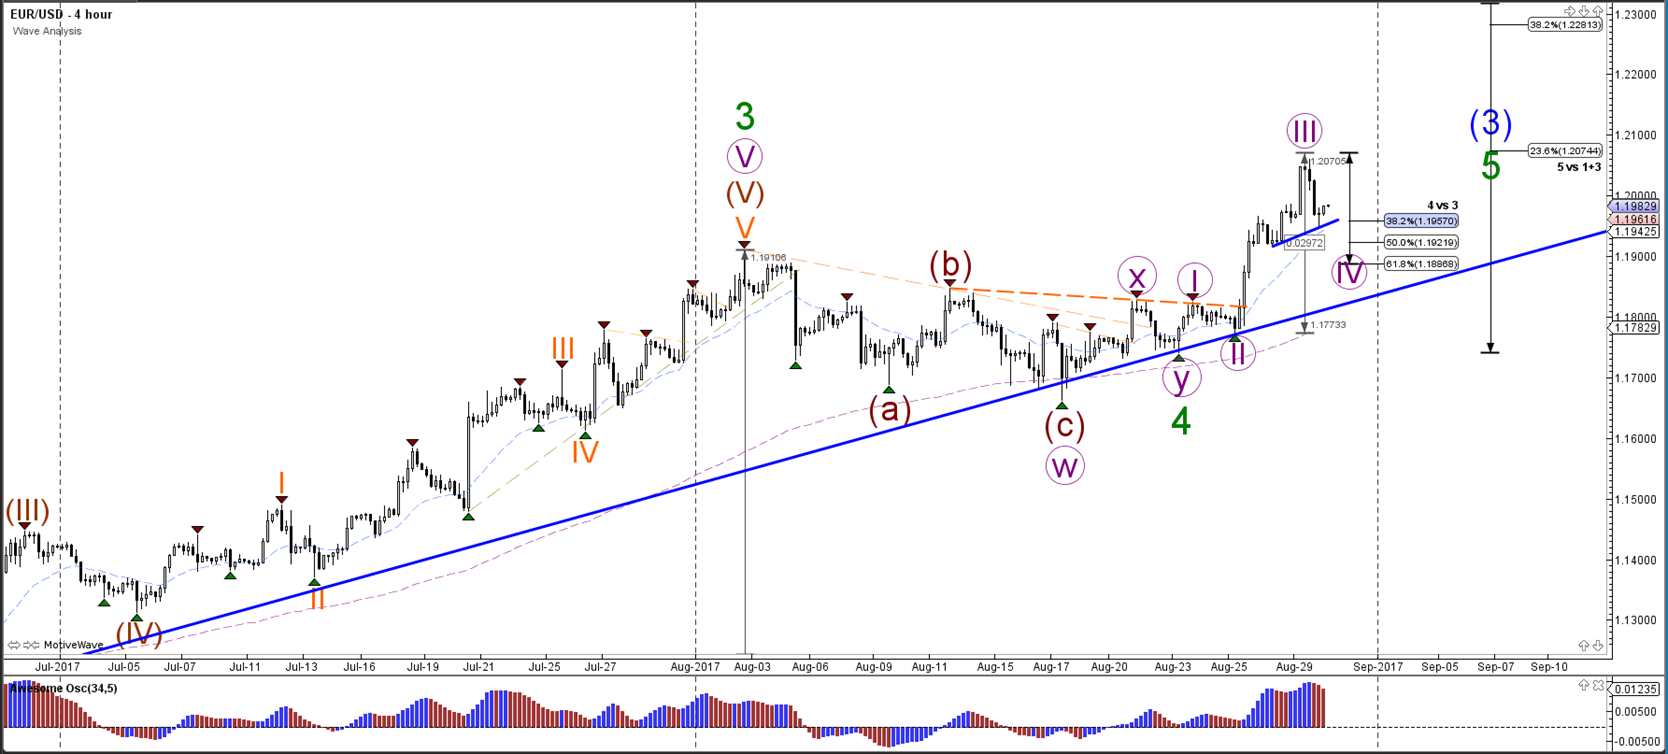
The EUR/USD broke below the support trend line (dotted blue) but was unable to break below the bottom (green line). Price is now building a pullback, which could be a wave 4 (brown). A break above the 61.8% and resistance trend line (red) makes a wave 4 less likely. A break below support (greens) could see price continue towards 23.6% Fib.

GBP/USD

4 hour

16-08-2017gu4.png


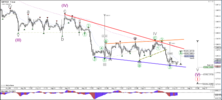
The GBP/USD broke below the support trend line (dotted blue) and continued the downtrend.
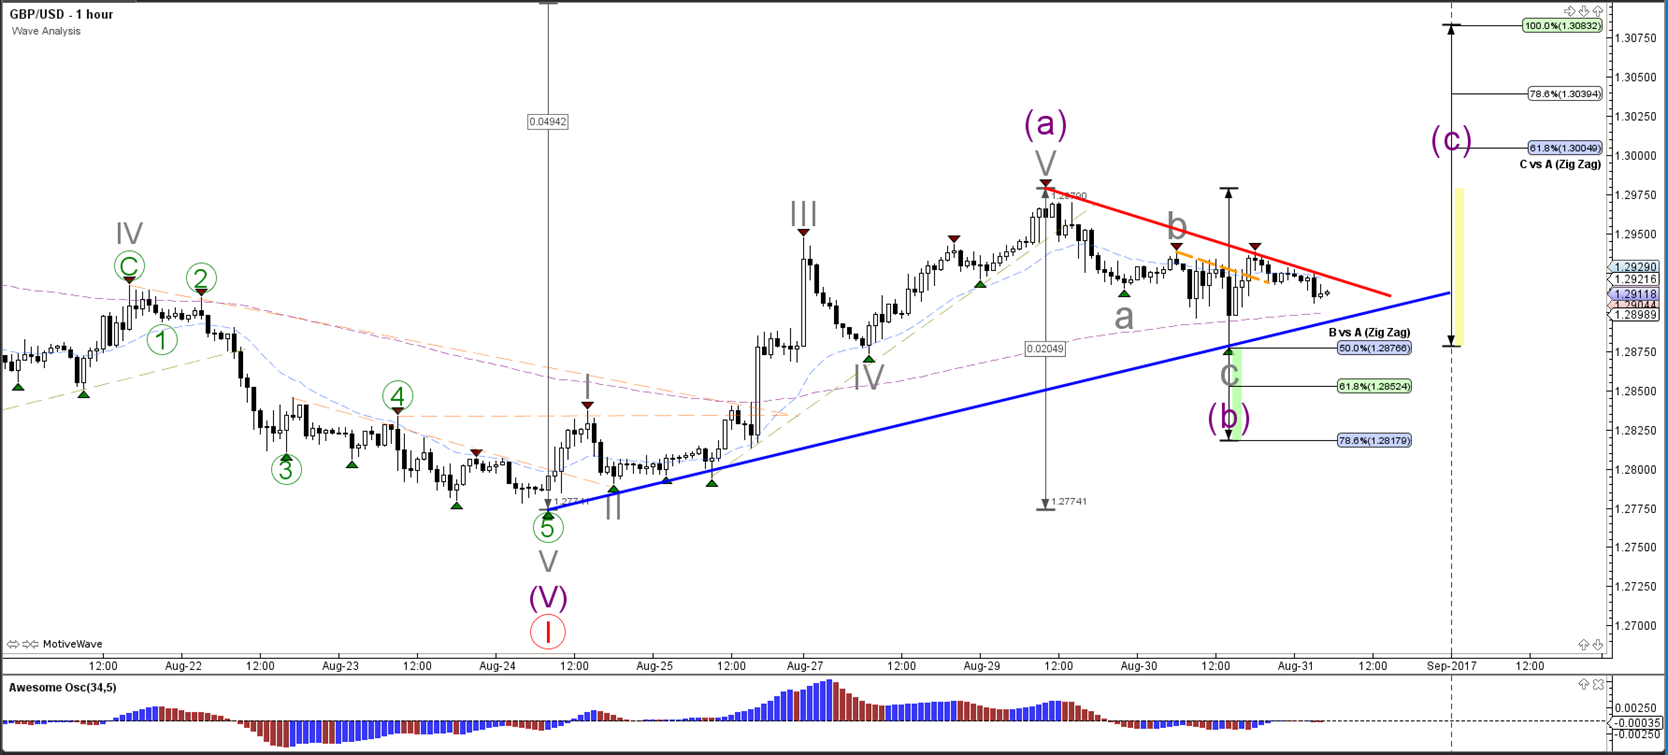
1 hour

16-08-2017gu1.png


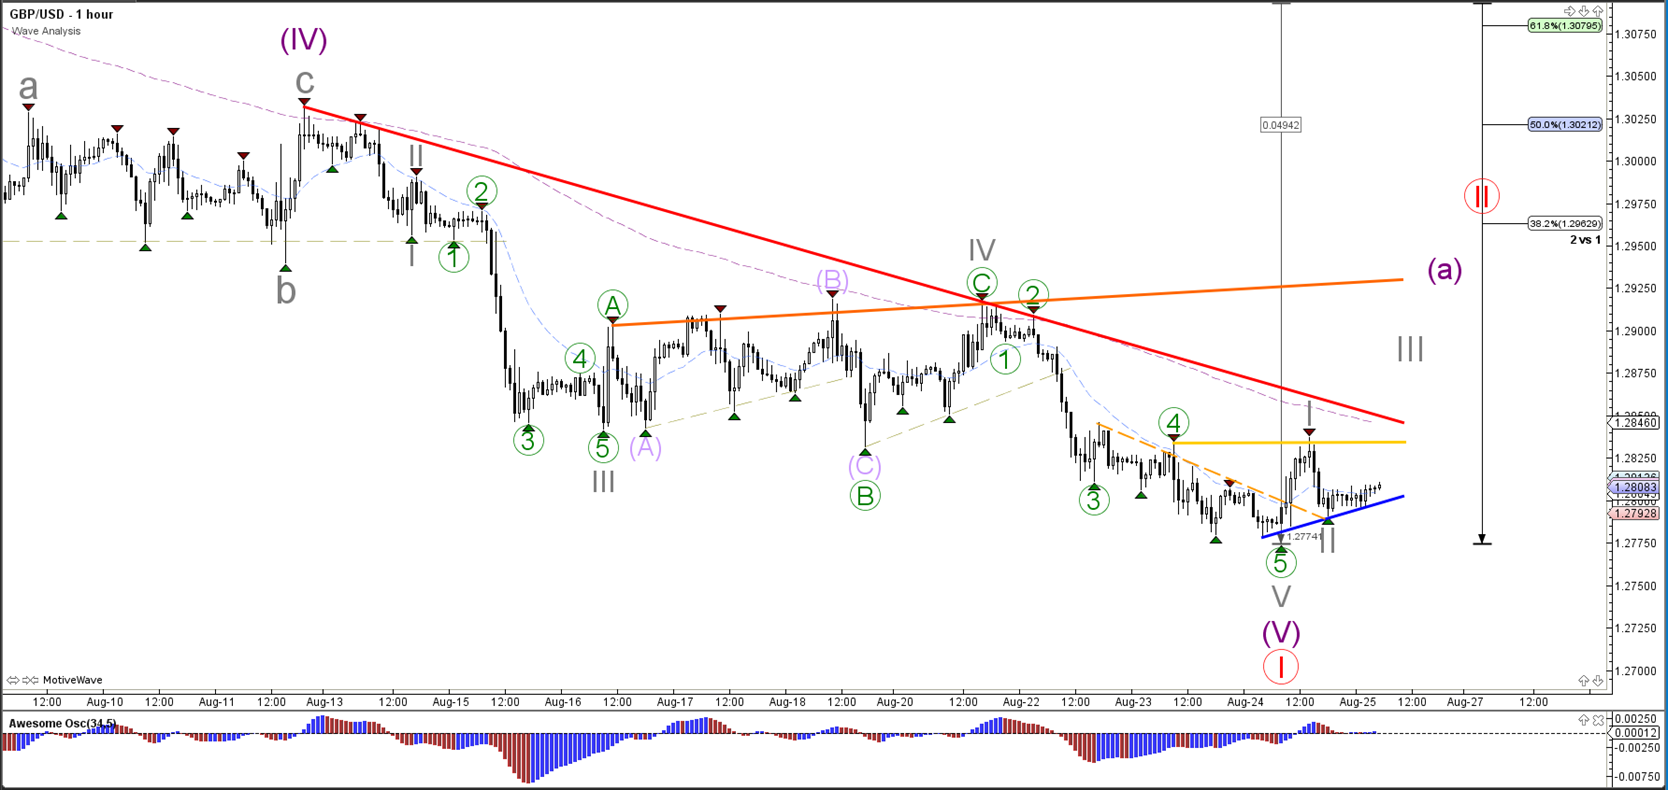
The GBP/USD is building an extension within the 5th wave with another 5 waves (grey). The current pullback is a bear flag chart pattern and could be a wave 4 (grey). A break above the 61.8% Fibonacci level invalidates the wave 4.

USD/JPY

4 hour

16-08-2017uj4.png


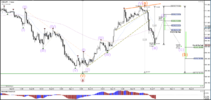
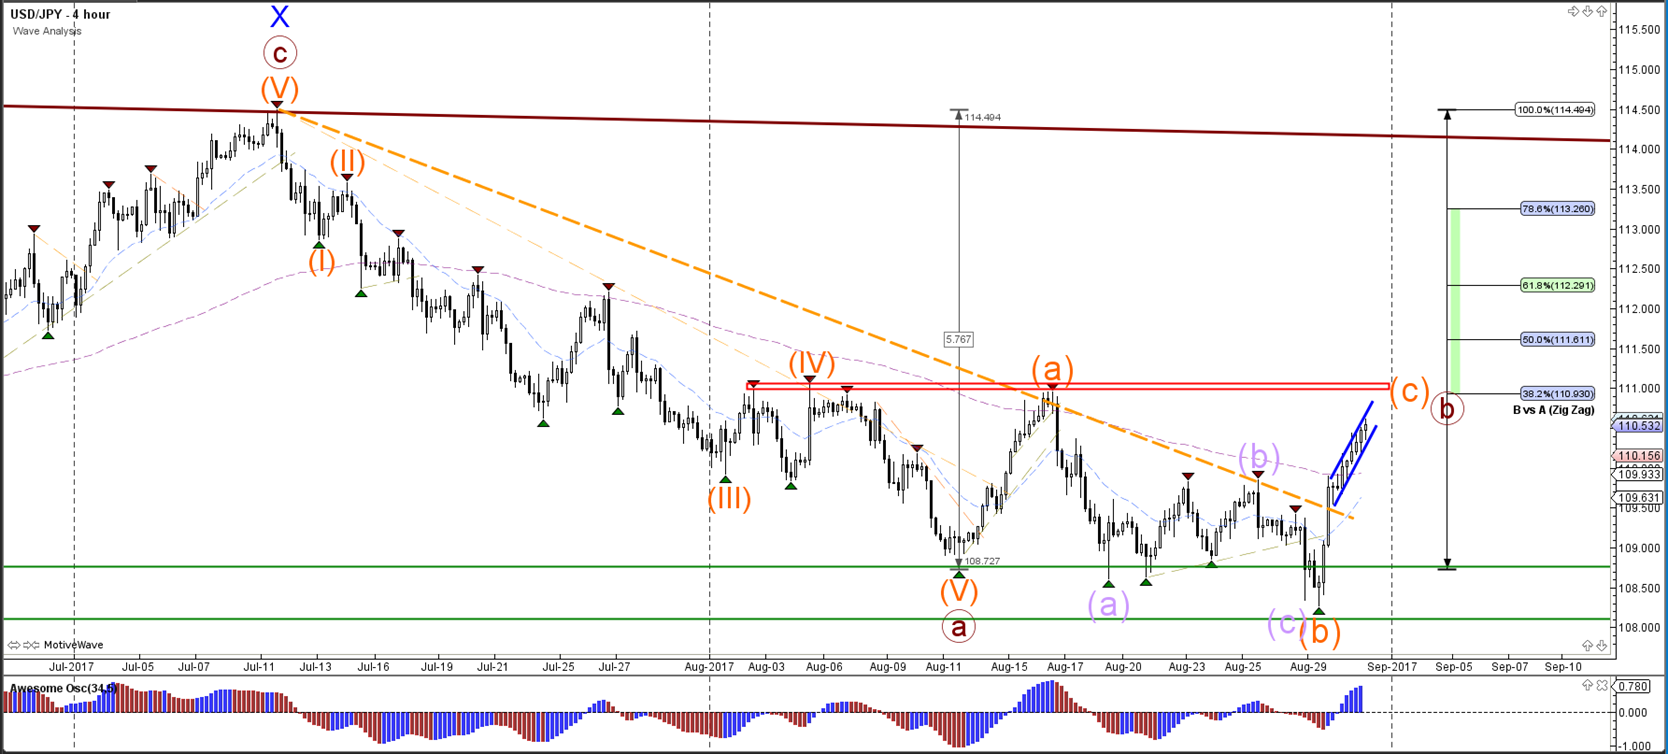
The USD/JPY breakout managed to reach the 38.2% Fibonacci resistance level of the wave B (brown), which could cause a bearish bounce and complete wave A (orange).
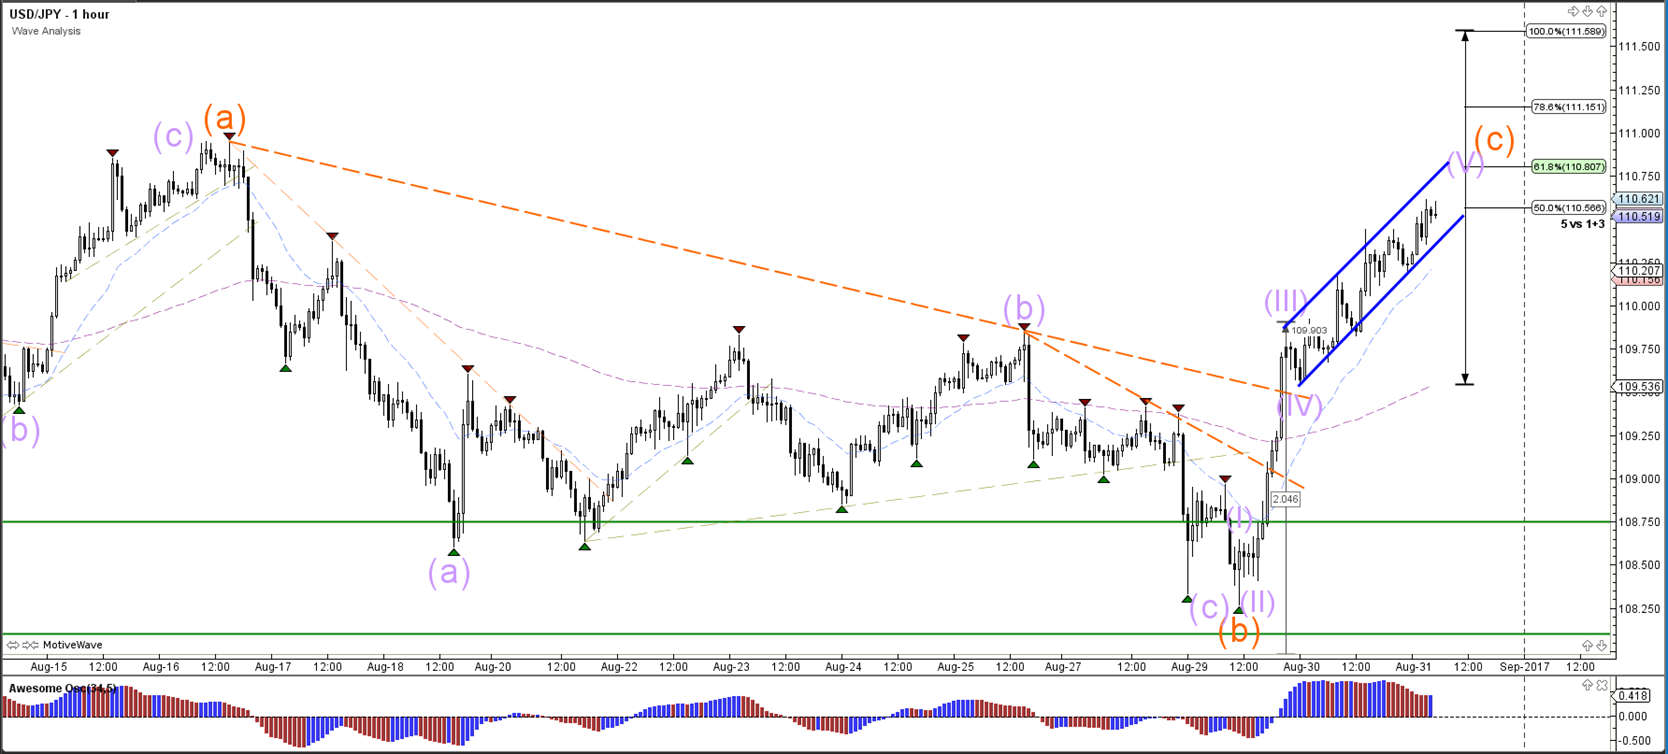
1 hour

16-08-2017uj1.png


The USD/JPY seems to have completed wave 5 (purple) within wave A (orange). A bullish break above resistance (orange) could see an extension the uptrend whereas a bearish break of the support trend lines could see an ABC (purple) within wave B (orange).

Follow @ChrisSvorcik on twitter for latest market updates.

Connect with Chris Svorcik on Facebook for latest Forex and education tips.

Risk disclosure: Forex and CFD trading carries a high level where losses can exceed your deposits. This material is does not contain, and should not be construed as containing, investment advice or an investment recommendation or, an offer of or solicitation for any transactions in financial instruments. Please note that the trading analyses which refers to past performance, may change over time. No representation is given as to the accuracy or completeness of the information and any person acting upon it does so entirely at their own risk. Before making any investment decisions, you should seek advice from independent financial advisor to ensure you understand the risks involved.
 
TITLE: EUR/USD Completes Zigzag and Uptrend Challenges Resistance at 1.18

EUR/USD

4 hour

upload_2017-8-17_10-24-42.png


The EUR/USD showed a strong bullish 4 hour candle at the support trend lines (green/blue), which indicates the potential completion of the wave 4 (green) correction. A break above the resistance trend line (red) increases the chance for a wave 5 (green) breakout.

1 hour

upload_2017-8-17_10-24-22.png


The EUR/USD seems to have completed a wave 4 and 5 (brown) within wave C (purple). The bullish bounce also offers 5 waves which could complete wave 1 (purple).

GBP/USD

4 hour

upload_2017-8-17_10-24-1.png


The GBP/USD is testing the resistance trend line (red). A bullish break should start a wave 2 (red) correction whereas a bearish bounce could still indicate the continuation of wave 5 of wave 1 (red).

1 hour

upload_2017-8-17_10-23-48.png


The alternative structure is that the GBP/USD is building a wave 4 (grey) within the downtrend. This scenario is invalidated if price manages to break above the resistance trend line (red) and 61.8% Fib of wave 4 vs 3.

USD/JPY

4 hour

upload_2017-8-17_10-23-25.png


The USD/JPY turned at the 38.2% Fibonacci resistance level which completed a potential wave A (orange). The bearish price action could be part of an ABC within wave B (brown). The invalidation level of the wave B is the 100% Fib level of wave B vs A at 108.73

1 hour

upload_2017-8-17_10-23-4.png


The USD/JPY showed bearish momentum which could be a wave A (purple) within a larger ABC of wave B (orange). The invalidation level of the wave A is the 100% Fib level of wave B vs A at 110.95.

Follow @ChrisSvorcik on twitter for latest market updates.

Connect with Chris Svorcik on Facebook for latest Forex and education tips.

Risk disclosure: Forex and CFD trading carries a high level where losses can exceed your deposits. This material is does not contain, and should not be construed as containing, investment advice or an investment recommendation or, an offer of or solicitation for any transactions in financial instruments. Please note that the trading analyses which refers to past performance, may change over time. No representation is given as to the accuracy or completeness of the information and any person acting upon it does so entirely at their own risk. Before making any investment decisions, you should seek advice from independent financial advisor to ensure you understand the risks involved.
 

Attachments

  • 17-08-2017uj1.png
    17-08-2017uj1.png
    258.6 KB · Views: 4
  • 17-08-2017uj1.png
    17-08-2017uj1.png
    258.6 KB · Views: 3
  • 17-08-2017uj1.png
    17-08-2017uj1.png
    258.6 KB · Views: 3
EUR/USD Develops Bull Flag Chart Pattern at Support Zone

EUR/USD

4 hour

upload_2017-8-21_10-49-20.png


The EUR/USD is building a bull flag continuation chart pattern above the long-term trend line (blue), local support (blue), and long-term moving average, which favours a wave 4 (green) correction. A bullish break above resistance (red) would confirm the end of wave 4 and start of wave 5.

1 hour

upload_2017-8-21_10-49-38.png


The EUR/USD seems to be building a wave 1-2 (purple) as long as price stays above the 100% Fib level of wave 2 vs 1. A break above resistance (red) line could see the start of wave 3.

USD/JPY

4 hour

upload_2017-8-21_10-49-59.png


The USD/JPY has retested key support zone (green lines), which will act as bounce or break spot. A bullish bounce could see price expand a wave B (brown) correction via an ABC (orange) flat whereas a bearish break would indicate a downtrend continuation and the completion of wave B (brown) at 111 (where A orange is now).

1 hour

upload_2017-8-21_10-50-16.png


The USD/JPY is testing the resistance trend line of the bearish channel (orange lines).

GBP/USD

4 hour

upload_2017-8-21_10-50-34.png


The GBP/USD could have completed a 5th wave (purple) within wave 1 (red). A bearish bounce at the resistance trend line (red) could see price move lower towards the Fib targets of wave 5.

1 hour

upload_2017-8-21_10-50-47.png


A GBP/USD bullish break above resistance (red/orange) could see the start of a wave 2 (red).

Follow @ChrisSvorcik on twitter for latest market updates.
Connect with Chris Svorcik on Facebook for latest Forex and education tips.

Risk disclosure: Forex and CFD trading carries a high level where losses can exceed your deposits. This material is does not contain, and should not be construed as containing, investment advice or an investment recommendation or, an offer of or solicitation for any transactions in financial instruments. Please note that the trading analyses which refers to past performance, may change over time. No representation is given as to the accuracy or completeness of the information and any person acting upon it does so entirely at their own risk. Before making any investment decisions, you should seek advice from independent financial advisor to ensure you understand the risks involved.
 

Attachments

  • 21-08-2017eu4.png
    21-08-2017eu4.png
    235 KB · Views: 3
EUR/USD First Signs of Bullish Break above 1.18 Bull Flag

EUR/USD

4 hour

upload_2017-8-22_10-44-36.png


The EUR/USD is breaking above resistance trend lines (dotted reds) of a bull flag continuation chart pattern of a wave 4 (green) correction. This bullish break above resistance (red) could confirm the end of wave 4 and start of wave 5.

1 hour

upload_2017-8-22_10-44-27.png


The EUR/USD seems to be building a 5 wave extension within wave 3 (purple). The wave 4 (brown) pullback should not retrace deeper than the 50% at 1.1780 otherwise the wave 4 is invalidated. A break above the bull flag chart pattern confirms the continuation of the wave 3 (purple) towards the Fib targets of wave 3 vs 1.

USD/JPY

4 hour

upload_2017-8-22_10-44-14.png


The USD/JPY has bounced again at the key support zone (green lines). The bullish bounce could see price expand a wave B (brown) correction via an ABC (orange) flat.

1 hour

upload_2017-8-22_10-44-1.png


The USD/JPY broke above the resistance trend line (dotted orange) of the downtrend and is now showing a potential bounce. A bullish break above resistance (red) would confirm the potential wave 3 (purple) whereas a bearish break below support (green) would invalidate it.

GBP/USD

4 hour

upload_2017-8-22_10-43-42.png


The GBP/USD could have completed a 5th wave (purple) within wave 1 (red). A bullish bounce at the support trend line (blue) could see price move higher towards the Fibonacci retracement levels of wave 2 (red).

1 hour

upload_2017-8-22_10-43-32.png


A GBP/USD seems to be building a large correction via WXY (purple).

Follow @ChrisSvorcik on twitter for latest market updates.

Connect with Chris Svorcik on Facebook for latest Forex and education tips.

Risk disclosure: Forex and CFD trading carries a high level where losses can exceed your deposits. This material is does not contain, and should not be construed as containing, investment advice or an investment recommendation or, an offer of or solicitation for any transactions in financial instruments. Please note that the trading analyses which refers to past performance, may change over time. No representation is given as to the accuracy or completeness of the information and any person acting upon it does so entirely at their own risk. Before making any investment decisions, you should seek advice from independent financial advisor to ensure you understand the risks involved.
 
EUR/USD Slips Back into Triangle Pattern and Awaits Breakout

EUR/USD

4 hour

upload_2017-8-23_12-36-46.png


The EUR/USD failed to immediately continue with the bullish breakout yesterday and is building an expanded wave 4 (green) correction via a WXY (purple) pattern. A next breakout above the resistance trend line (red) of the contracting triangle pattern could see the continuation of wave 3 (blue).

1 hour

upload_2017-8-23_12-36-35.png


The EUR/USD is building a smaller triangle pattern which are indicated by the support (green) and resistance (orange) trend lines. A break below support could see price challenge the bigger support zone (blue) and perhaps even the 23.6% Fib of wave 4 vs 3. A break above resistance could see price test the bigger resistance line (red). There is the possibility of an ABC (brown) correction before wave 4 (green) is ready but a break above the major resistance (red) would invalidate that and indicate a potential bullish breakout.

USD/JPY

4 hour

upload_2017-8-23_12-36-23.png


The USD/JPY made a bullish rally away from the key support zone (green lines) but bearish price action is now challenging the support trend line (blue). A bounce could see price move higher towards the Fib levels of wave B vs A whereas a bearish break could indicate a retest of the support zone.

1 hour

upload_2017-8-23_12-36-11.png


The USD/JPY is testing the intermediate support levels (blue lines). Price is either building a 123 (purple) or completed an ABC (blue), which will depend on how price responds to the support trend lines.

GBP/USD

4 hour

upload_2017-8-23_12-35-59.png


The GBP/USD made a new lower low but was unable to break below the support trend line (blue). The downtrend channel (red) is still valid for this Cable pair and price could test the Fib levels.

1 hour

upload_2017-8-23_12-35-29.png


The GBP/USD bearish breakout (dotted green) is most likely a wave 3 (green). The wave 4 (green) is valid as long as price stays below the 61.8% Fib at 1.2872.

Follow @ChrisSvorcik on twitter for latest market updates.

Connect with Chris Svorcik on Facebook for latest Forex and education tips.

Risk disclosure - Forex and CFD trading carries a high level where losses can exceed your deposits. This material is does not contain, and should not be construed as containing, investment advice or an investment recommendation or, an offer of or solicitation for any transactions in financial instruments. Please note that the trading analyses which refers to past performance, may change over time. No representation is given as to the accuracy or completeness of the information and any person acting upon it does so entirely at their own risk. Before making any investment decisions, you should seek advice from independent financial advisor to ensure you understand the risks involved.
 

Attachments

  • upload_2017-8-23_11-4-55.png
    upload_2017-8-23_11-4-55.png
    276.6 KB · Views: 3
EUR/USD Retests Resistance of Bull Flag Pattern at 1.1825

EUR/USD

4 hour

upload_2017-8-24_10-41-38.png


The EUR/USD is challenging the resistance trend line (red) of the bull flag chart pattern. At the moment it is unable to break and a correction back to the support trend lines is possible. The next breakout above resistance (red) of the contracting triangle pattern should see the continuation of wave 3 (blue).

1 hour

upload_2017-8-24_10-41-24.png


The EUR/USD has arrived at a break spot. A break below support (light green) could see price challenge the bigger support zones (green/blue) and perhaps even the 23.6% Fib of wave 4 vs 3, whereas a break above resistance could lead to an uptrend continuation. There is the possibility of an ABC (brown) correction before wave 4 (green) is ready but a break above the major resistance (red) would invalidate that and indicate a potential bullish breakout.

USD/JPY

4 hour

upload_2017-8-24_10-41-9.png


The USD/JPY is again retesting the support zone (green lines). A bounce could see price move higher towards the Fib levels of wave B vs A whereas a bearish break could indicate a downtrend continuation.

1 hour

upload_2017-8-24_10-40-52.png


The USD/JPY is building a channel (red/blue lines) at the support zone (green).

GBP/USD

4 hour

upload_2017-8-24_10-40-37.png


The GBP/USD is moving lower within the downtrend channel (red). The round quarter level of 1.2750 could act as a support zone.

1 hour

upload_2017-8-24_10-40-23.png


The GBP/USD indeed completed a wave 4 (green) correction and is moving lower in a smaller channel (orange lines).

Follow @ChrisSvorcik on twitter for latest market updates.

Connect with Chris Svorcik on Facebook for latest Forex and education tips.

Risk disclosure - Forex and CFD trading carries a high level where losses can exceed your deposits. This material is does not contain, and should not be construed as containing, investment advice or an investment recommendation or, an offer of or solicitation for any transactions in financial instruments. Please note that the trading analyses which refers to past performance, may change over time. No representation is given as to the accuracy or completeness of the information and any person acting upon it does so entirely at their own risk. Before making any investment decisions, you should seek advice from independent financial advisor to ensure you understand the risks involved.
 
GBP/USD Challenges Resistance of Downtrend Channel after 1.2775 Bounce

GBP/USD

4 hour


25-08-2017gu4.png1668x790 230 KB


The GBP/USD is testing the resistance line of the downtrend channel (red) after indeed bouncing near the round quarter support level of 1.2750. A bullish breakout could start wave A (purple) of a larger wave 2 (red) correction. A bearish break below support (blue) and the 1.2750 support could restart the downtrend within the channel.

1 hour


25-08-2017gu1.png1668x790 217 KB


The GBP/USD broke above the resistance trend line (dotted orange) and could be starting a wave A (purple) correction if price manages to break above the next resistance trend lines and stay above support (blue).

EUR/USD

4 hour


25-08-2017eu4.png1668x752 212 KB


The EUR/USD is building an extended and complex correction within wave 4 (green). Price is still challenging the resistance trend line (red) of the triangle chart pattern and the next breakout above resistance (red) should see the continuation of wave 3 (blue). Price could also retest the support trend lines (green/blue) within wave Y (purple).

1 hour


25-08-2017eu1.png1668x790 234 KB


The EUR/USD is building a sideways correction and has both support (green) and resistance (red) nearby. There is the possibility of an ABC (brown) correction before wave 4 (green) is ready but a break above the major resistance (red) would indicate a potential bullish breakout.

USD/JPY

4 hour


25-08-2017uj4.png1668x789 242 KB


The USD/JPY is again bouncing at the support zone (green lines). A bounce could see price move higher towards the Fib levels of wave B vs A whereas a bearish break could indicate a downtrend continuation.

1 hour


25-08-2017uj1.png1668x790 238 KB


The USD/JPY is building a channel (red/blue lines) at the support zone (green).

Follow @ChrisSvorcik on twitter for latest market updates.
Connect with Chris Svorcik on Facebook for latest Forex and education tips.

Risk disclosure - Forex and CFD trading carries a high level where losses can exceed your deposits. This material is does not contain, and should not be construed as containing, investment advice or an investment recommendation or, an offer of or solicitation for any transactions in financial instruments. Please note that the trading analyses which refers to past performance, may change over time. No representation is given as to the accuracy or completeness of the information and any person acting upon it does so entirely at their own risk. Before making any investment decisions, you should seek advice from independent financial advisor to ensure you understand the risks involved.
 
EUR/USD Bullish Break above Triangle Pattern Challenges 1.20

EUR/USD

4 hour


28-08-2017eu4.png1668x754 209 KB


The EUR/USD did break above the resistance trend line (dotted red) of the triangle chart pattern as expected. This breakout is a continuation of wave 5 (green) of wave 3 (blue). The first target is the round level of 1.20, which could cause a retracement.

1 hour


28-08-2017eu1.png1668x754 213 KB


The EUR/USD bullish breakout is building an internal 5 wave (purple) and is currently in a wave 3 (purple).

USD/JPY

4 hour


28-08-2017uj4.png1668x754 232 KB


The USD/JPY remains caught in between support (green lines) and resistance (orange). A bounce could see price move higher towards the Fib levels of wave B vs A whereas a bearish break could indicate a downtrend continuation.

1 hour


28-08-2017uj1.png1668x754 215 KB


The USD/JPY is building a channel (red/blue lines) at the support zone (green).

GBP/USD

4 hour


28-08-2017gu4.png1668x789 226 KB


The GBP/USD bullish breakout indeed took place as expected and started wave A (purple) of a larger wave 2 (red) correction.

1 hour


28-08-2017gu1.png1668x753 225 KB


The GBP/USD could have completed an ABC wave (purple) at the recent high or it could be building a wave 4-5 within wave A (purple). This depends on whether price will bounce at the 61.8% Fibonacci level of wave 4 vs 3.

Follow @ChrisSvorcik on twitter for latest market updates. Connect with Chris Svorcik on Facebook for latest Forex and education tips.

Risk disclosure - Forex and CFD trading carries a high level where losses can exceed your deposits. This material is does not contain, and should not be construed as containing, investment advice or an investment recommendation or, an offer of or solicitation for any transactions in financial instruments. Please note that the trading analyses which refers to past performance, may change over time. No representation is given as to the accuracy or completeness of the information and any person acting upon it does so entirely at their own risk. Before making any investment decisions, you should seek advice from independent financial advisor to ensure you understand the risks involved.
 
EUR/USD Break, Pullback and Continuation Pattern at 1.20 Resistance

EUR/USD

4 hour


30-08-2017eu4.png1668x754 215 KB


The EUR/USD broke above the 1.20 round level resistance and continued its bullish momentum towards the 23.6% Fibonacci target at 1.2075. Price made a strong bearish retracement after hitting this target and fell back to the 38.2% Fibonacci support level of wave 4 (purple), which could be a potential support zone within wave 5 (green).

1 hour


30-08-2017eu1.png1668x753 205 KB


The EUR/USD is most likely in a wave 4 (purple) correction when considering the strong bullish momentum within wave 3 (purple). A break below the 61.8% Fibonacci level of wave 4 vs 3 makes the wave 4 (purple) unlikely. A typical correction pattern for wave 4 (purple) is an ABCDE contracting triangle.

USD/JPY

4 hour


30-08-2017uj4.png1668x791 235 KB


The USD/JPY failed to break the support zone (green) indicated by the green lines. The bearish price action now looks like an ABC (purple) correction within wave B (orange) and price is building a wave C within wave B (brown).
1 hour


30-08-2017uj1.png1668x790 212 KB


The USD/JPY bullish momentum is probably a wave 3 (purple). Once wave 3 is completed, a wave 4 (purple) correction could take place back to the Fib levels of wave 4 vs 3 which could cause a potential bullish bounce.

GBP/USD

4 hour


30-08-2017gu4.png1668x790 231 KB


The GBP/USD bullish momentum has probably completed a wave A (purple), which stopped at the 38.2% Fibonacci resistance level. Price could now be building a correction within wave B (purple).
1 hour


30-08-2017gu1.png1668x790 238 KB


The GBP/USD completed a 5 wave (grey) pattern within wave A (purple). Price is now building a potential ABC correction (grey) within wave B (purple).

Follow @ChrisSvorcik on twitter for latest market updates.
Connect with Chris Svorcik on Facebook for latest Forex and education tips.

Risk disclosure - Forex and CFD trading carries a high level where losses can exceed your deposits. This material is does not contain, and should not be construed as containing, investment advice or an investment recommendation or, an offer of or solicitation for any transactions in financial instruments. Please note that the trading analyses which refers to past performance, may change over time. No representation is given as to the accuracy or completeness of the information and any person acting upon it does so entirely at their own risk. Before making any investment decisions, you should seek advice from independent financial advisor to ensure you understand the risks involved.
 
EUR/USD Break, Pullback and Continuation Pattern at 1.20 Resistance

EUR/USD

4 hour


31-08-2017eu4.png1668x754 222 KB


The EUR/USD broke above the 1.20 round level resistance and continued its bullish momentum towards the 23.6% Fibonacci target at 1.2075. Price made a strong bearish retracement after hitting this target and fell back to the 38.2% Fibonacci support level of wave 4 (purple), which could be a potential support zone within wave 5 (green).

1 hour


31-08-2017eu1.png1668x754 196 KB


The EUR/USD is most likely in a wave 4 (purple) correction when considering the strong bullish momentum within wave 3 (purple). A break below the 61.8% Fibonacci level of wave 4 vs 3 makes the wave 4 (purple) unlikely. A typical correction pattern for wave 4 (purple) is an ABCDE contracting triangle.

USD/JPY

4 hour


31-08-2017uj4.png1668x754 238 KB


The USD/JPY failed to break the support zone (green) indicated by the green lines. The bearish price action now looks like an ABC (purple) correction within wave B (orange) and price is building a wave C within wave B (brown).

1 hour


31-08-2017uj1.png1668x754 213 KB


The USD/JPY bullish momentum is probably a wave 3 (purple). Once wave 3 is completed, a wave 4 (purple) correction could take place back to the Fib levels of wave 4 vs 3 which could cause a potential bullish bounce.

GBP/USD

4 hour


31-08-2017gu4.png1668x754 239 KB


The GBP/USD bullish momentum has probably completed a wave A (purple), which stopped at the 38.2% Fibonacci resistance level. Price could now be building a correction within wave B (purple).

1 hour

bcaf301f1d4b1dd8ae60504b5d9c2f8b8164f38c.png


The GBP/USD completed a 5 wave (grey) pattern within wave A (purple). Price is now building a potential ABC correction (grey) within wave B (purple).

Follow @ChrisSvorcik on twitter for latest market updates.
Connect with Chris Svorcik on Facebook for latest Forex and education tips.

Risk disclosure - Forex and CFD trading carries a high level where losses can exceed your deposits. This material is does not contain, and should not be construed as containing, investment advice or an investment recommendation or, an offer of or solicitation for any transactions in financial instruments. Please note that the trading analyses which refers to past performance, may change over time. No representation is given as to the accuracy or completeness of the information and any person acting upon it does so entirely at their own risk. Before making any investment decisions, you should seek advice from independent financial advisor to ensure you understand the risks involved.
 
Back
Top