FOREX PRO Weekly August 08-12, 2011

EUR/USD Daily Update Tue 09, August, 2011

Good morning,
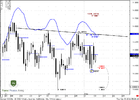
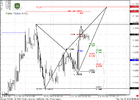
today is really few that I can add to weekly analysis. Market has accomplished first part of our trading plan - continued a bit higher on Monday, then turned to retracement and has reached 1.4150-1.42 support area. According to our trading plan - now it's time to enter long.
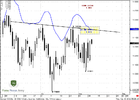
Currently I do not see any clear Buy patterns around right shoulder on 4-hour chart, except 0.618 Fib support that is logical for H&S and respect of this level by the market.
So, you can enter differently -wait for clear pattern to buy on 5- min chart, enter just from the level but with reduced volume etc - this is a question of risk management and personality.

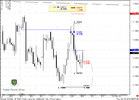
Logical stop is below 0.88 support on 4 hour chart, if you trade intraday H&S ro below the low of 1.4041 o daily - if you trade Daily "piercing in the cloud pattern" and H&S.

Nearest target - 1.4450 - 0.618 of daily H&S and neckline, 1.0 of 4-hour H&S, daily overbought and weekly pivot resistance 1.

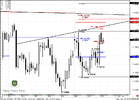
As we've said, the major advantage of current situation that you can enter with great risk/reward ratio, since market now stands very close to crucial point of both patterns.
 

Attachments

  • EUR_D_09_08_11.PNG
    EUR_D_09_08_11.PNG
    47.4 KB · Views: 245
  • EUR_4H_09_08_11.PNG
    EUR_4H_09_08_11.PNG
    41.6 KB · Views: 244
EUR/USD Daily Update, Wed 10, August, 2011

Good morning,
Looks like our trading plan is working...
What could I add more currently? I suppose, you already have Long position. So - tight stops or move them to b/e, if market allows to do that, because right from 1.4445 area strong resistance zone will start.

As we see on daily time frame - 1.4445 pivot resistance, 1.4475 0.618 target of ABC pattern, 1.4495 - daily overbougt.

From 4-hour chart - 1.4479 AB-CD target.
From 1-hour chart - 1.4465 - 1.27 Butterfly Sell target.
And a neckline of smaller H&S pattern.
Now, I think you understand why in our Military School, we recommend to have a position prior market will reach neckline (as classical approach suggest.)
Because now - you can relax and watch the movie. But if you will enter at neckline breakout - you will dive in doom and gloom right a reasistance area and it's a question - will you survive or not...

Still, if you do not have Long position, you may try to have it, although it will have more risk now.
On hourly chart market has hit 1.0 target and turned to retracement. You may try to enter from nearest Fib support at 1.4306 with stop below confluence 1.4365 or even below pivot.
Market should reach at least 1.4450 area. In current circumstances it should not show too deep retracement, because it quite unlogical currently. Probably even if retracement will come -it wil happen around neckline of daily H&S...
 

Attachments

  • EUR_D_10_08_11.PNG
    EUR_D_10_08_11.PNG
    46.6 KB · Views: 178
  • EUR_4H_10_08_11.PNG
    EUR_4H_10_08_11.PNG
    45.4 KB · Views: 178
  • EUR_1H_10_08_11.PNG
    EUR_1H_10_08_11.PNG
    48.5 KB · Views: 180
Hey Sive good morning to you too. You are talking about a "small head and shoulders". I can't see it.

The way you put it , it seems you are not talking about the head and shoulders we've been discussing the last few days but a new one. could u plz point it out??

thx.

another question. How does the opposite moves hourly butterfly sell pattern and the breaking of the neckline on 4-hour buy head and shoulders can coexist??

Have a good day mate, thanks for your time!!

Hi Damian
small H&S you can see on 4-hour chart.
It looks a bit different to you, since previously I've drawn neckline with another slope, because market has not yet formed new high, so that the slope of neckline has changed.

The quesion of co-existing is very good. There could be different scenarios:
1. Market can break the neckline and go t 1.618 butterfy target;
2. Market could show some retracement down from the neckline but then accelerate up further.
3. Market could totally reverse down and erase H&S.

Any of these scenarios are not quite welcome for long position. So, we have to be on guard.
 
H&S on H1 chart

hye sive..
thanks for your great analysis...
in my opinion on H1 chart it seems like H&S..
do you agree with that?
now im little bit confused.. because on H4 also got small H&S..
so if we still hold bullish, where should we enter for buy?
 
Last edited:
Hi

hey sive.

Hope your well, we saw some major EUR sell off today, in the US session. quicker than i have ever seen before and certainly quicker than the move up yesterday after the FOMC meeting.

The down move was somewhat predictable as there was double top, stochastic overbought and bearish divergence on the 1 hour intra day chart.

However, my question to you is, the current move down has found some support at the 50%, fib level from the BIG H&S, the move down is currently around 14180, around the 50% retracement level, from the head to the right shoulder.

Technically, in my opinion, because of such market conditions, i think that H&S, is still viable and tradable. market has not taken out the lows around 14070 and even due to FOMC, people are going to buy EURO for carry trade purposes.

What would you say?

I would also be thankful, if you provide me with the fundamental side of the story.

Thank You

Yousuf.....
 
Last edited:
Divergence

hey sive,

quick thing to add, there is wash and rinse with a hammer on the 4 hour chart of eur usd, PLUS BULLISH DIVERGENCE TOO!!!

and the market over reacted on the whole france situation because, S&P has rated france AAA with a stable outlook -_-
 
Back
Top